

Gold miners just did something they almost never do…
They beat gold.
The ratio of the big gold miner fund (GDX) to the gold price closed at 0.0223 on September 22. That’s higher than 98% of its monthly readings over the last ten years.
And the ratio’s still about 66% below its all-time high.
Mining.com caught the start of it back in August:
Gold miners surge more than 20% in breakout week
“The VanEck Gold Miners ETF (GDX) rose 21.09% over five days to $89.73 just after midday in New York… The rally highlights miners’ leverage to the gold price: revenue can rise rapidly when bullion advances while many operating costs adjust more slowly… Junior miners outpaced their larger peers, a pattern often seen during sharp increases in gold prices because smaller and higher-cost producers can have greater operational leverage.”
Over the past three months, GDX is up 26%, and the junior miner fund (GDXJ) is up 27%, while Gold gained about 6% over the same stretch.
Why the difference?
Gold miners and juniors are finally starting to see the results of gold’s rising price over the past several years. Gold miners’ profits are based on what an ounce sells for and what it costs to dig out. Then they consistently forecast their revenue and profit margins based on lower-than-expected precious metal prices. So, now that they’ve started to report consistent profit over the past several quarters, stock valuations are coming up with them. Not to mention that bonds are becoming worth less.
The World Gold Council tracks the cost of excavation, processing, and production across the industry. In the first quarter of 2026, the average miner spent $1,785 to produce an ounce of gold, counting everything it takes to keep the mine running.
Now, at today’s gold price of about $4,400. That leaves the miner roughly $2,600 of margin on every ounce.
Say gold rises 10%, to about $4,840. The miner’s costs stay about the same, because fuel, wages, and equipment don’t reprice overnight. So the whole $440 gain lands on the margin, which climbs to about $3,050.
Gold went up 10%. The miner’s profit per ounce went up about 17%. What’s happening is the cost to produce lags the rising price of gold.
In the end, that lag becomes leverage. There’s another example from 2025 through 2026: from the first quarter of 2025 to the first quarter of 2026, miners’ costs rose 16%, but their average margin jumped 134%, to a record $3,076 an ounce.
For years investors refused to pay for those profits because they didn’t trust gold to stay high. But this ratio at a ten-year high seems to say that’s changing. The market is finally pricing the profits in.
Here’s the full history of the GDX-to-gold ratio.
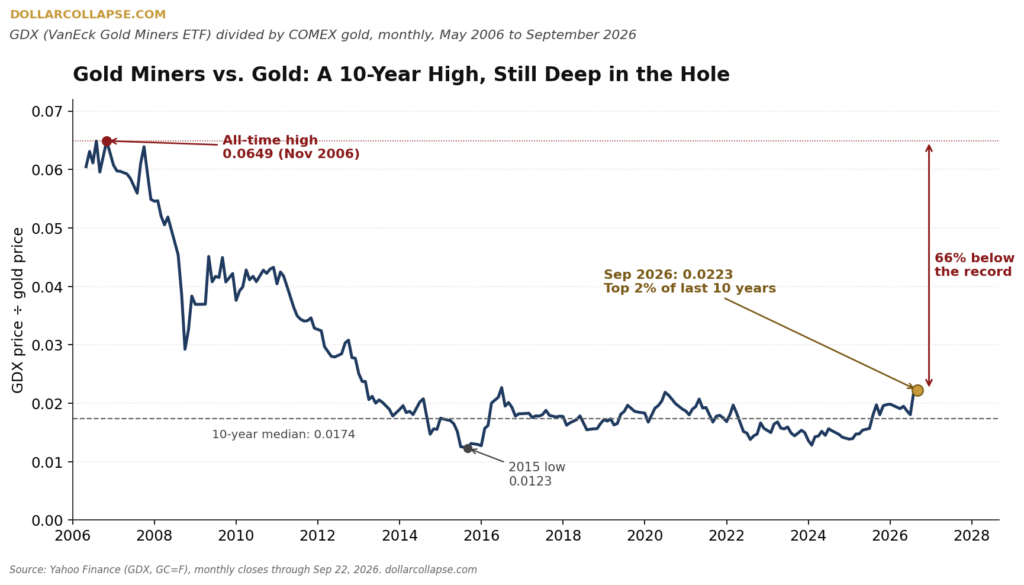
The ratio has climbed about 80% from its 2015 low, and it still hasn’t won back half of what it lost.
So why did miners get so cheap in the first place?
The last cycle burned people. GDX peaked at $62.80 in August 2011 and bottomed at $13.72 in December 2015. For many, that could’ve landed at a 78% loss, while gold itself fell 42%. Miners borrowed too much and overpaid for new mines at the top, then shareholders paid for it.
Fund managers still remember. Over the next decade, gold stocks traded at a discount even when gold rose. In February 2024, with gold climbing, the ratio sank to 0.0128, right back to its 2015 lows.
Gold now trades near $4,400 an ounce. A miner’s costs don’t jump every time gold does. Fuel, wages and equipment catch up slowly, so each new dollar on the gold price drops straight into profit.
The market is now paying for those profits. That’s what a rising ratio means. The higher the GDX to Gold ratio rises, the more the market is paying for the profit gold miners are receiving.
Here’s the last year, with all three indexed to 100 so you can see who leads:
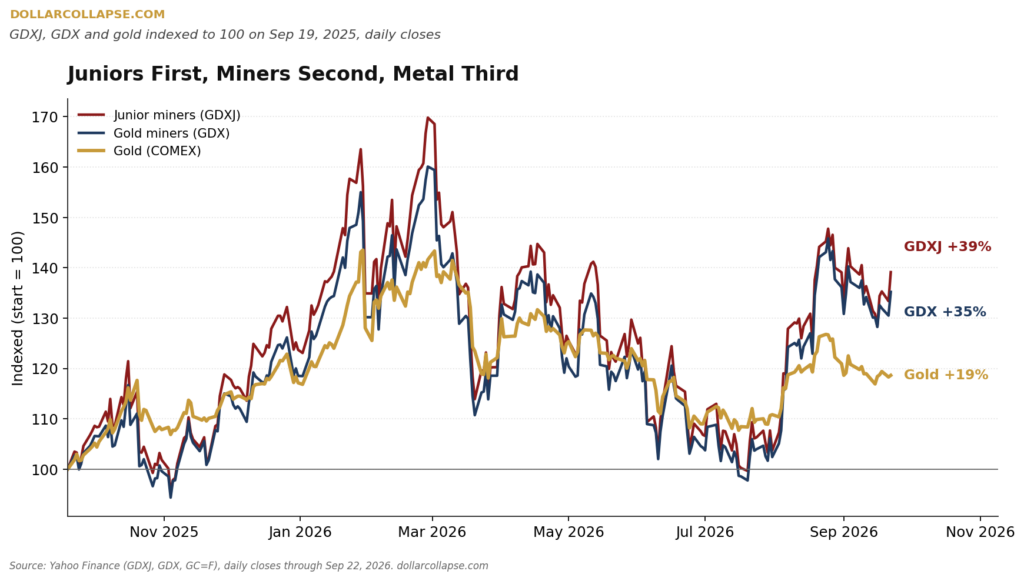
Juniors first, big miners second, the metal third. Over twelve months GDXJ is up 39%, GDX is up 35%, and gold is up 19%.
Smaller miners carry more risk and more upside per ounce, so when they lead, money inside the sector has shifted from cautious to aggressive.
This doesn’t mean the ratio goes straight up from here. Ratios like this can stall for a year. A ten-year high is a start, not a summit.
But the 2011 high was 0.0425, almost double today’s level. The 2006 record was 0.0649, nearly triple.
The hole took a decade to dig…
while the climb out started this year.
And most of the discount is still in the price for gold and silver miners.

Comments
Log in or sign up to join the conversation.