


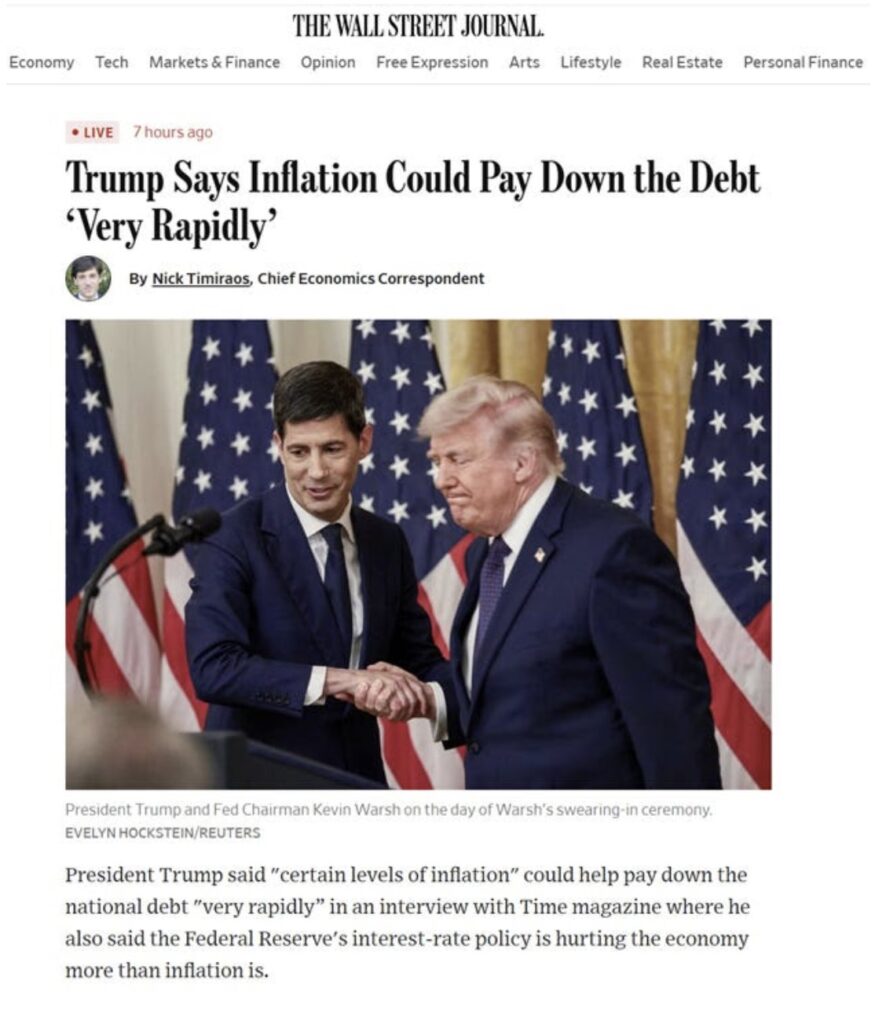
President Trump suggested a plan for the $40 trillion federal debt.
Here’s what he told TIME last week:
So let’s run the numbers.
Federal debt grew 9.0% in the year to Q2 2026. Nominal GDP, the economy measured in today’s dollars, grew 6.3%.
Here’s the race the debt keeps winning…
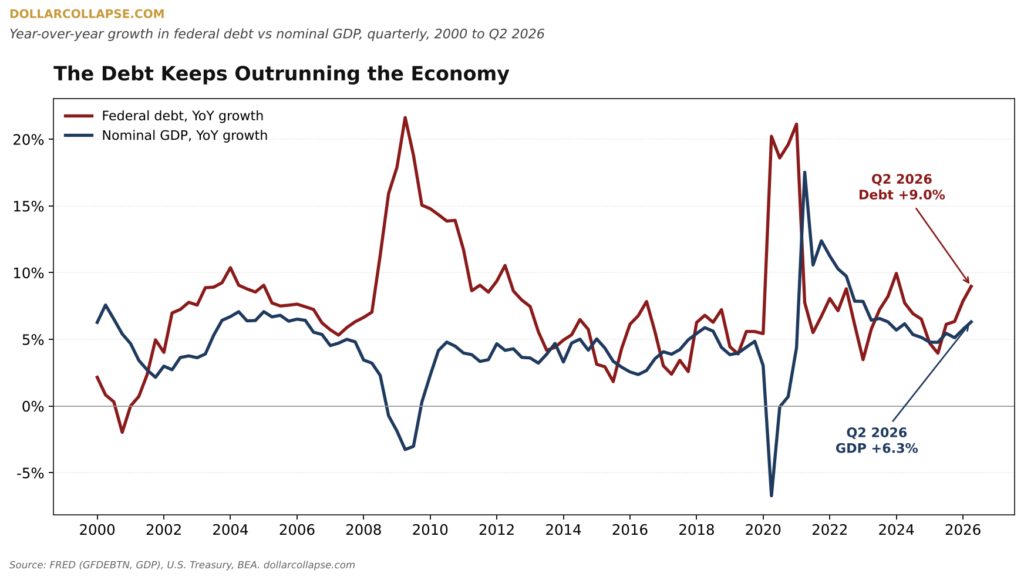
Debt growth has beaten GDP growth in 79 of the last 106 quarters.
So, if you were to look at the chart above, you see nominal GDP, which real growth including inflation. Real growth is running 2.2%. For the economy to keep pace with 9% debt growth, inflation has to supply the other 6.8 points.
Where President Trump whiskfully explained away “certain levels” of inflation. “Certain levels” would mean inflation that any boomer would remember from the 1970s.
However, there is one other time when inflation ran 1970s hot… 2022, after the Fed bazooka was taking effect on the market. Here’s how often America has run inflation that hot since 1960…
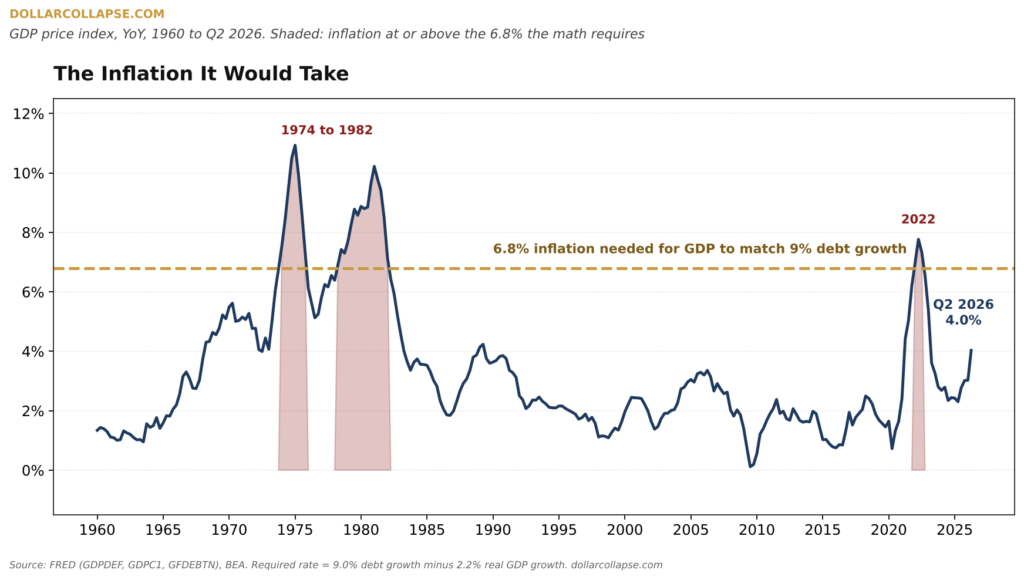
But the total number of time is three: 1974 to 1975, 1978 to 1982, and 2022.
And 2022 is the cautionary tale. Inflation did shrink debt to GDP, from 120% to 116%, for about a year. Then lenders demanded their cut. By late 2023 the ratio was back near 120%. Today the 10-year Treasury yields 5.24%, the highest since 2007, and net interest costs $1.28 trillion a year.
Inflation doesn’t pay the debt. Eventually, savers do, through a dollar that buys less every year.
That’s the deal on offer: Washington keeps borrowing, and your money does the shrinking.
Keep stacking.



Comments
Log in or sign up to join the conversation.