


Gold price (XAU/USD) edges higher to around $4,530 during the early Asian session on Friday. The precious metal rebounds after earlier falling following the US President Donald Trump administration’s unexpected decision to boost repurchases of longer-dated bonds.
US Treasury Secretary Scott Bessent said on Thursday that the Treasury could increase bond buybacks beyond $4 billion, partly to signal that current yields do not reflect underlying economic fundamentals. He stressed that interest rates have nothing to do with the buyback decision.
On Wednesday, the US Treasury Department said it will buy back more of its longer-term bonds, in an effort to curb a sharp increase in borrowing costs, per Bloomberg.
However, the potential upside for the yellow metal might be limited amid energy-driven inflation pressures, which raises the prospect of Federal Reserve (Fed) rate hikes in the coming months. Markets are now pricing a 36.2% chance of a Fed rate hike at the upcoming policy meeting, down from 47% a month earlier, according to the CME FedWatch Tool. It’s worth noting that Gold is often used as a hedge against inflation but does not yield interest, making it less attractive when interest rates are high.
Gold underpinned as US policy backdrop supports longer end
According to TD Securities, recent policy signals from Washington are helping to shore up bullion in the near term. The bank highlights that “the signal of the Treasury looking to support the longer end, alongside a Fed willing to look past higher energy prices, should be enough to support the yellow metal in the near-term,” suggesting that the current US rates and policy backdrop remains broadly constructive for Gold despite the latest move higher in yields.
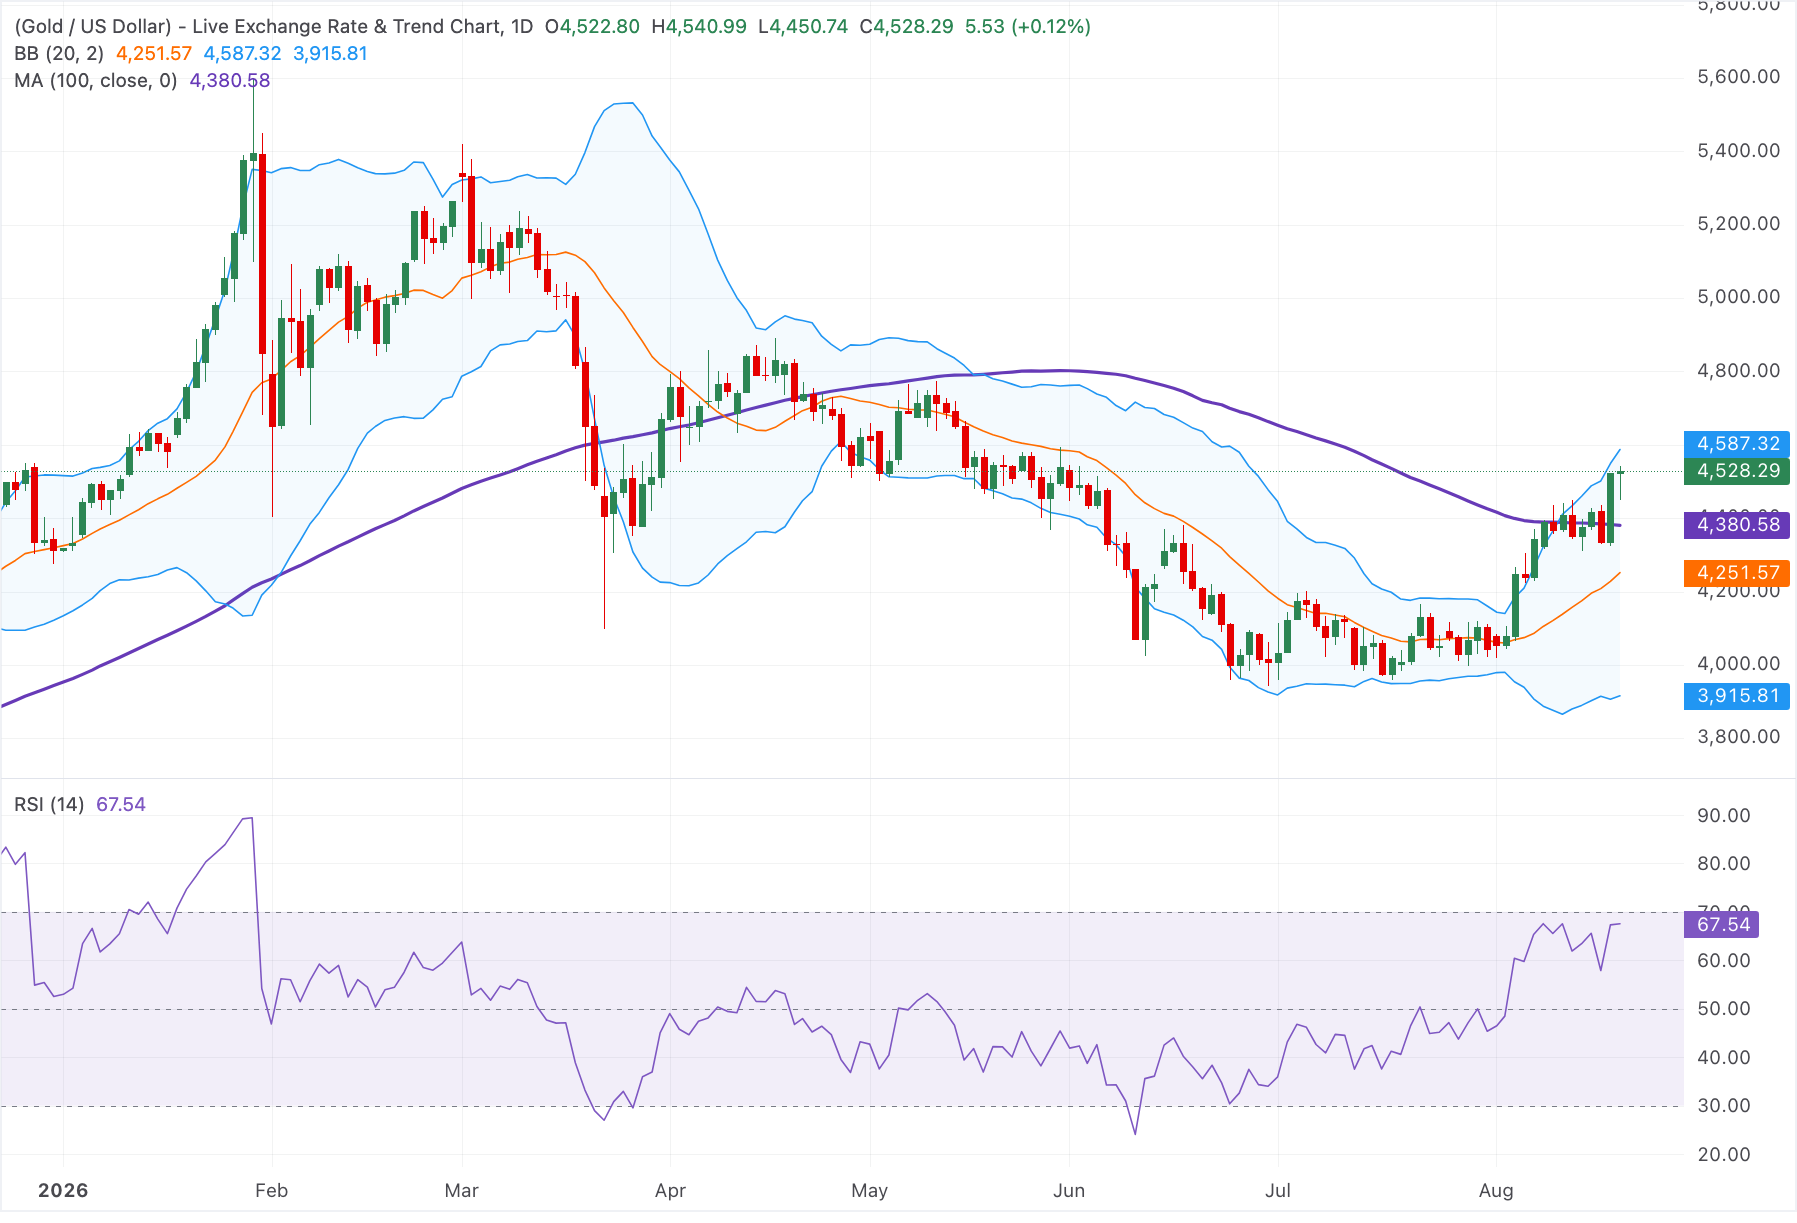
Technical Analysis: Gold maintains a constructive outlook above the 100-day SMA
In the daily chart, XAU/USD keeps a bullish near-term bias as spot holds above the 100-day simple moving average (SMA) and the Bollinger middle band. Price is stretching toward the upper Bollinger band, while the Relative Strength Index (14) at 67.54 suggests strong upside momentum edging toward overbought conditions, hinting that the current advance could be vulnerable to consolidation once the topside band is tested.
On the downside, immediate support is seen near the recent pivot around $4,528, followed by the 100-day SMA at $4,380 and the Bollinger middle band close to $4,252, where buyers may attempt to defend the prevailing uptrend; deeper pullbacks would expose the lower Bollinger band near $3,915 as a more distant structural floor. On the topside, initial resistance is located at the upper Bollinger band around $4,585, and a sustained break above this ceiling would open the path for a continuation of the gold rally toward fresh record territory.


Comments
Log in or sign up to join the conversation.