


Gold price (XAU/USD) edges lower to around $4,050 during the early Asian session on Thursday. Markets assess comments from Federal Reserve (Fed) Chair Kevin Warsh after the US central bank left benchmark interest rates unchanged at its October policy meeting.
The Fed decided to hold its benchmark federal funds rate steady in a range of 3.75% to 4.00%. According to the statement, policymakers said they hoped incoming data would help inform their next decision.
Fed Chairman Kevin Warsh said during a press conference that officials have “made clear our readiness to act as circumstances require, and we have shown our willingness to act.”
“It’s our responsibility to get inflation down,” Warsh said. “That’s the reason the FOMC’s discussion over the last couple of days focused mainly on the price stability side of our remit,” he added.
While traders maintained bets the Fed will raise rates in December, they trimmed wagers on additional hikes in 2027, according to Bloomberg. Futures markets are no longer fully pricing three more hikes this cycle. Higher rates increase the opportunity cost of holding non-yielding gold.
The US Personal Consumption Expenditures (PCE) inflation data for September will take center stage later on Thursday. This report could offer insight into the monetary policy path.
Gold recovery faces Fed test as markets eye FOMC and core PCE
Strategists at OCBC describe the latest move in gold as a “somewhat encouraging” recovery, noting that it has unfolded “particularly given the firmer USD and US Treasury yield upticks.” They add that “a rebound in technology equities may also have helped ease broader liquidation pressures,” even as “US Treasury yields remain elevated and markets continue to price a high probability of another Fed hike in December.”
According to OCBC, “focus now shifts to the FOMC, where a hold is widely anticipated, but guidance on path trajectory will matter more.” In that context, they flag that “Thursday’s core PCE could either reinforce or temper the Fed’s message,” and argue that “further easing in oil prices, accompanied by softer yields and USD, could help extend gold’s recovery.” However, they caution that “a hawkish Fed or another bout of equity deleveraging could quickly undermine the rebound,” concluding that “for now, we still see some 2-way risks.”
Fed doubles down on 2% goal as ‘monetary medicine’ seen working, keeping Dollar bid
Warsh’s press conference tone is firmly consistent with the established baseline, with the 7/10 FXS Speechtracker score matching the historical average but leaning more confidently hawkish in rhetoric. The emphasis that “ensuring price stability is not about a fixed date on a calendar” and the insistence on a hard 2% PCE target, alongside claims that “new monetary medicine” is working and inflation expectations are “going the right way,” signal a data-dependent but resolutely anti-inflation stance that argues against any imminent pivot to easing. References to tighter financial conditions, widening credit spreads and broadening capex reinforce a narrative that policy is biting but not yet restrictive enough to declare mission accomplished, a mix that tends to underpin the Dollar on dips.
The FXS Fed Sentiment Index jumped by 14.39 points to 141.89, pushing deeper into hawkish territory well above the 100 neutral line and confirming that markets read the press conference as more resolute on inflation than before. With the index firmly elevated and the FXS Speechtracker score steady at 7/10, the overall signal is that the Fed’s reaction function remains skewed toward keeping policy tight for longer, a backdrop that should continue to favor the Dollar against lower-yielding peers.
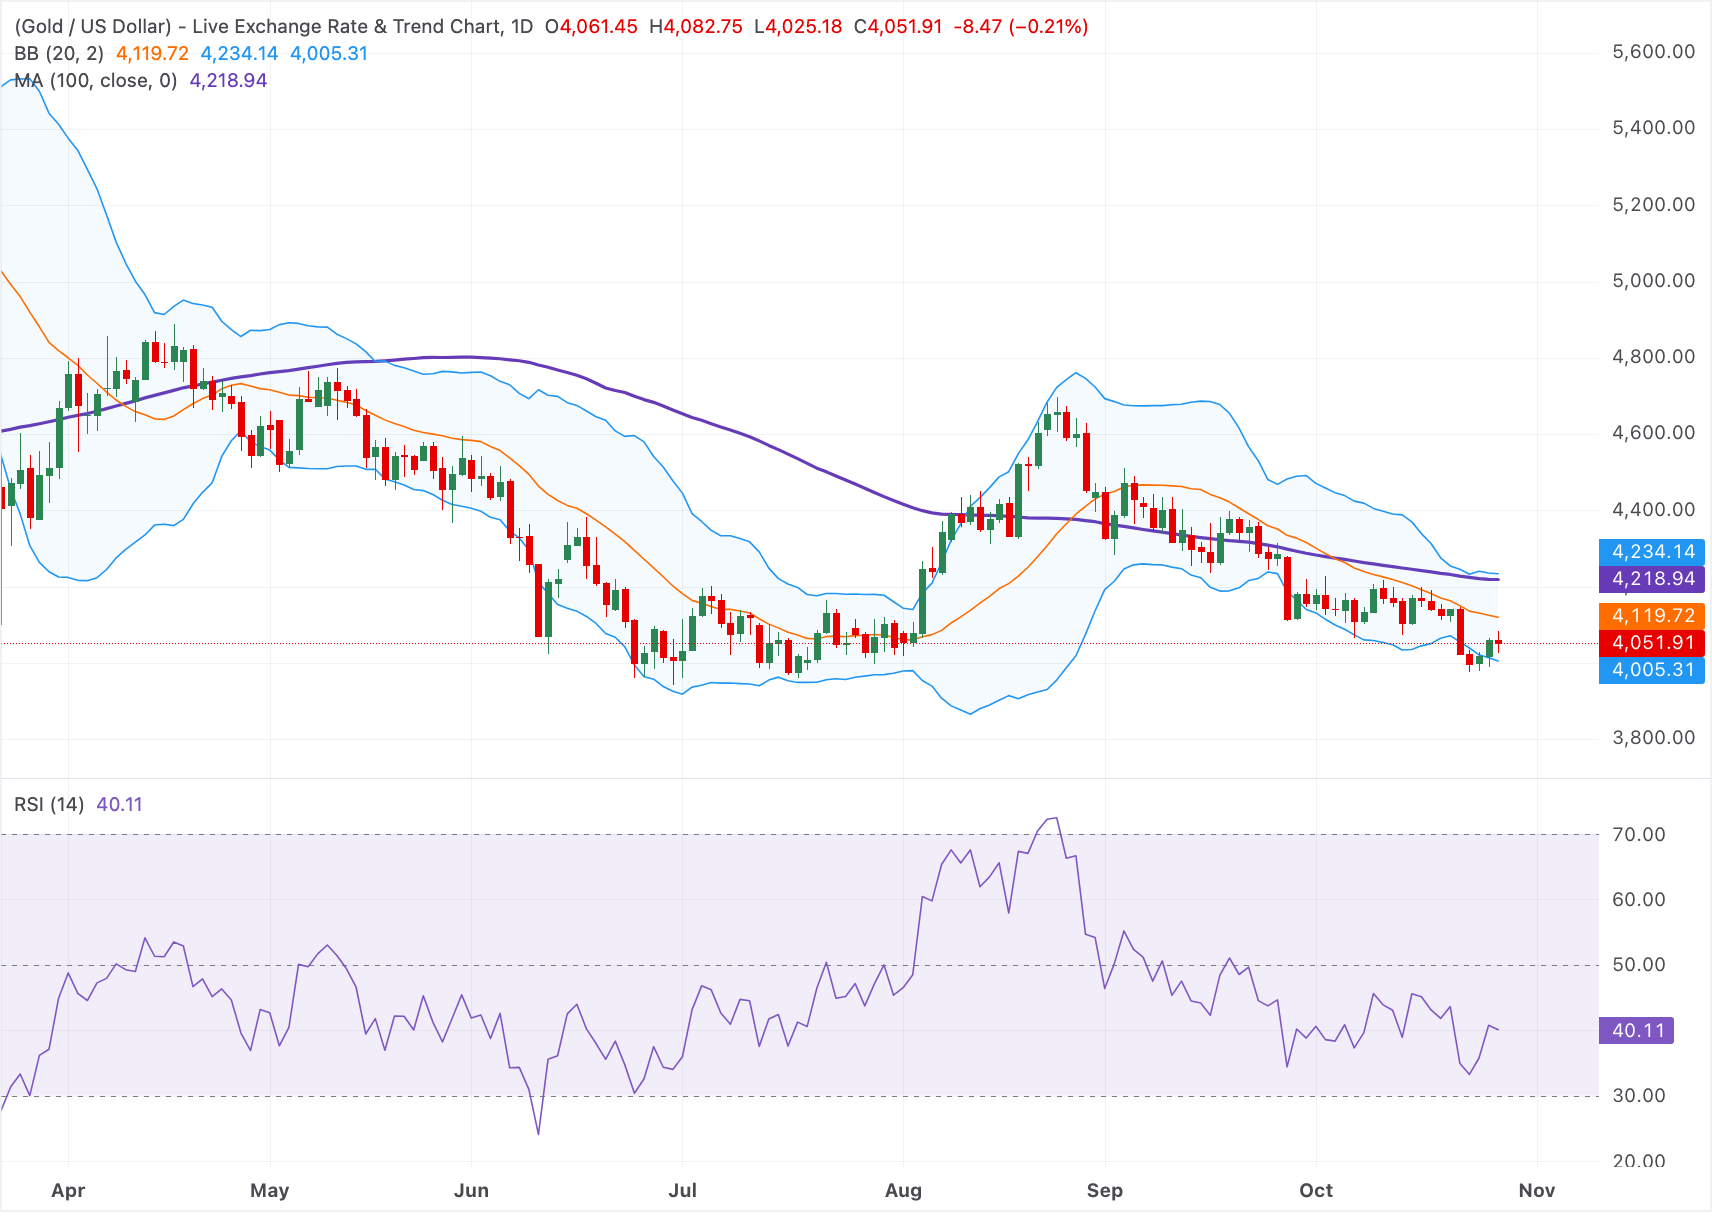
Technical Analysis: Gold remains capped below the 100-day SMA
In the daily chart, XAU/USD extends a corrective phase below its key moving averages and keeping the near-term bias bearish. Spot gold is holding under the 20-day Bollinger simple moving average and the 100-day simple moving average, suggesting rallies remain capped within a broader consolidation after the recent pullback. The Relative Strength Index (14) hovers near 40, pointing to lingering downside pressure but not yet oversold conditions, which hints that sellers still retain control while room for additional losses remains.
On the topside, immediate resistance is located at the 20-day Bollinger middle band near $4,120, with a break above this barrier exposing the 100-day SMA at $4,218 and the upper Bollinger band around $4,235 as the next levels where supply could re-emerge. On the downside, initial support is aligned with the lower Bollinger band at $4,005; a clear drop through this floor would likely reinforce the bearish bias and open the way for a deeper decline toward lower psychological and historical levels not visible on the current configuration.



Comments
Log in or sign up to join the conversation.