

Gold price (XAU/USD) declines to near $4,275 during the early Asian session on Friday. The precious metal extends the decline on growing bets on further Federal Reserve (Fed) interest rate hikes this year. New York Fed President John Williams and Cleveland Fed President Beth Hammack are set to speak later in the day.
Oil prices rebound after talks between the United States (US) and Iran showed little sign of progress, raising oil-driven inflation concerns. Additionally, yields on the US’s longest-dated bonds climbed to the highest level in more than two decades. A rise in oil prices has reinforced expectations that the US central bank will need to continue raising interest rates in order to quell above-target inflation.
Markets are now pricing in roughly a 67.5% chance that the Fed would hike rates by a quarter percentage point in October, up from 55.4% one week ago, according to the CME FedWatch tool. Higher interest rates typically weigh on gold because the precious metal does not pay interest, making yield-bearing assets relatively more attractive.
Fed policymakers struck a hawkish tone this week. Cleveland Fed President Beth Hammack said on Thursday that inflation pressures remain elevated, and the longer this situation persists, the harder it will be to bring price pressures back to target. Meanwhile, Philadelphia Fed President Anna Paulson stated that inflation needs attention, which might require further interest rate hikes.
China demand emerges as key pillar of gold market in 2026
Analysts at Commerzbank underscore the strength of China’s physical demand, noting that, “according to data from the customs authority, China imported more than 1,000 tons of gold in the first eight months of the year, already exceeding last year’s total.” They add that official sector buying has reinforced this trend, with the Chinese central bank having “purchased a good 80 tons of gold between January and August, with purchases increasing noticeably in recent months and reaching their highest level in nearly three years in August.” Commerzbank concludes that, on this basis, “China is therefore a key driver of gold demand this year.”
Fed’s paulson flags risk of further hikes as inflation stays stubborn
Fed’s Paulson delivers a notably hawkish message, with an FXS Speechtracker score of 8.1/10 compared to the established baseline of 7/10, underscoring heightened concern about persistent price pressures. The emphasis that the US central bank “may need to raise interest rates again” and that the September hike only moved policy into a “better inflation-fighting posture,” alongside comments that underlying inflation “remains stubbornly high” and is being driven in part by the AI buildout, signals a clear willingness to tighten further to restore inflation to 2%. At the same time, references to a resilient economy, stable labor market, and the fact that inflation has “not gotten worse” frame the policy stance as firmly focused on containing upside risks rather than responding to imminent deterioration.
The FXS Fed Sentiment Index was unchanged, moving 0.00 points to a still-elevated level of 148.18, reinforcing that the broader Fed communication backdrop remains deeply in hawkish territory. The combination of a high index level and an above-baseline FXS Speechtracker score suggests that, even without an incremental hawkish shift in the aggregate index, the Dollar narrative remains anchored in expectations of a prolonged restrictive stance and potential additional tightening.
Technical Analysis: Gold remains capped below the 100-day SMA
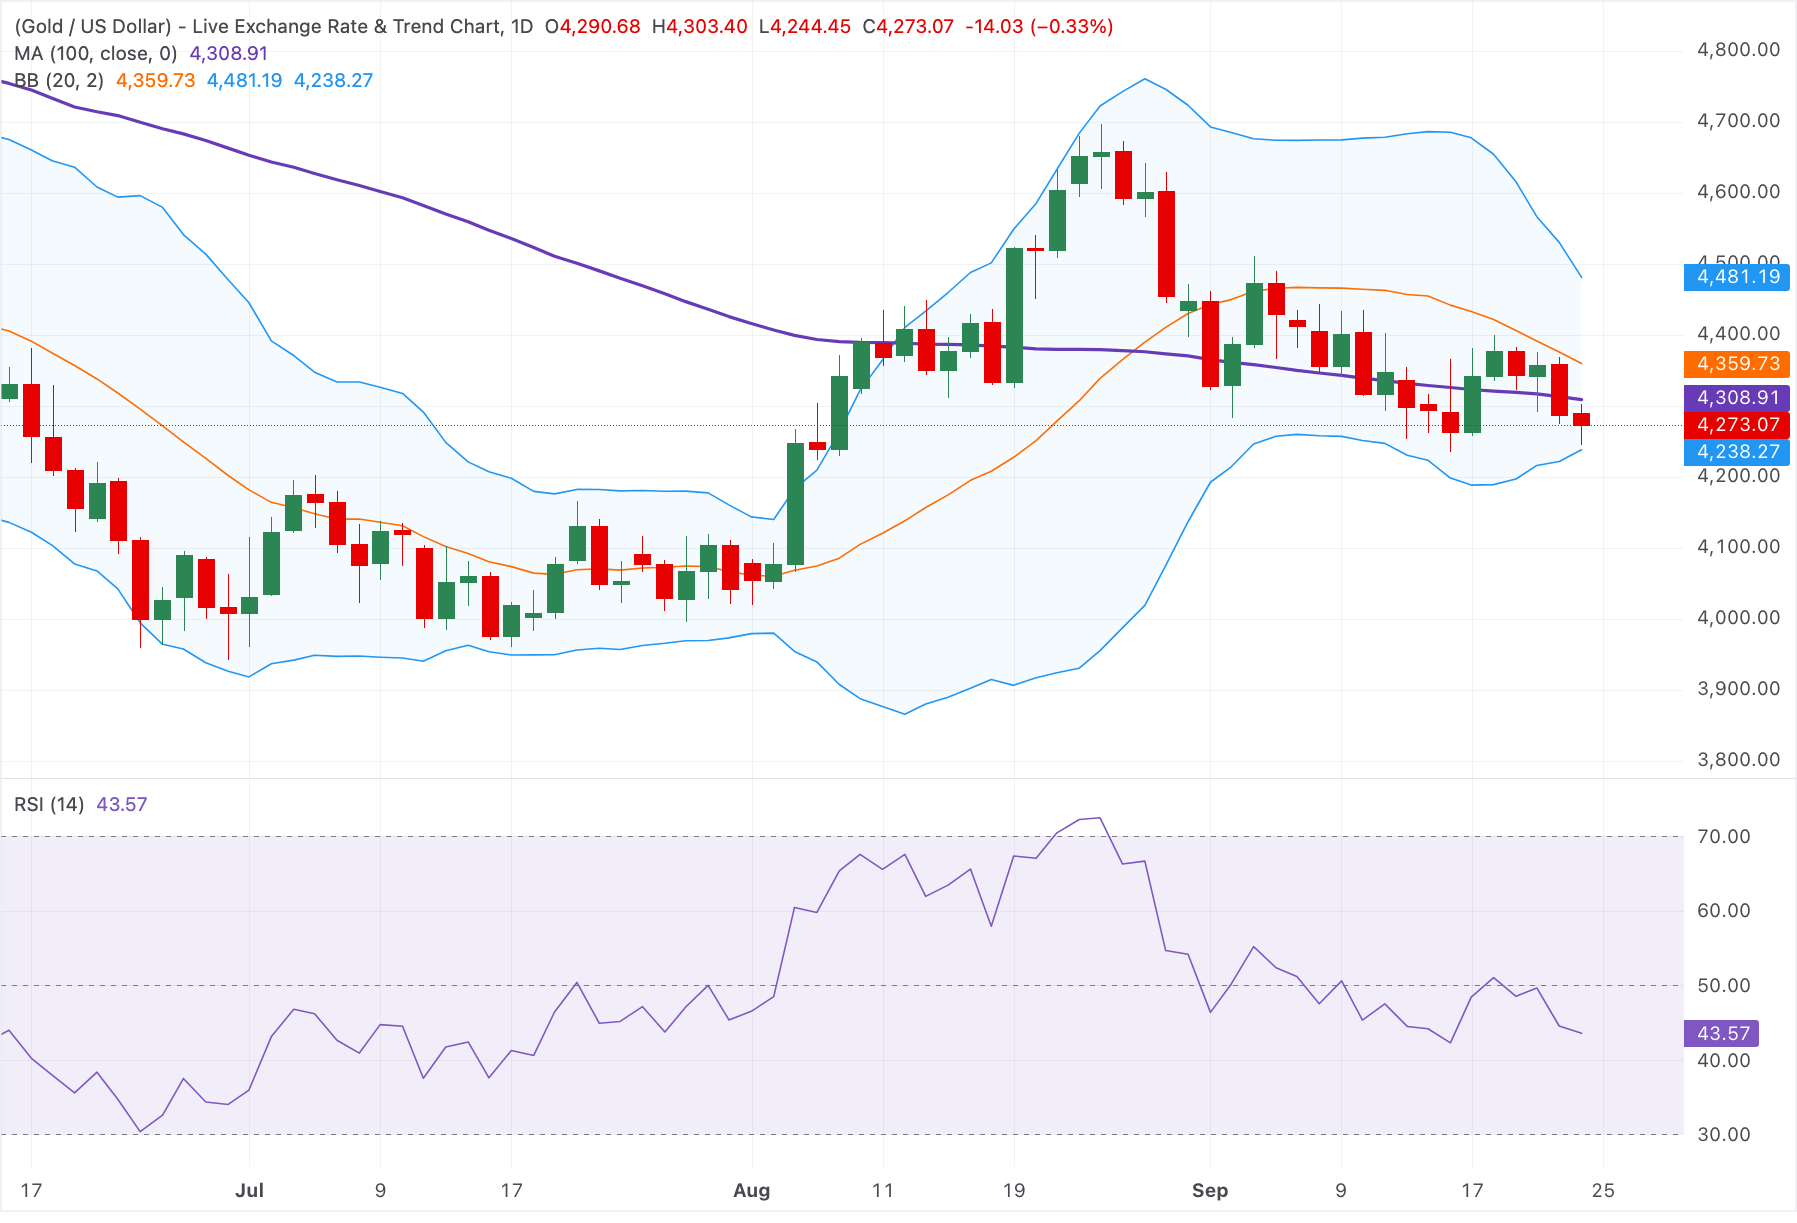
In the daily chart, XAU/USD retains a bearish near-term bias as it remains below the 100-day moving average (MA) and the Bollinger middle band. Price is holding above the lower Bollinger band, suggesting a corrective bounce cannot be ruled out, but the Relative Strength Index (14) around 44 keeps momentum tilted to the downside rather than signaling oversold conditions.
On the topside, initial resistance emerges at the 100-day MA around $4,310, followed by the Bollinger midline at $4,360, while the upper Bollinger band near $4,480 marks a stronger cap if gains extend. On the downside, the lower Bollinger band at $4,240 offers immediate support, and a daily close beneath this level would likely open the way for further retracement toward lower psychological and prior swing areas.

Comments
Log in or sign up to join the conversation.