


Gold price (XAU/USD) drifts lower to near $4,155 during the early Asian session on Wednesday. The precious metal extends the decline as rising oil prices fuel inflation concerns and prompt major central banks to tighten monetary policy. Traders await the US Consumer Price Index (CPI) inflation data later on Wednesday to gauge the outlook on monetary policy.
The International Monetary Fund (IMF) on Tuesday highlighted risks from elevated public debt levels and rising bond yields that may be driven higher still by war-driven inflation pressures.
Additionally, rising tensions in the Middle East raise fears of oil-driven inflation. Yemen’s Houthis launched a missile barrage at cities throughout Saudi Arabia as the military says projectiles are being intercepted, with shrapnel falling on the city of Dhahran and injuring at least four in the capital, Riyadh.
However, remarks from Federal Reserve (Fed) Bank of New York President John Williams might help limit the yellow metal’s losses. Williams said on Tuesday that he still sees one more interest-rate hike as appropriate this year, but doesn’t expect further tightening in 2027.
US Treasury yields dropped after Williams’ remarks, with two-year notes erasing an increase of as much as three basis points (bps). Lower yields are typically supportive for gold, which doesn’t bear interest.
Markets are pricing in roughly a 77.3% chance that the Fed will leave interest rates unchanged this month, while assigning nearly an 87.8% odds of a rate hike in December.
CTA short covering fails to remove downside risk for gold and platinum
According to TD Securities, Commodity Trading Advisors have begun to pare back bearish exposure, with “CTAs covering some shorts in gold and platinum,” but the bank cautions that “pricing remains prone to further selling still.” This combination of short covering alongside lingering vulnerability underscores that recent positioning shifts have yet to fully neutralize downside risks in the precious metals complex.
Williams leans dovish on 2027 rates but Fed tone stays firmly hawkish
Fed’s Williams delivered a notably softer message, with the FXS Speechtracker score at 3.4/10, well below the 5.8/10 historical average, signaling a more dovish tone relative to the established baseline. The explicit comment that Williams currently sees no need for a rate hike in 2027, alongside confidence that inflation will slow “quite a bit” toward the 2% target next year, reinforces expectations for a prolonged pause and eventual easing in Dollar policy. This combination suggests reduced upside risks for the Dollar and a more supportive backdrop for risk assets, especially if incoming data confirm the disinflation narrative.
The FXS Fed Sentiment Index fell by 3.09 points to 133.86, indicating a meaningful pullback in perceived hawkishness despite remaining well above the neutral 100 mark. This configuration shows the Fed still in hawkish territory compared to the established baseline, but Williams’ softer stance and the weak FXS Speechtracker score point to a gradual shift toward a less aggressive policy outlook that FX markets may interpret as incrementally Dollar-negative over the medium term.
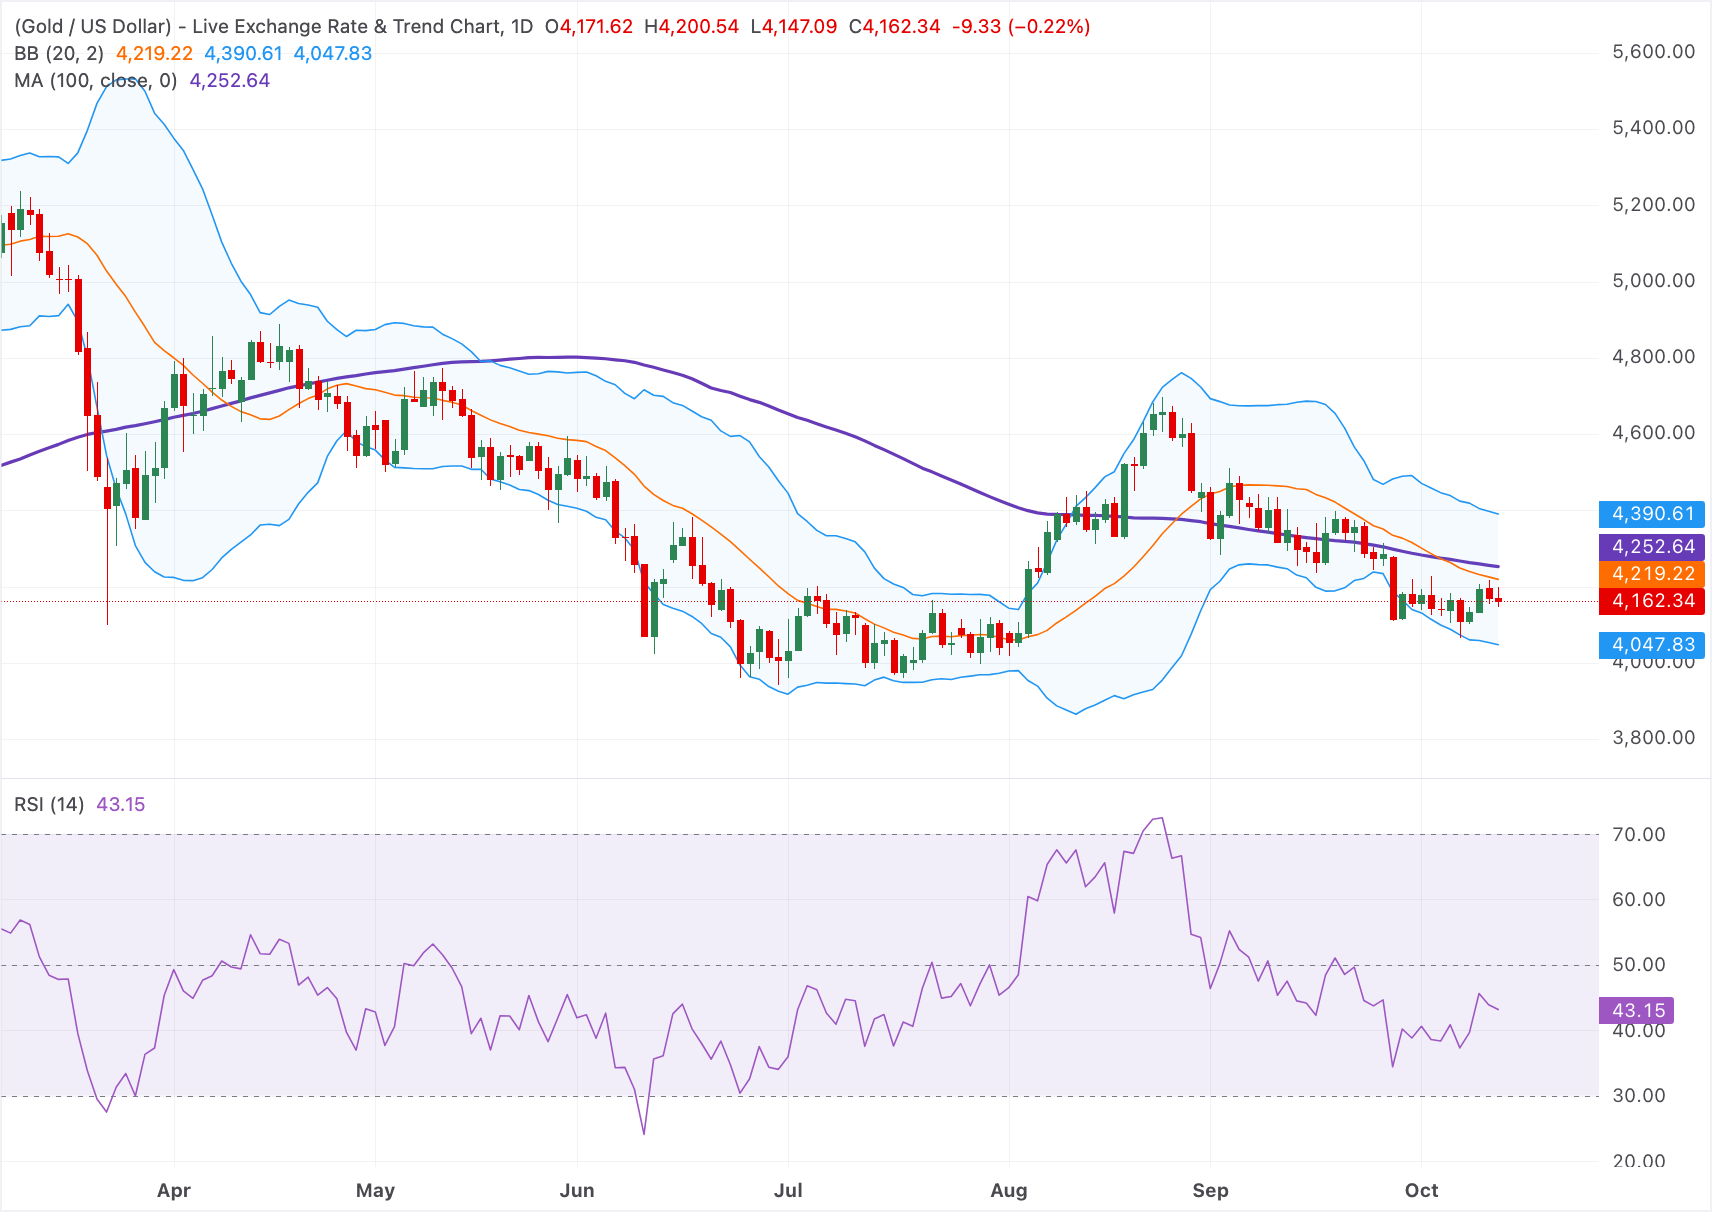
Technical Analysis: Gold remains capped under the 100-day SMA
In the daily chart, XAU/USD maintains a bearish near-term bias as price holds beneath the 100-day simple moving average (SMA) and the Bollinger middle band. The clustering of these overhead averages suggests gold remains capped within a corrective phase, while the lower Bollinger band underpins the current consolidation. The Relative Strength Index (14) at 43.15 stays below the neutral 50 line, hinting at subdued buying interest rather than an outright oversold condition.
On the topside, initial resistance is located at the Bollinger 20-period SMA near $4,220, followed by the 100-day SMA at $4,250, with a stronger barrier at the upper Bollinger band around $4,390, where selling pressure could re-emerge if a rebound extends. On the downside, immediate support is provided by the lower Bollinger band at $4,045; a decisive break below this floor would open the way toward deeper retracement, while holding above it keeps XAU/USD in a range-bound bearish correction beneath its key moving average cluster.



Comments
Log in or sign up to join the conversation.