


Gold price (XAU/USD) falls to around $4,170 during the early Asian session on Tuesday. The precious metal retreats from a one-week high on a stronger US Dollar (USD) and higher crude oil prices. Traders await the key US inflation data later this week for more clues on the Federal Reserve's (Fed) interest-rate trajectory.
Oil prices jump to a two-week high amid hopes of a Russia-Ukraine energy ceasefire and a new round of Houthi attacks in Saudi Arabia. These developments raise inflation concerns, prompting central bank tightening. Gold is often used as an inflation hedge but pays no interest, making it less attractive when interest rates are high.
“The macro backdrop remains challenging as persistent inflationary pressures continue to keep additional Fed tightening on the table, supporting Treasury yields and maintaining pressure on real rates,” said Manav Modi, a commodities analyst at Motilal Oswal Financial Services Ltd.
On the other hand, rising demand might help limit the yellow metal’s losses. Inflows into gold-backed ETFs have reached a four-year high, according to data compiled by Bloomberg. Additionally, the Chinese central bank added 740,000 ounces to its reserves in September, extending its buying streak to 23 consecutive months.
Gold gains as CTAs cover shorts and TD Securities eyes bull run into 2027
According to strategists at TD Securities, commodity trading advisors are now “covering shorts across gold and platinum as strong fundamental backdrop for precious metals insulates the market.” The bank notes that “the yellow metal is gaining on the day with CTAs back on the bid, covering shorts by some 7% of historic max position size,” underscoring a meaningful shift in positioning. TD Securities argues that “geopolitical risk, fiscal concern, dollar debasement, de-dollarization and stagflation concerns all remain major supportive factors for these flows in gold,” and concludes that “we continue to see the stage being set for the yellow metal to disconnect from real rates further and begin a new bull run into 2027.”
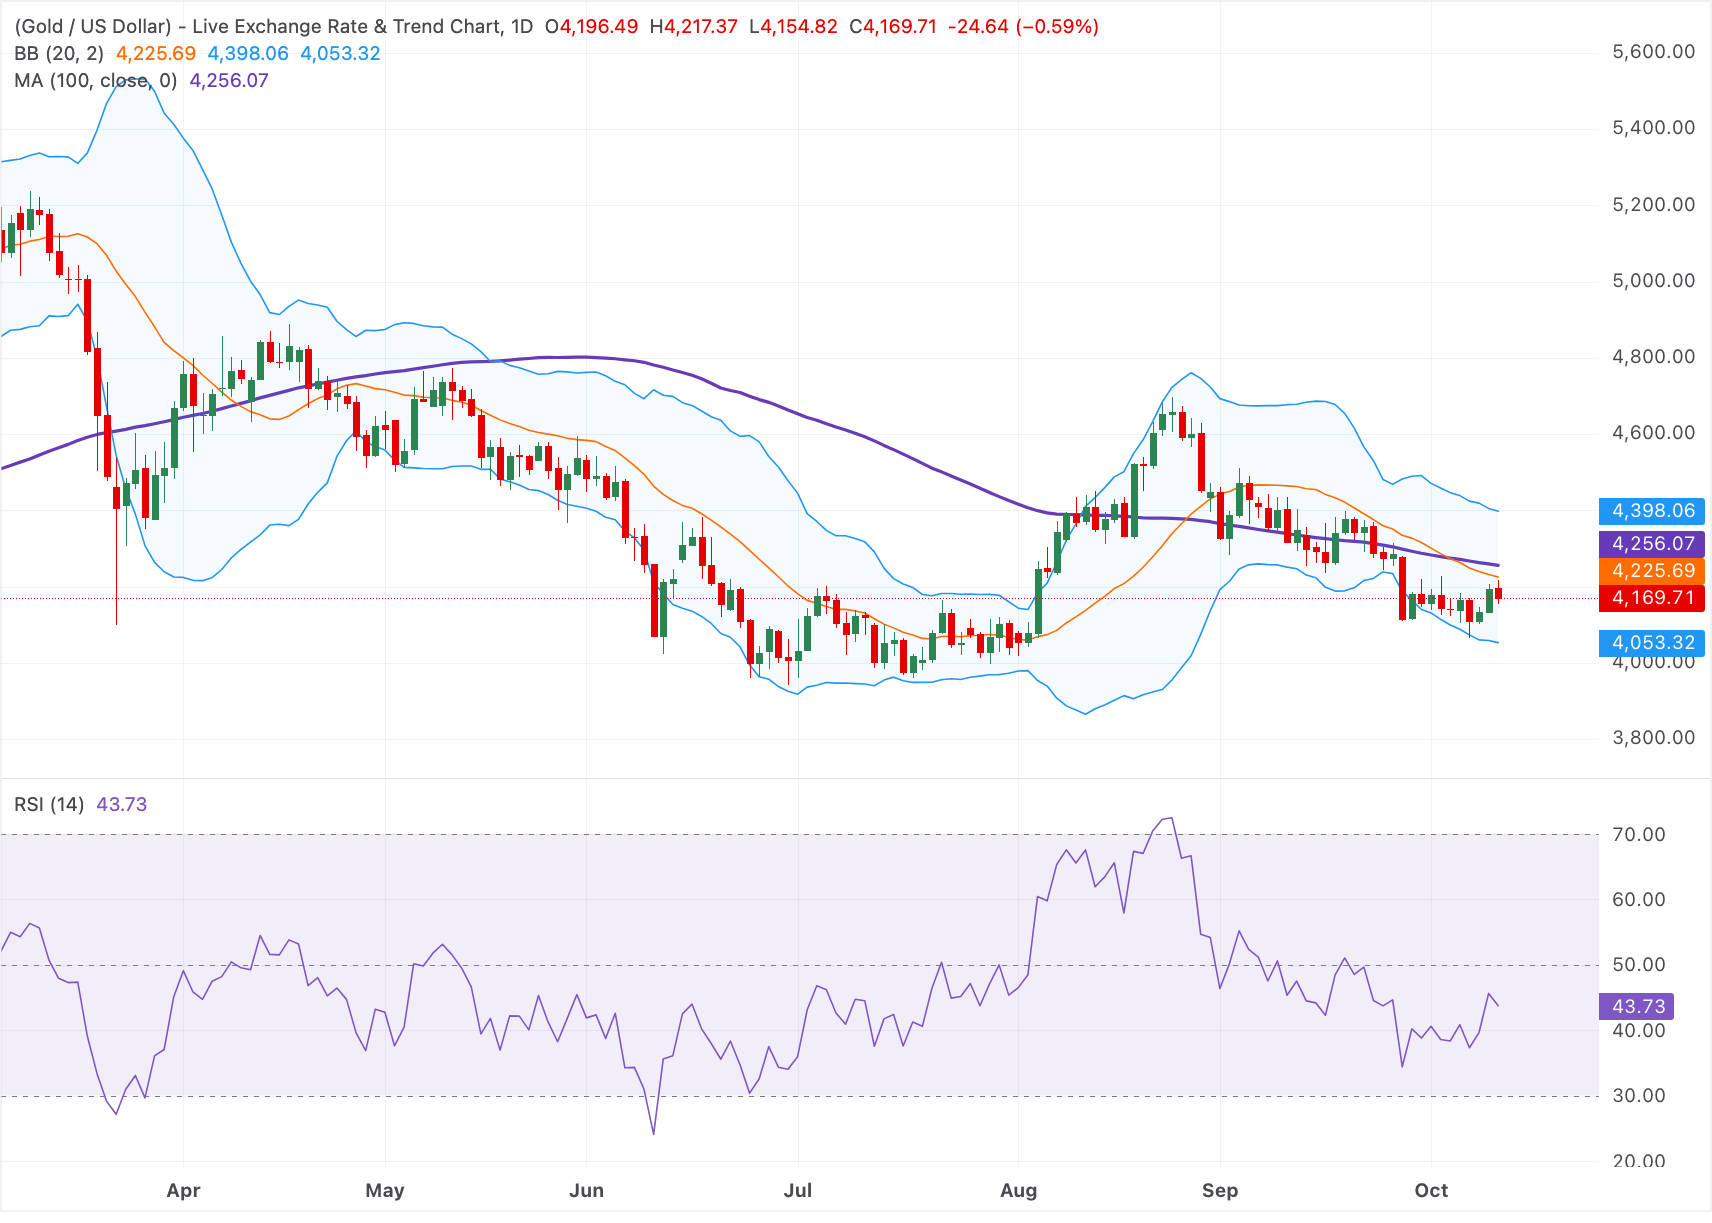
Technical Analysis: Gold retains a negative tone below the 100-day SMA
In the daily chart, XAU/USD keeps a bearish near-term tone as spot holds beneath the 20-day Bollinger middle band and the 100-day simple moving average (SMA). This alignment leaves gold locked below its primary trend gauges, while the Relative Strength Index (RSI) at 43.73 leans lower, suggesting downside pressure persists but without oversold conditions.
On the topside, initial resistance is located at the Bollinger middle band near $4,225, followed by the 100-day SMA at $4,255; a daily close above these barriers would be needed to ease the current downside bias, with the upper Bollinger band at $4,400 acting as a more distant cap. On the downside, the lower Bollinger band at $4,055 offers the next notable support, and a break below that zone would open the door to a deeper corrective phase.



Comments
Log in or sign up to join the conversation.