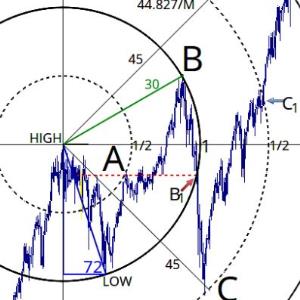

- Recent low of $1,238.30 in gold marks critical support, with expectations for higher prices.
- Both daily and weekly geometric chart analysis supports a bullish view.
- First major target is around $1,358.50.
This possibility has long-term bullish implications from monthly geometric analysis, where the market is at a critical decision point.
Gold (XAU/USD) made a potentially important low of $1,238.30 last Tuesday, December 12. By employing a cumulative average (black, offset +1 day) from the major low of $1,124.30 of December 2016, and then squaring the highs at A & B with this average (by forming 90o angles with blue vertical and horizontal lines), two of the recent swing lows are revealed to be almost identical (blue arrows).
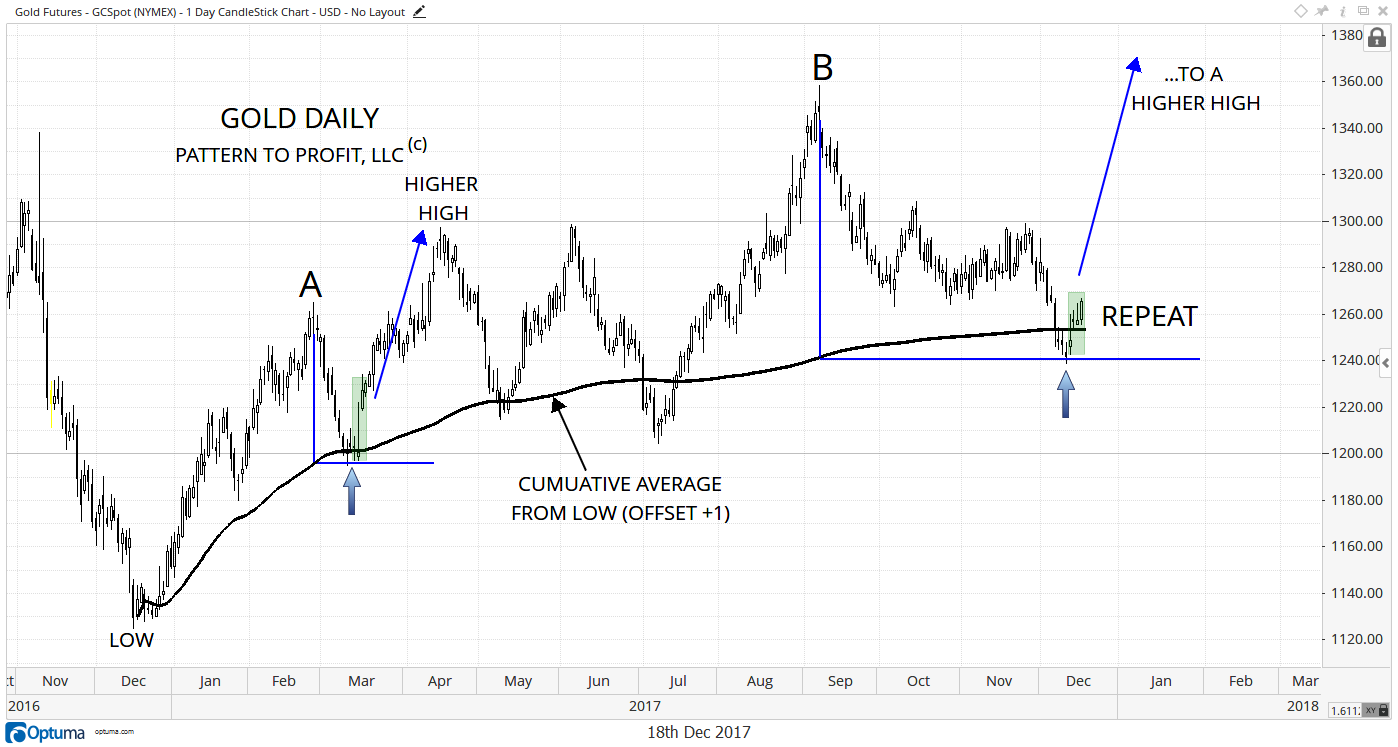
If this relationship holds, an eventual high above B ($1,358.50) can be expected.
The following daily geometric analysis also agrees. A vector concentric circle has been drawn on the chart. Both the resulting circle’s left time point and bottom price level yield preceding lows at A & B. Therefore, the current markets bounce from circular support, and also from a harmonically matching triangular point (lighter green triangle), make a sound statement for the likelihood of higher prices for gold:
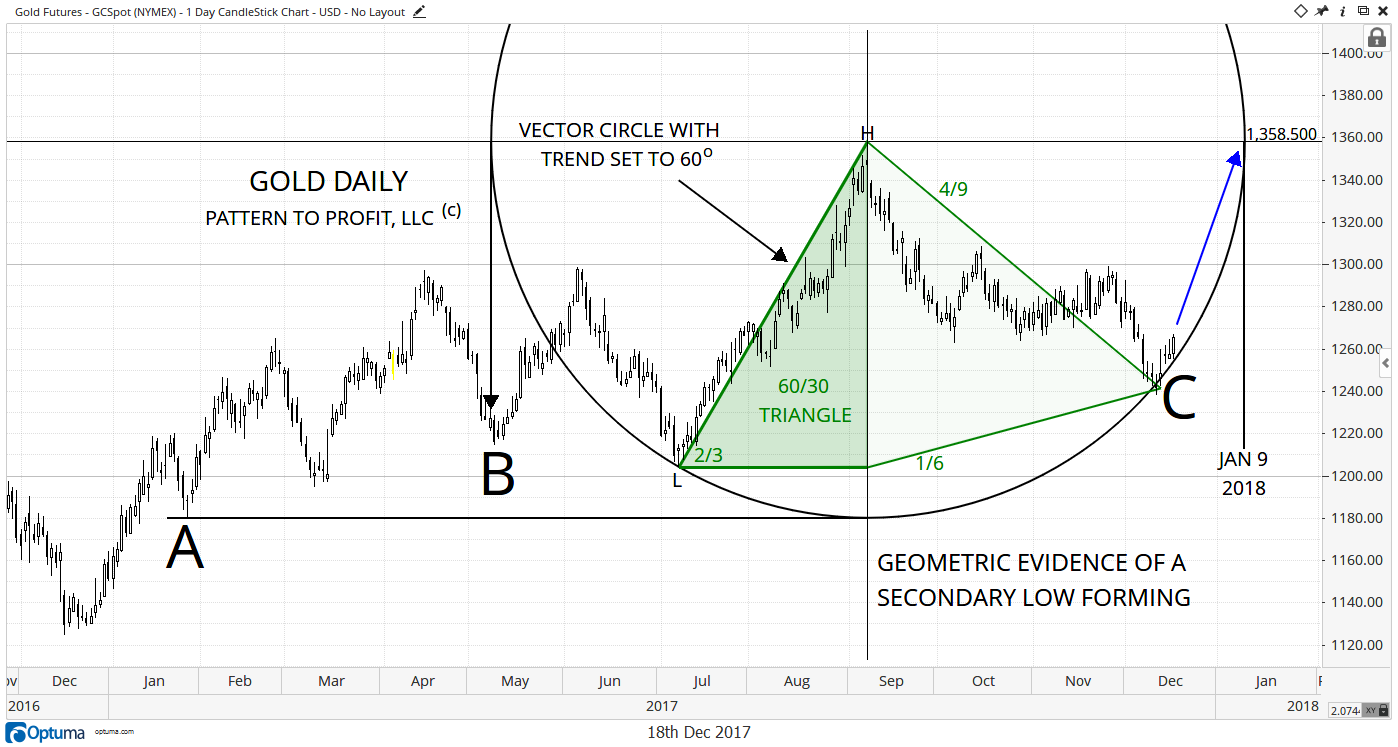
A preceding downtrend (marked L-H) is set at 60o (2/3 of 90o) forming a ‘60/30’ triangle (the angle of the high is 30o).
Therefore, we are bullish short-term on gold to at least the $1,360 area (making a higher high), with January 9, 2018 as a potential reversal day. At the same time there are some long-term bullish implications from this analysis.
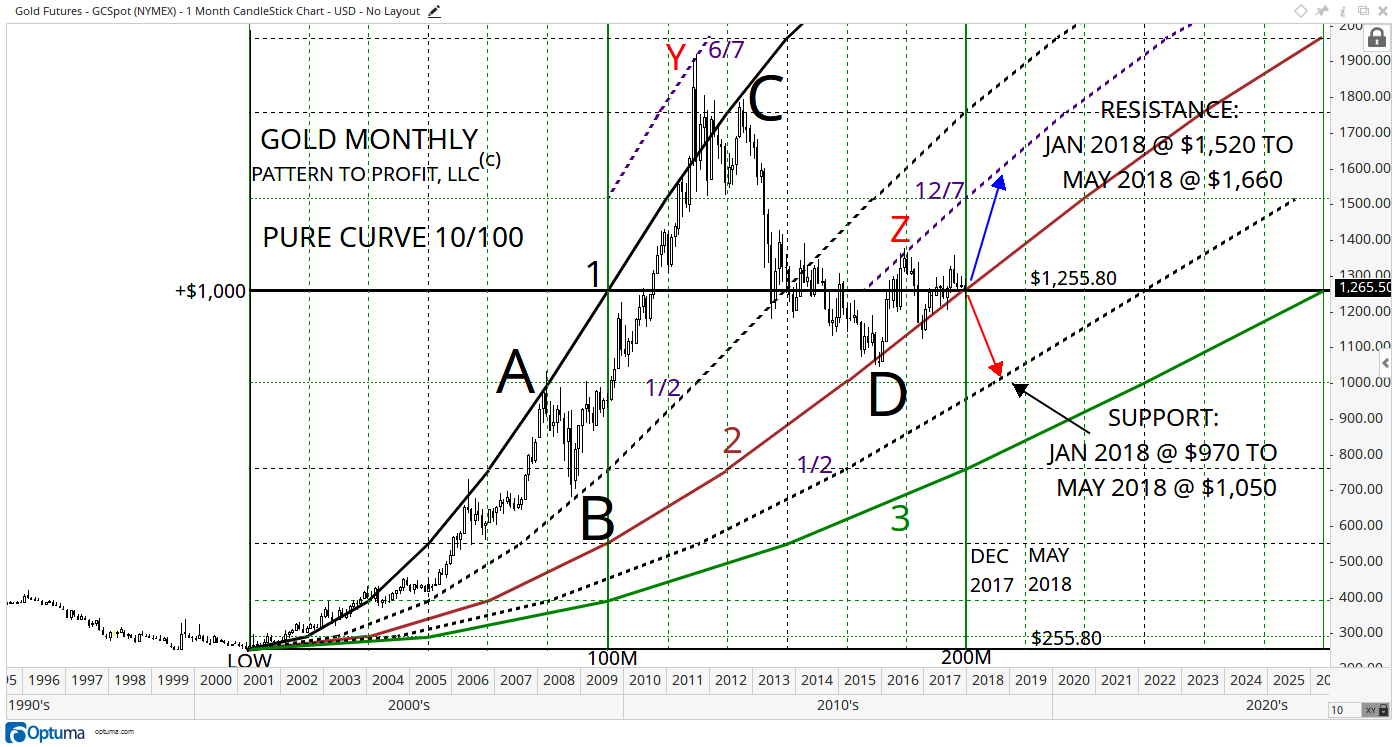
The following monthly chart utilizes one of my applications of sine waves: in this case, the analysis is based on a ‘pure curve’ of $1,000 over 100 months (labeled ‘1’, solid black), stemming from the major low of $255.80 in April 2001:
Several dynamics are present in this sine wave analysis that point to a potential launch for gold:
- The market is currently a meager $10 above a major decision point: the major intersection of $1,255.80 ($1,000 above the starting low of $255.80) and December 2016 (200 months from the starting low).
- The 2nd wave (solid brown) passes through this intersection as well, giving general support to the entire correction since the major low at D.
- The two corrections labeled A-B and C-D are perfectly related, as C-D (wave 1 to wave 2) is exactly twice the movement of A-B (wave 1 to wave 1.5).
Regardless, even when so much geometry lines up there is always the possibility of a breakdown through support. The highs at Y and Z (red) are harmonically matching, with the high at Z topping at a doubled wave (12/7) of the wave identifying the all-time high at Y (6/7). This lends power to the high at Z, $1,377.50 from July 2016, as a possible repeat of this formidable top.
Countering this bearish observation is the fact that the market has not yet sustained a break below wave 2, unlike the sustained break below wave 1 following the top at Y, which resulted in the massive decline from C to D.
If the market stays above wave 2, upward resistance from $1,520 to $1,660 from January to May 2018 (dashed vertical line) is offered by the 12/7 wave.
On the downside, if a sustained break below wave 2 is seen then support is offered by the 1/2 curve looming below, between $970 to $1,050, from January to May 2018.
Comments
Log in or sign up to join the conversation.