

Gold remains under pressure as rising US Treasury yields, a stronger US Dollar and Fed rate-hike bets weigh on the metal.
Traders avoid large directional bets ahead of Wednesday’s Fed decision and updated economic projections.
XAU/USD remains technically vulnerable while trading below the 100-day and 200-day SMAs.

Gold (XAU/USD) remains on the defensive on Tuesday as a stronger US Dollar (USD), rising US Treasury yields and US Federal Reserve (Fed) interest rate hike expectations create a challenging backdrop for the non-yielding metal. However, the decline lacks strong follow-through as traders avoid placing large bets ahead of the Fed’s monetary policy decision on Wednesday.
At the time of writing, XAU/USD trades near $4,280, hovering above the more-than-one-month low of $4,253 touched on Monday.
Long-dated US Treasury yields extend their rise on Tuesday, with the benchmark 10-year yield testing the 5% threshold and the 30-year yield climbing to around 5.40%, their highest levels since 2007. Higher yields support demand for the US Dollar while increasing the opportunity cost of holding Gold, which offers no interest.
The US Dollar Index (DXY), which tracks the Greenback's value against a basket of six major currencies, trades around 99.60 near two-week highs.
The bond sell-off is not limited to the United States, with borrowing costs across several major economies climbing to multi-year highs. Much of the move stems from the energy shock caused by the war in the Middle East, which is adding to inflation concerns and reinforcing expectations of tighter monetary policy.
Since the outbreak of the war, Gold has reacted more strongly to shifts in interest rate expectations than to geopolitical developments. The Fed has kept interest rates unchanged so far, but high Oil prices are making it harder to bring inflation back to the central bank's 2% target.
Headline Consumer Price Index (CPI) inflation stood at 3.4% YoY in August, while the Producer Price Index (PPI) accelerated to 5.4% from 4.8% in July. Recent Fed communication has also centred on the need to bring inflation back to target. As a result, markets widely expect the central bank to deliver its first interest rate hike since 2023 when it concludes its two-day monetary policy meeting on Wednesday.
Much of the hawkish Fed risk appears to be priced in. However, Gold could remain vulnerable if policymakers signal that September marks the beginning of a broader tightening cycle. Such a message could extend the rise in Treasury yields and provide additional support to the US Dollar. Attention will therefore centre on the updated economic projections and Fed Chairman Kevin Warsh’s comments on the path of interest rates.
At the same time, the rise in global bond yields is not driven by monetary policy expectations alone. Heavy government borrowing and concerns over fiscal sustainability across major economies are also contributing to the sell-off. These factors could eventually revive demand for Gold as an alternative store of value, especially if rising yields begin to signal weakening confidence in government debt. In the meantime, central bank buying, retail investment and demand through Gold-backed exchange-traded funds (ETFs) remain steady sources of underlying support.
Technical analysis: Gold faces further downside risks below key SMAs, building bearish momentum
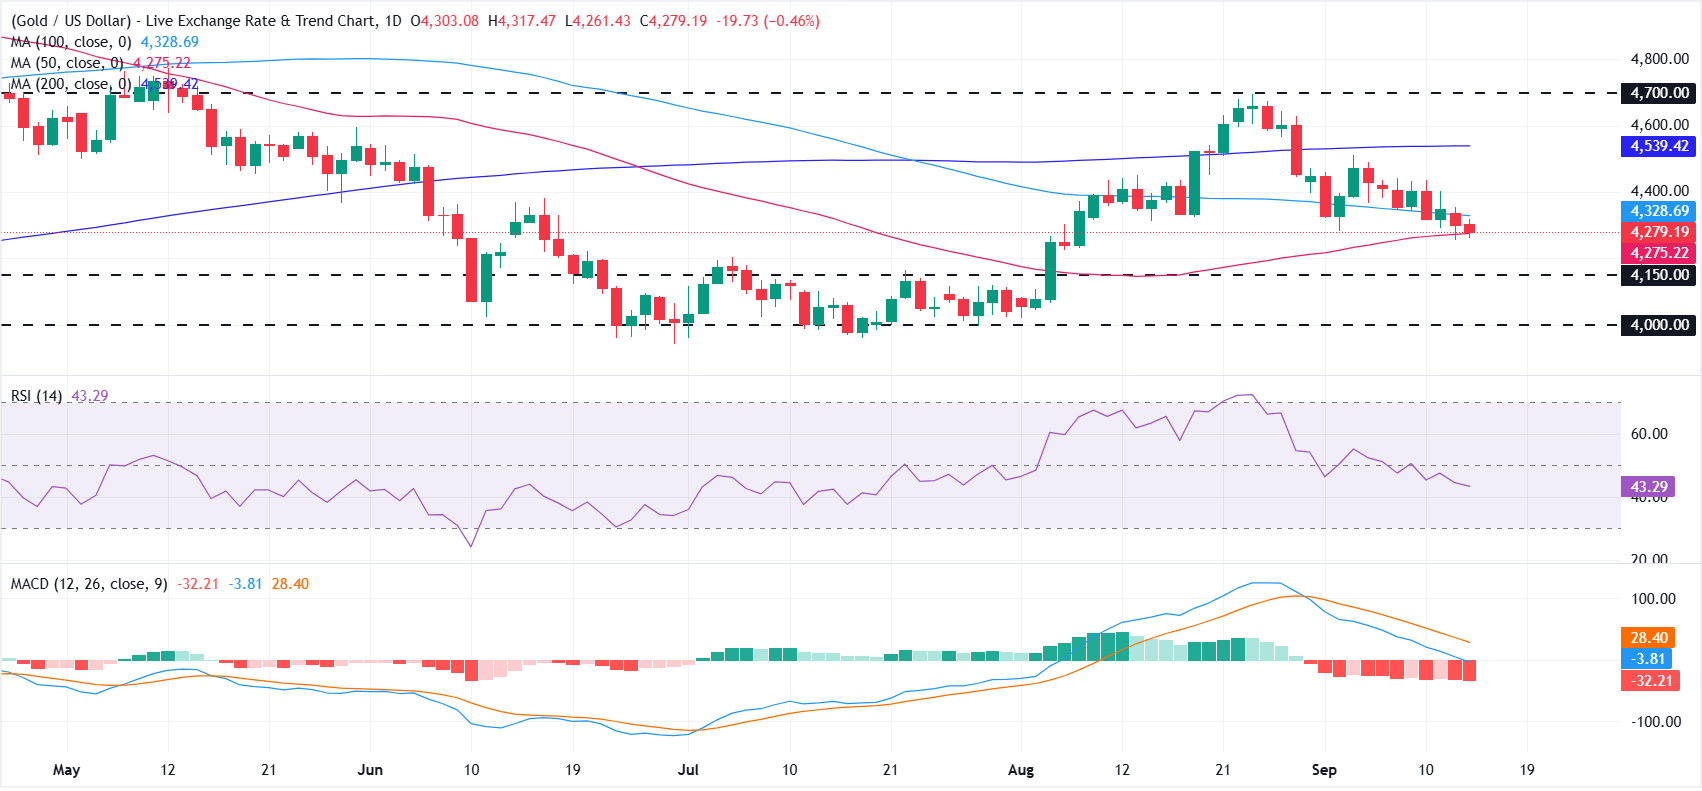
On the daily chart, XAU/USD maintains a bearish near-term bias as price holds below the 100-day Simple Moving Average (SMA) and the 200-day SMA. The metal is marginally above the 50-day SMA at about $4,275, which offers tentative support, but a soft Relative Strength Index (RSI) around 43 and a negative, declining Moving Average Convergence Divergence (MACD) histogram suggest increasing bearish momentum and leave the broader recovery vulnerable to further downside.
On the topside, initial resistance is aligned with the 100-day SMA at $4,328, ahead of a more substantial cap at the 200-day SMA near $4,539 and the horizontal barrier around $4,700. On the downside, a break below the 50-day SMA at $4,275 would expose the next horizontal floors at $4,150 and $4,000, where buyers are likely to reassess the medium-term trend.


Comments
Log in or sign up to join the conversation.