

Upside potential is there given that the target from the Head and Shoulders Pattern is around 1.3865.
The larger pattern in the GBP/CHF remains bullish given the following:
- Decisive breakout of Head and Shoulders Bottom and also breakout above the 200-day exponential moving average (ema) occurred four weeks ago. (Note: Pattern is not perfect with right shoulder noticeably lower than left. But valid nonetheless given reaction of price following breakout above neckline and 200-day ema.)
- Subsequently, the GBP/CHF continues higher following breakout and last week breaks out above the long-term downtrend line and closes above it on a daily basis. Even though the pair has closed back below the trend line the move above the line indicates this pair probably wants to go higher.
- 21-day ema crosses above 200-day ema two weeks ago
- During minor retracements price was rejected around 21-day ema support several times over the past six weeks and it held. This makes the 21-day ema a moving average to watch for support again in the future.
- The 200-day ema was tested once as support during recent pullback and it held. Support may be seen again around the 200-day ema during pullbacks.
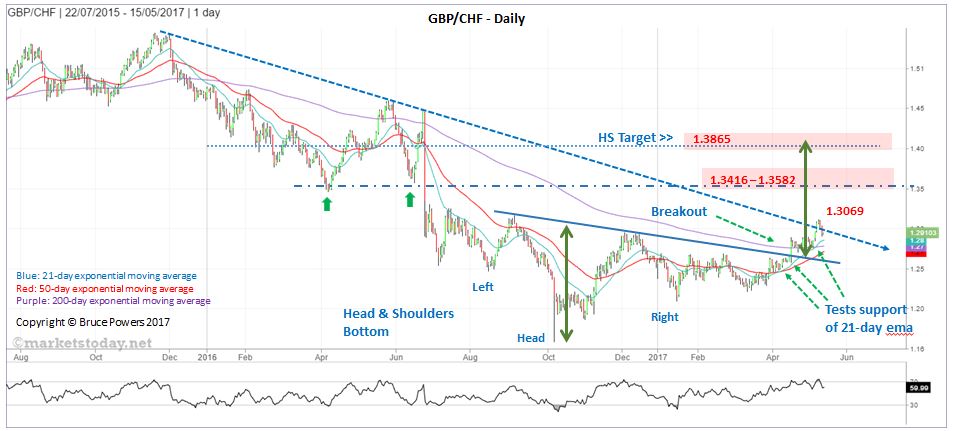
Given the above, the odds favor an eventual continuation of the uptrend that began off the mid-March 1.2215 bottom. In the short-term this pair is overbought and starting to pull back. However, support of 21-day ema is close by at 1.2814. The probability that we’ll see signs of support around the 21-day ema is higher than normal given that the uptrend line represents the same price support area. On the below chart the uptrend line is covering the 21-day ema.
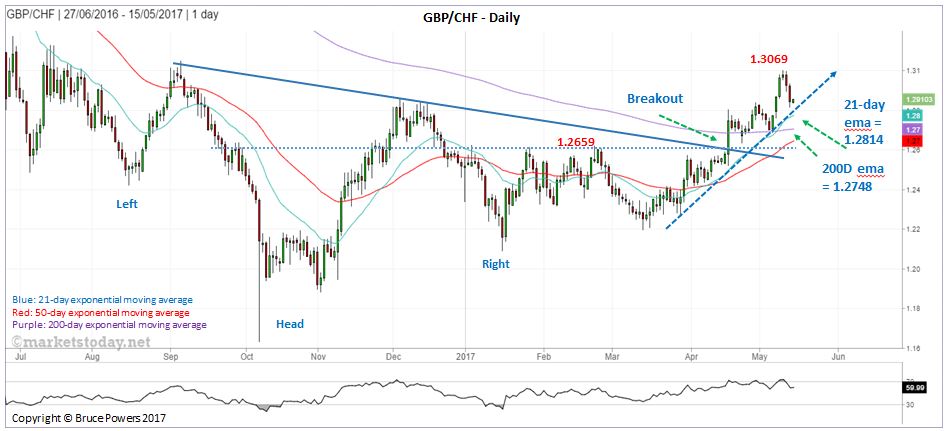
Regardless, if price continues lower the 200-day ema should halt further declines. The 200-day ema is now at 1.2748.
Watch price behavior around the 21-day ema for signs of reversal on the intraday charts. If the 21-day fails to hold the decent then next watch for support around the 200-day ema.
Upside potential is there given that the target from the Head and Shoulders Pattern is around 1.3865. This is a long-term target and it could take some time to meet this objective if it is to be reached.
In the meantime, lower down, the next main target area is around a price zone from approximately 1.3416 to 1.3582. That resistance zone provides plenty of upside as it’s over 500 pips above last week’s close of 1.2895.

Comments
Log in or sign up to join the conversation.