

Key Market Outlook(s) and Pick(s)
Cooper Standard (CPS) Update
For newer readers, here’s a quick overview of the key drivers behind our thesis on Cooper Standard, a special situation auto supplier offering a leveraged play on the light vehicle production recovery and the massive operating leverage that comes with it:
Same story, different quarter.
Cooper Standard delivered another quarter of textbook execution in what can only be described as a brutal operating environment. Tariffs. The Iran war. Rising input costs. Customer supply chain disruptions. Anemic production volumes. The headwinds stacked against CPS are among the harshest the auto industry has faced in decades.
And yet, the only thing that mattered this quarter was that Cooper Standard kept doing what Cooper Standard does best. Cutting costs. Driving efficiency. Executing.
On that front, the countless headwinds have done little to derail the company’s steady operational progress, a credit to management’s discipline and ability to execute through an extremely difficult backdrop for the industry.
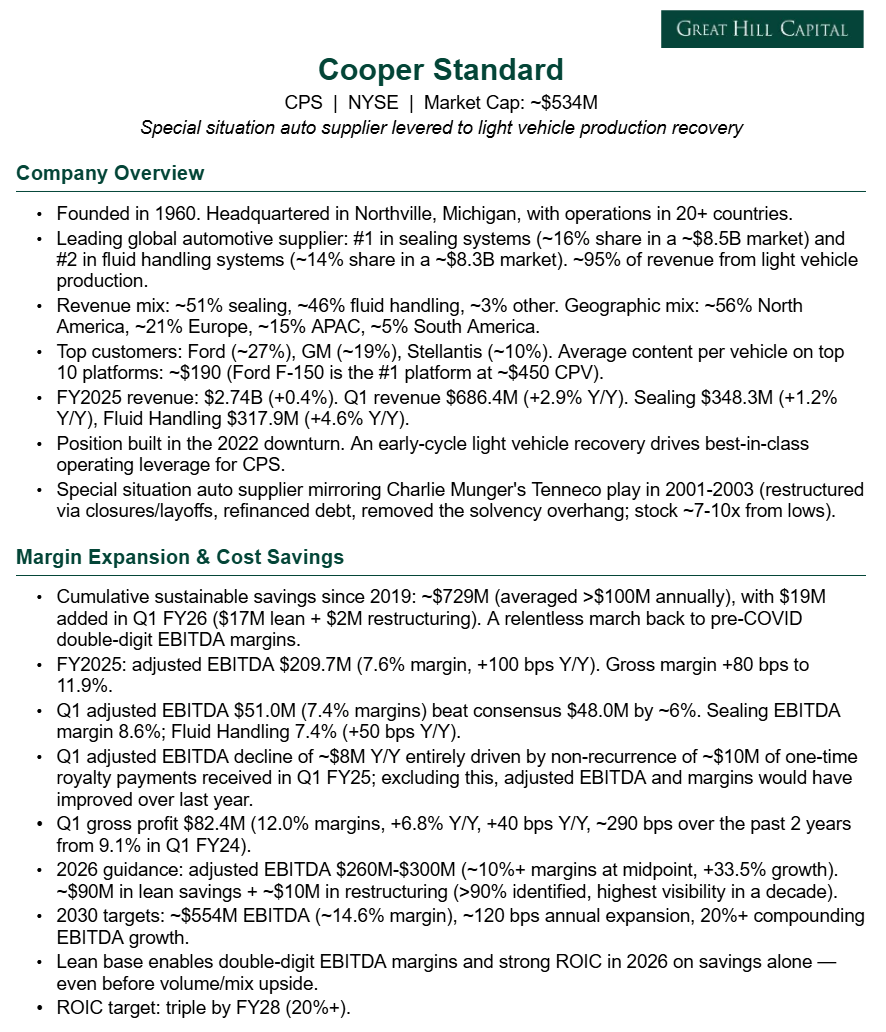
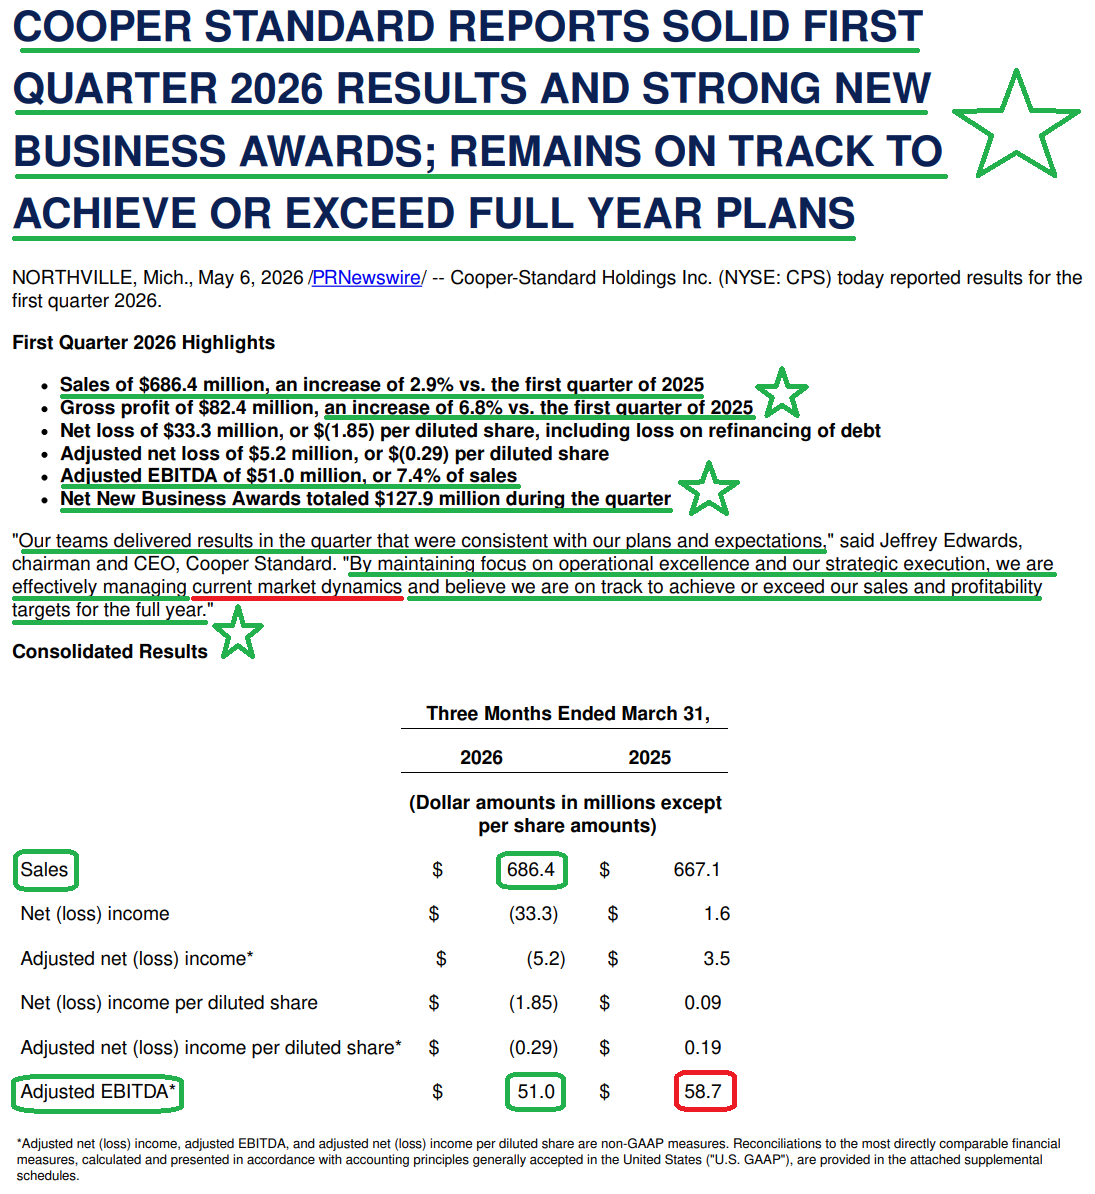
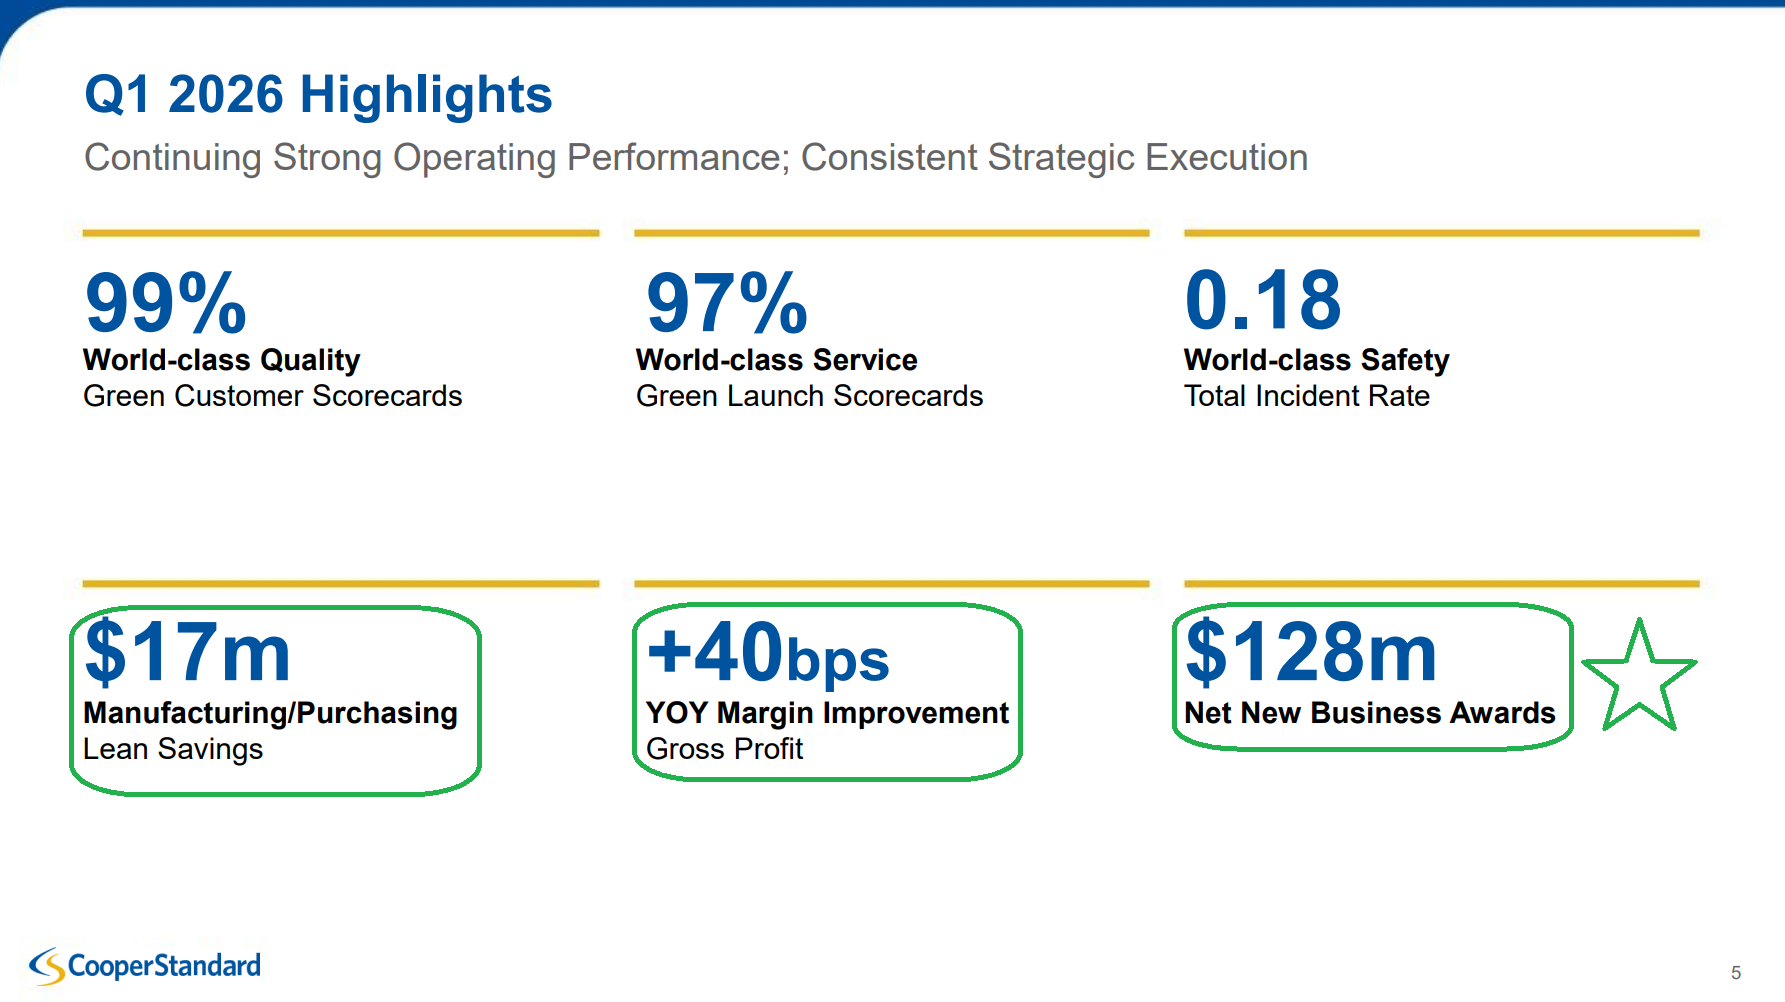
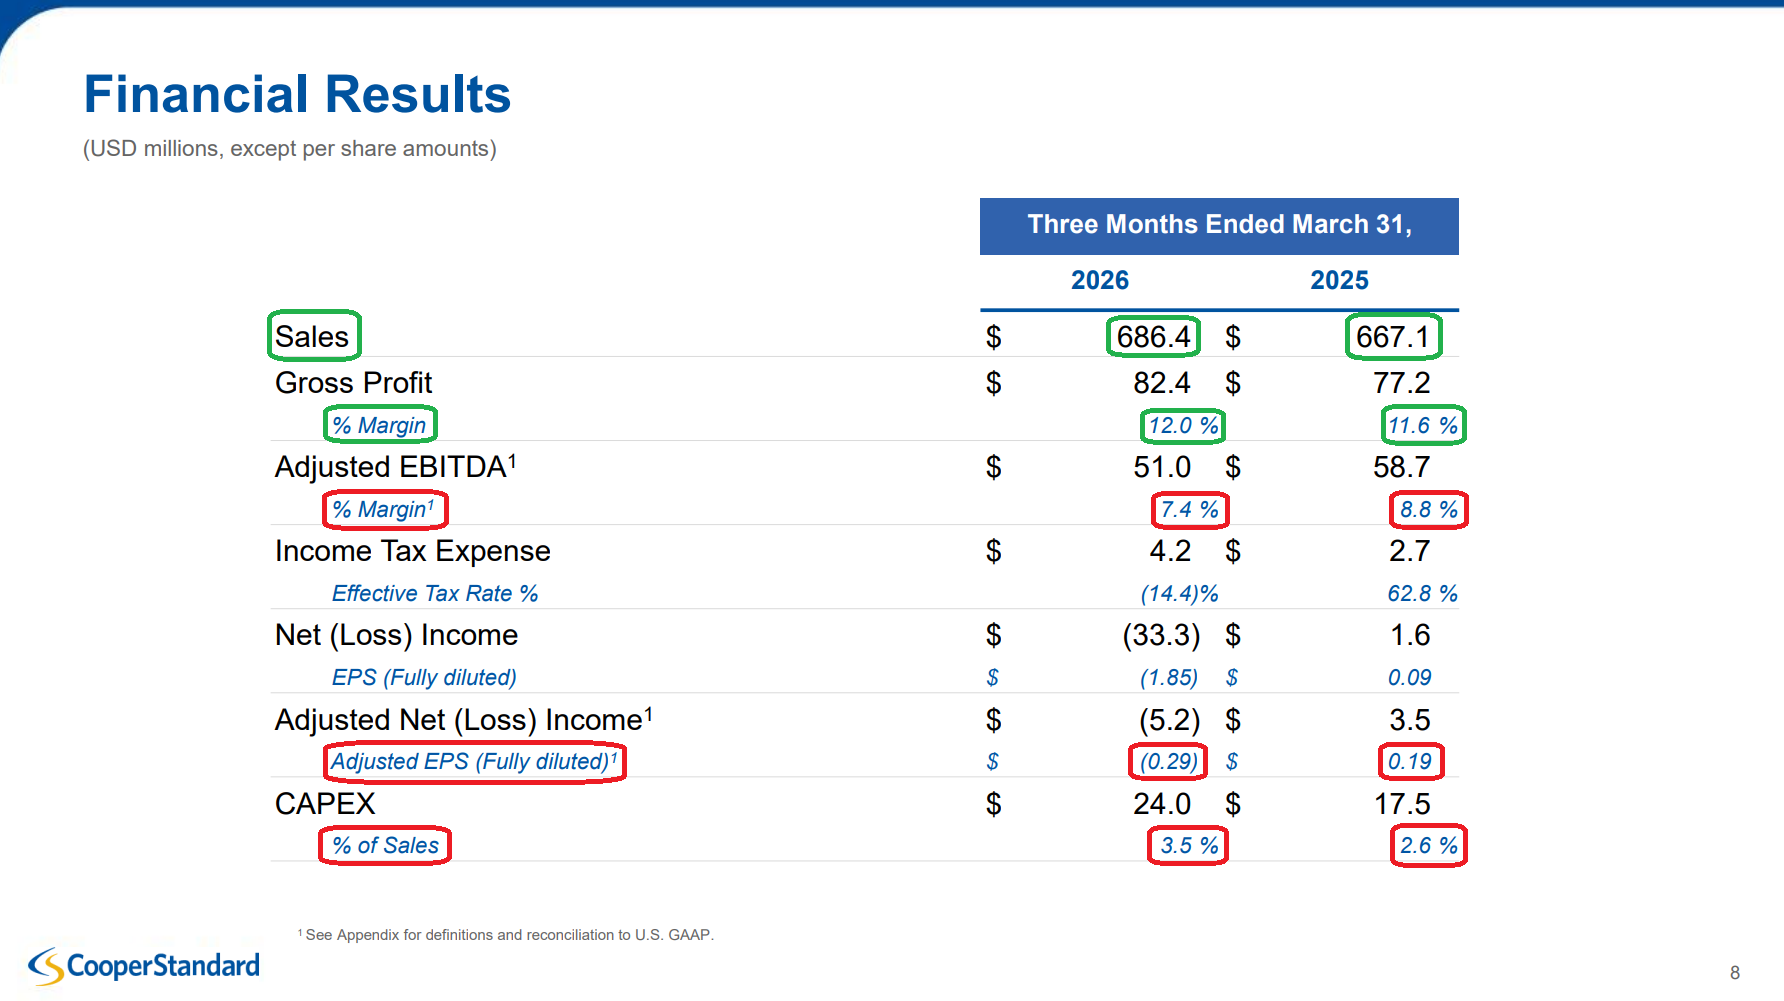
Revenue of $686.4M (+2.9% Y/Y) beat consensus by ~4%.
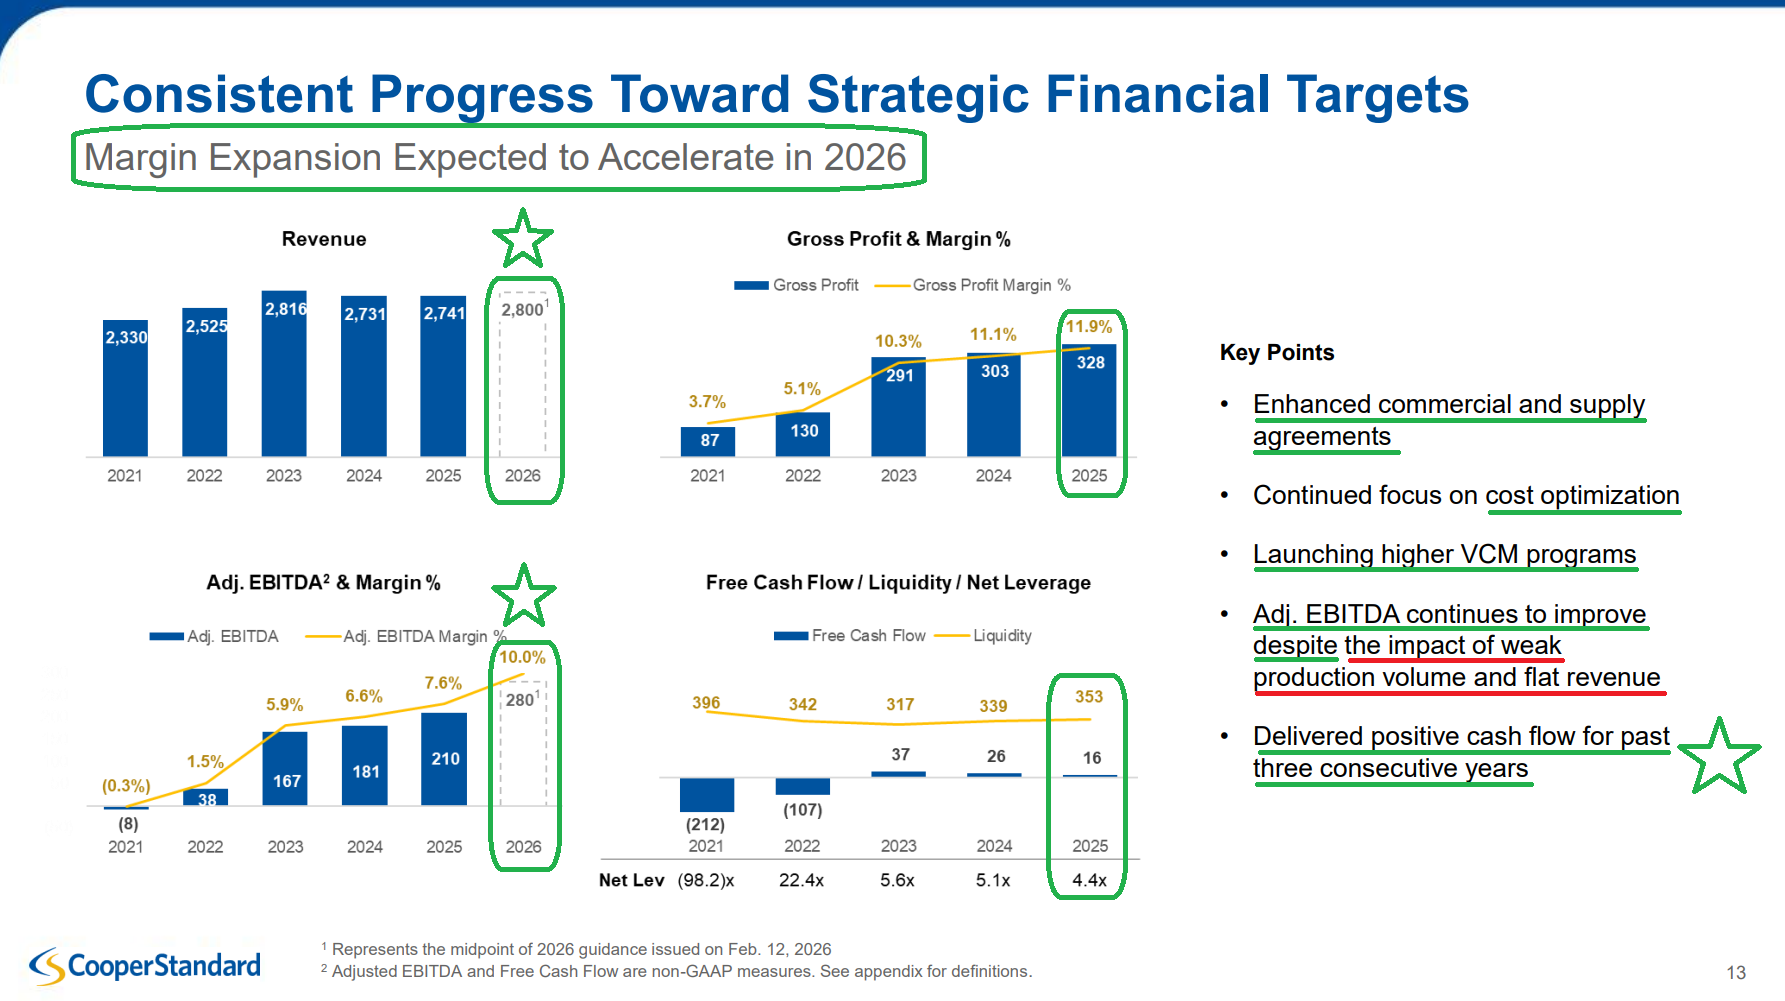
Gross profit came in at $82.4M (+6.8% Y/Y), with gross margins expanding 40 bps to 12.0%, bringing the two-year expansion to ~290 bps from the 9.1% level in Q1 FY24.
Adjusted EBITDA totaled $51.0M, beating consensus by ~6%. Margins came in at 7.4% versus 8.8% in the prior year, though the entirety of the year-over-year decline was driven by the non-recurrence of a ~$10M one-time royalty payment received in Q1 FY25. Strip that out, and both adjusted EBITDA and margins would have improved year over year.
Most importantly, CPS remains firmly on track to achieve the long-awaited return to double-digit adjusted EBITDA margins this year, along with a 4th consecutive year of positive free cash flow.
In fact, management explicitly stated CPS is on track to achieve OR EXCEED full-year guidance, with a formal update expected alongside Q2 results in August. For a group of conservative Midwestern operators to say that after Q1, the writing is on the wall for a guidance raise.
And they’re doing all of this with ZERO help from production volumes.
But the real story this quarter, and what should not be glossed over, is that Cooper Standard’s net new business awards have, as Jensen Huang would say, gone PARABOLIC.
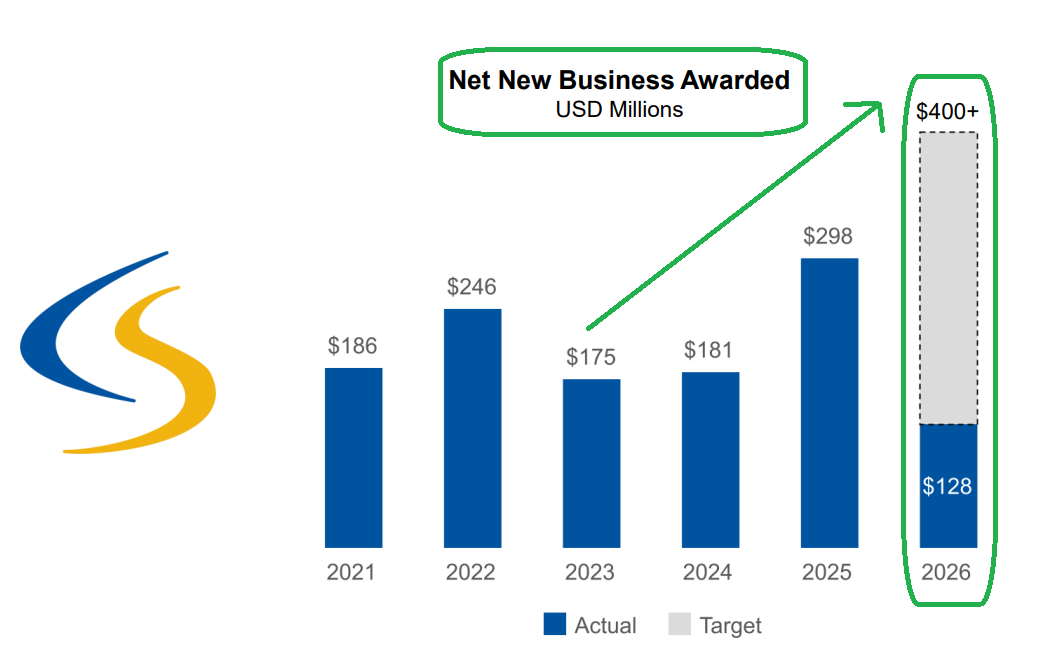
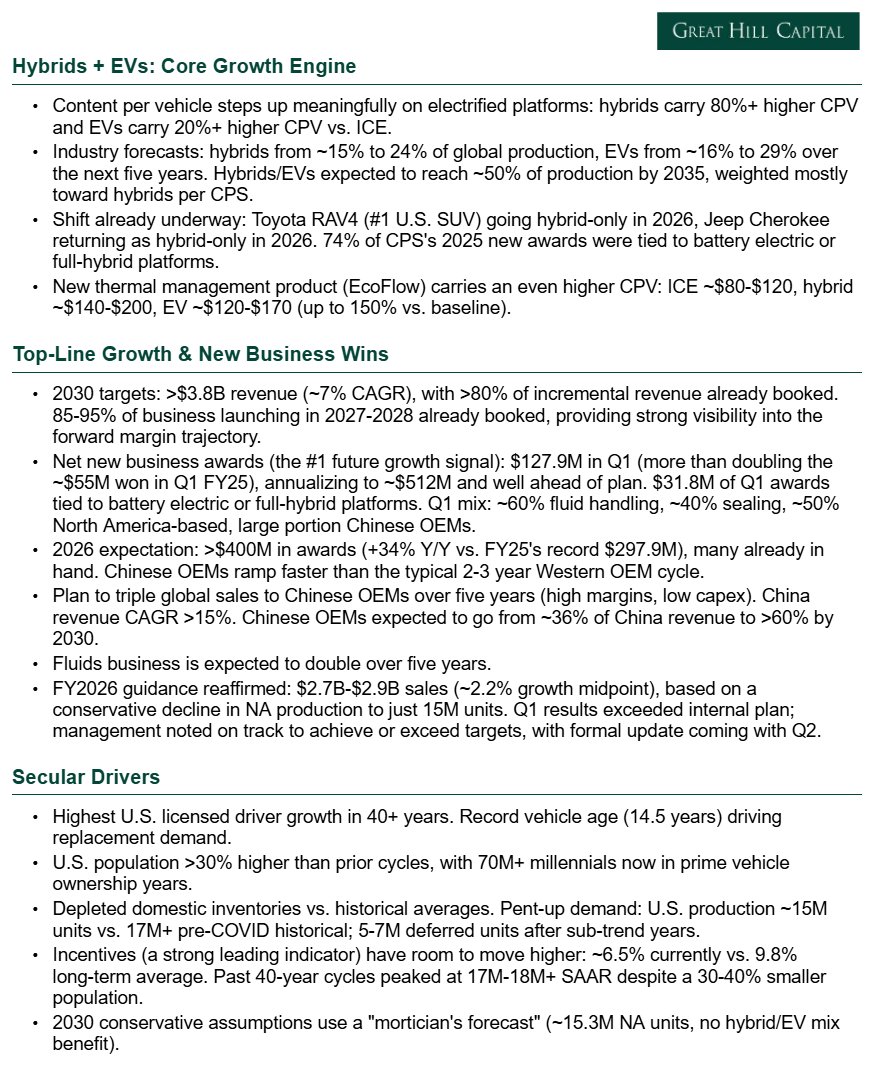
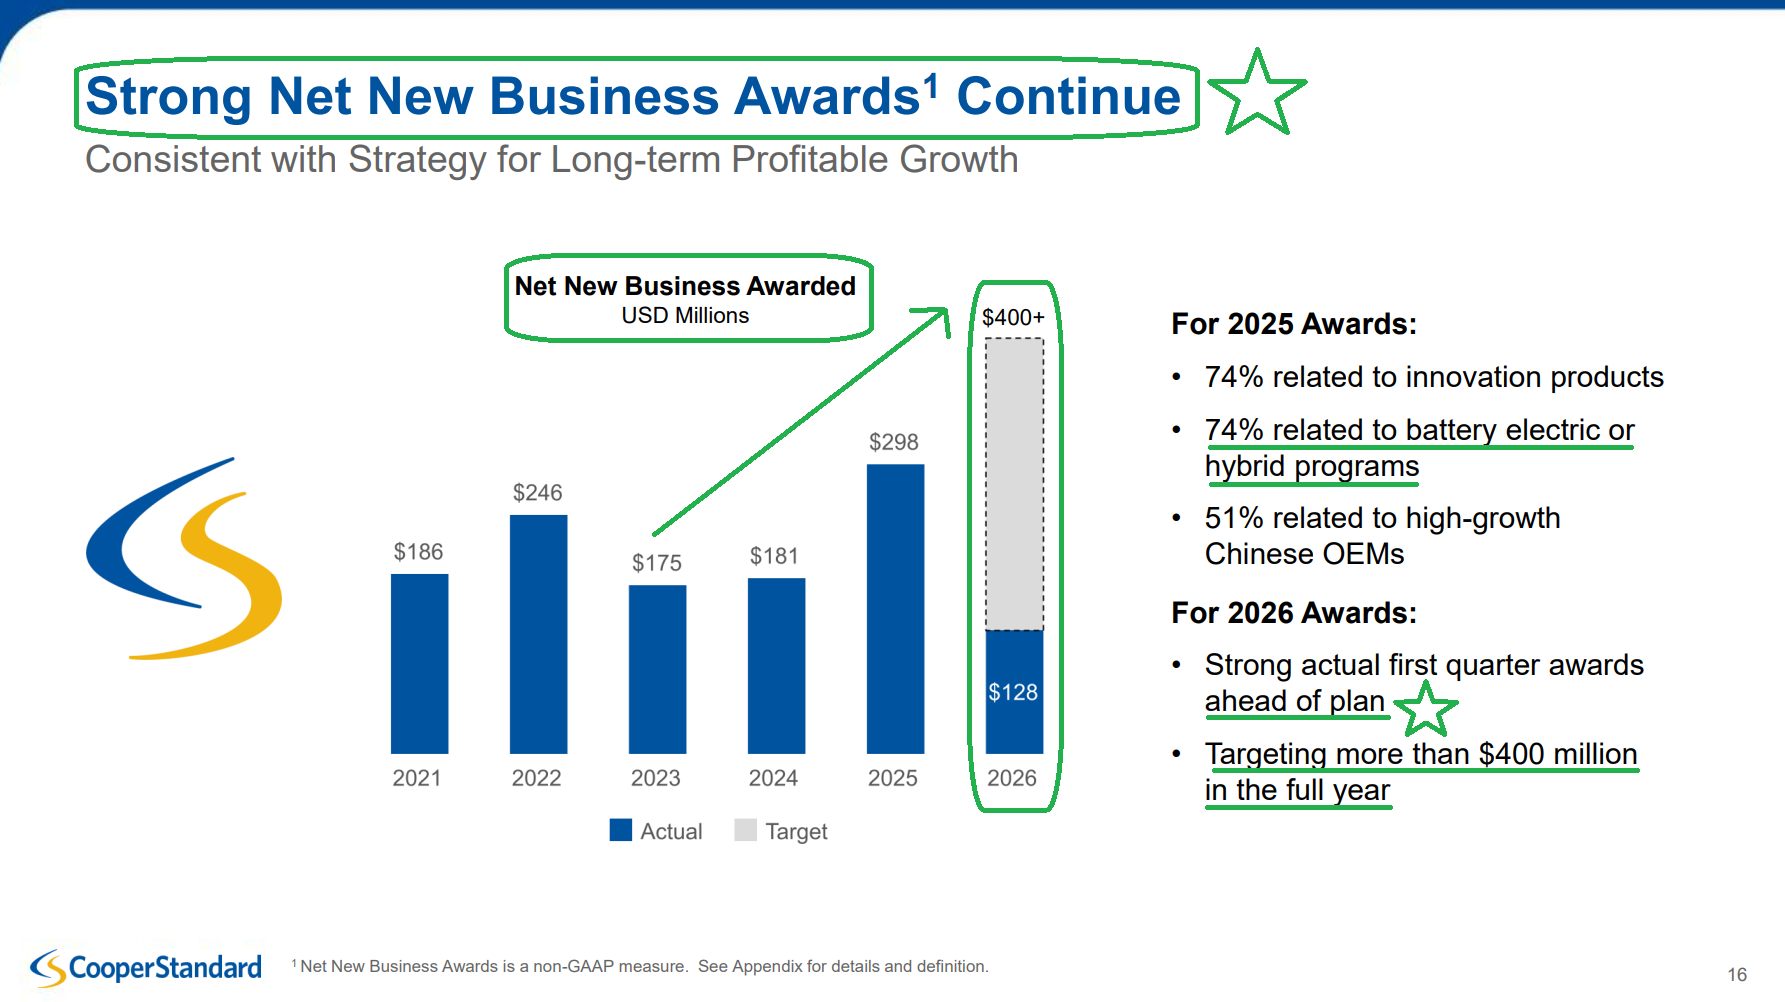
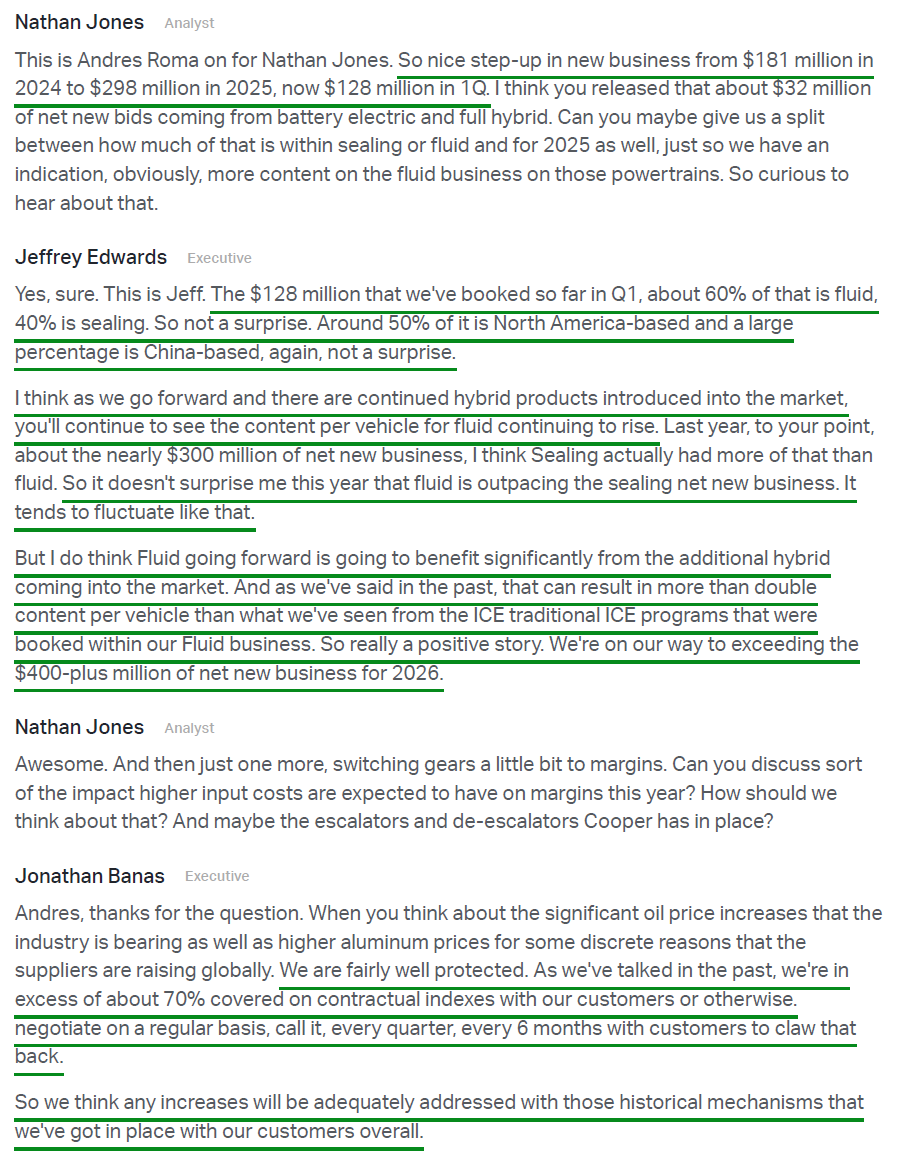
CPS booked $127.9M in net new business awards during Q1 alone. To put that into perspective, that is more than 70% of the total awards won in all of FY24 ($181M), more than double the amount won in Q1 FY25 (~$55M), and annualizes to ~$512M, well ahead of management’s $400M+ target. Of the $127.9M in awards, $31.8M was tied specifically to battery electric or full hybrid platforms, which carry +80% CPV and +20% CPV versus ICE, respectively, continuing the secular mix shift toward higher-content programs.
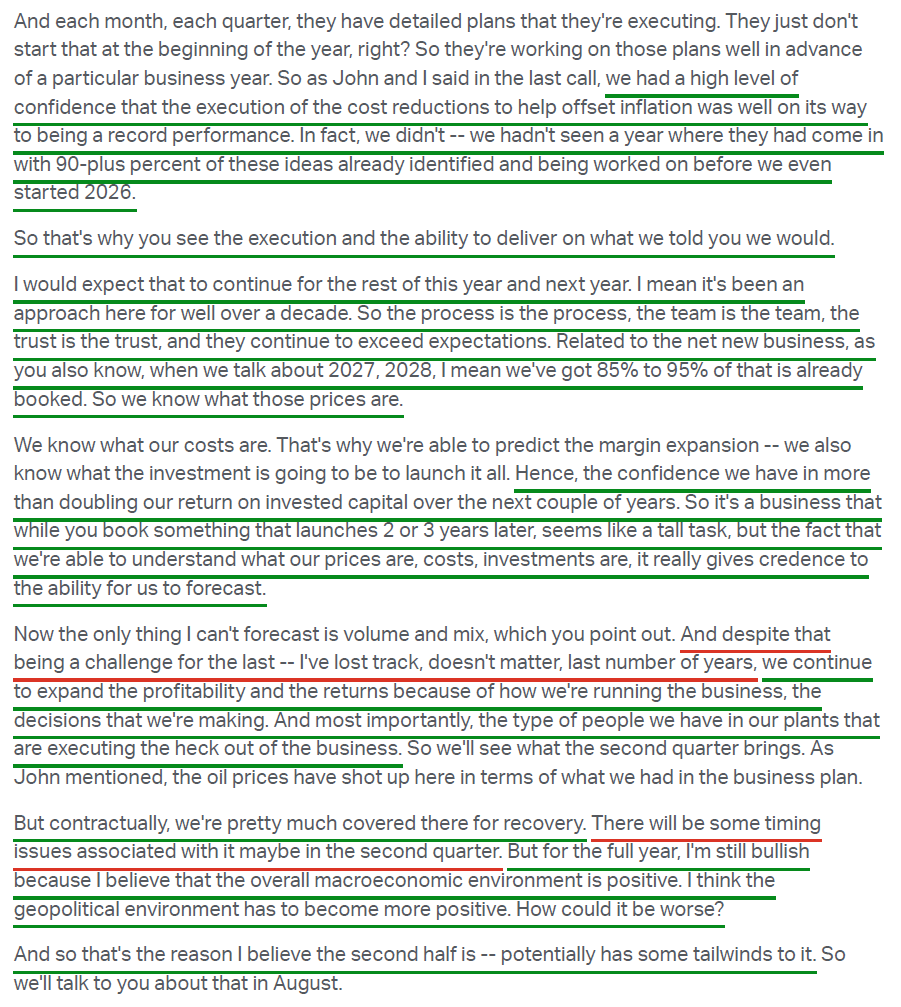
Even more impressive is the fact that 85% to 95% of the business launching in 2027 and 2028 is already booked. Cooper Standard already knows the pricing, expected costs, and required investment for the overwhelming majority of what will launch over the next several years.
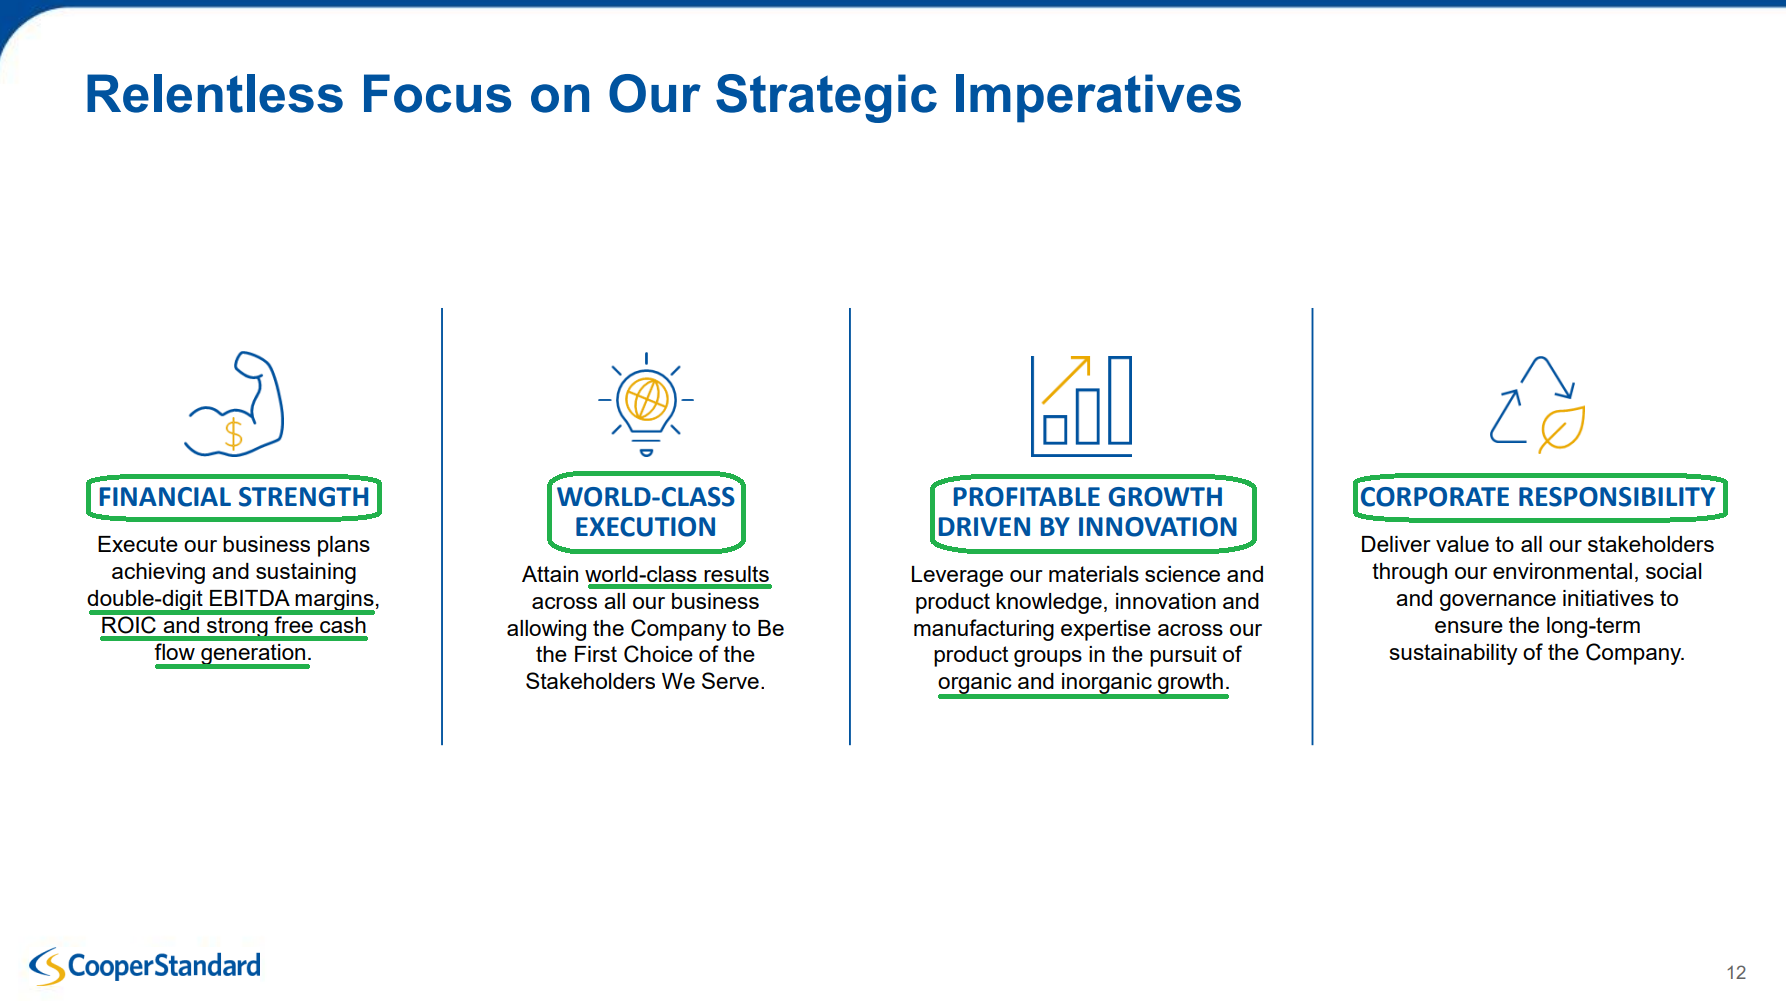
CPS has the capacity to bring this new business online with minimal incremental capital investment, the key reason management continues to guide for ROIC tripling to above 20% by the end of FY28.
With the refi overhang now behind CPS and no material debt maturities until 2031, the focus turns to the biggest needle mover in this story: volumes.
On that front, despite the market’s fixation on short-term noise, the bigger picture is still being driven by secular trends and catalysts moving decisively in Cooper Standard’s favor:
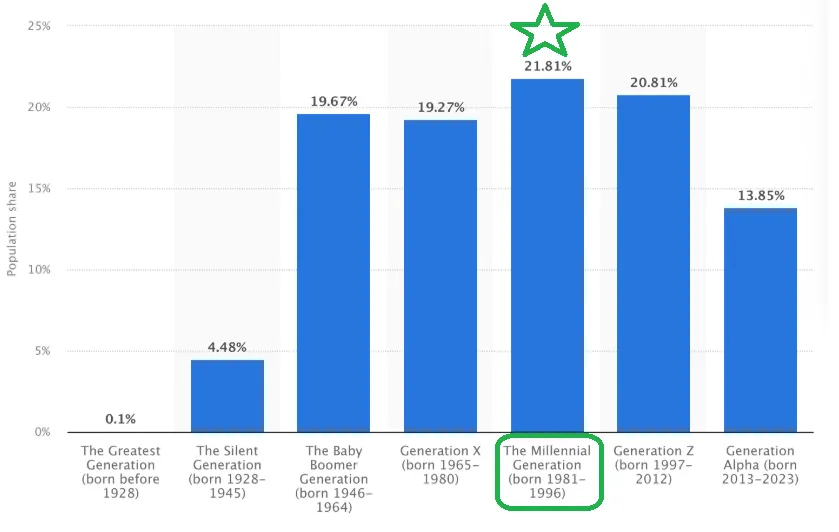
Millennials in prime ownership years: Now the largest generational cohort at 21.81% of the US population, with 74M+ entering prime vehicle ownership and family formation years.
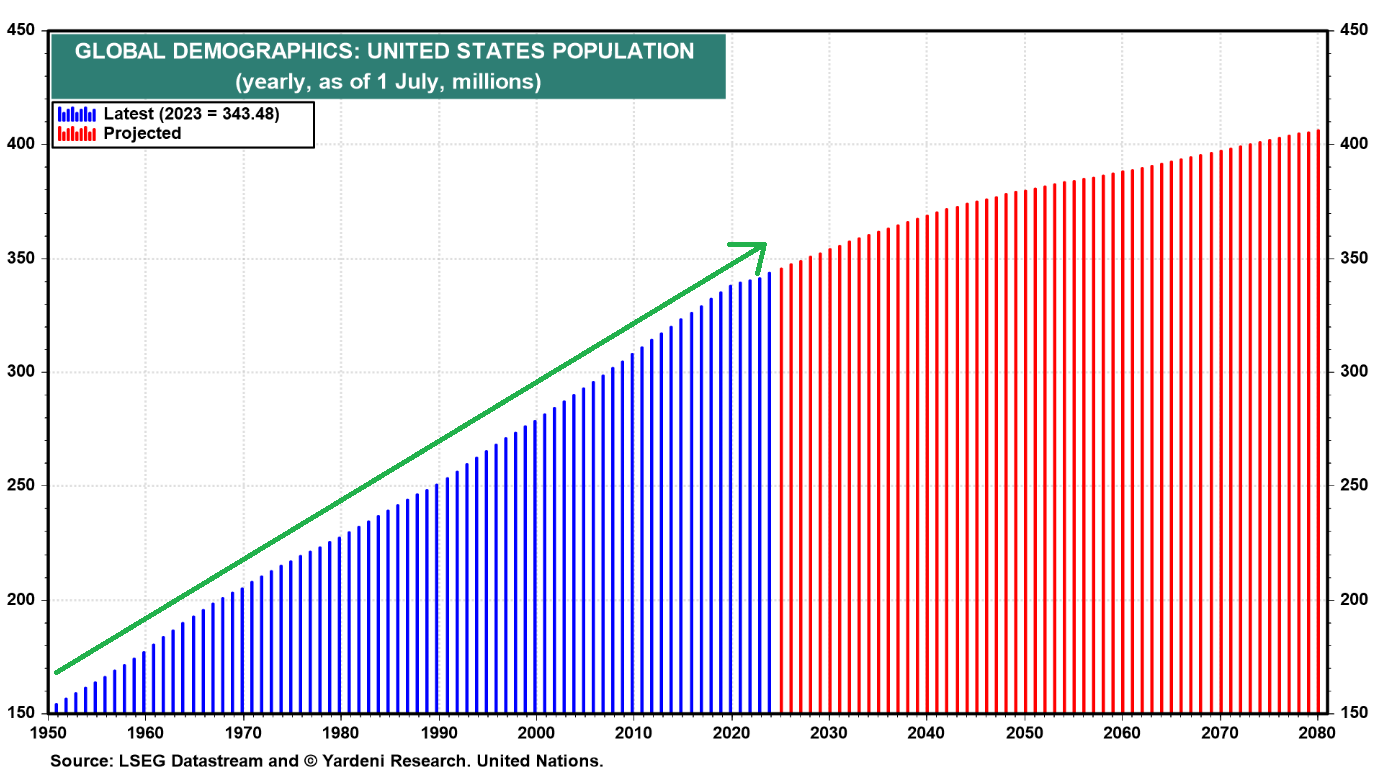
Record US population: The US population now stands at ~343M and continues to grow, providing a steadily expanding demand backdrop.
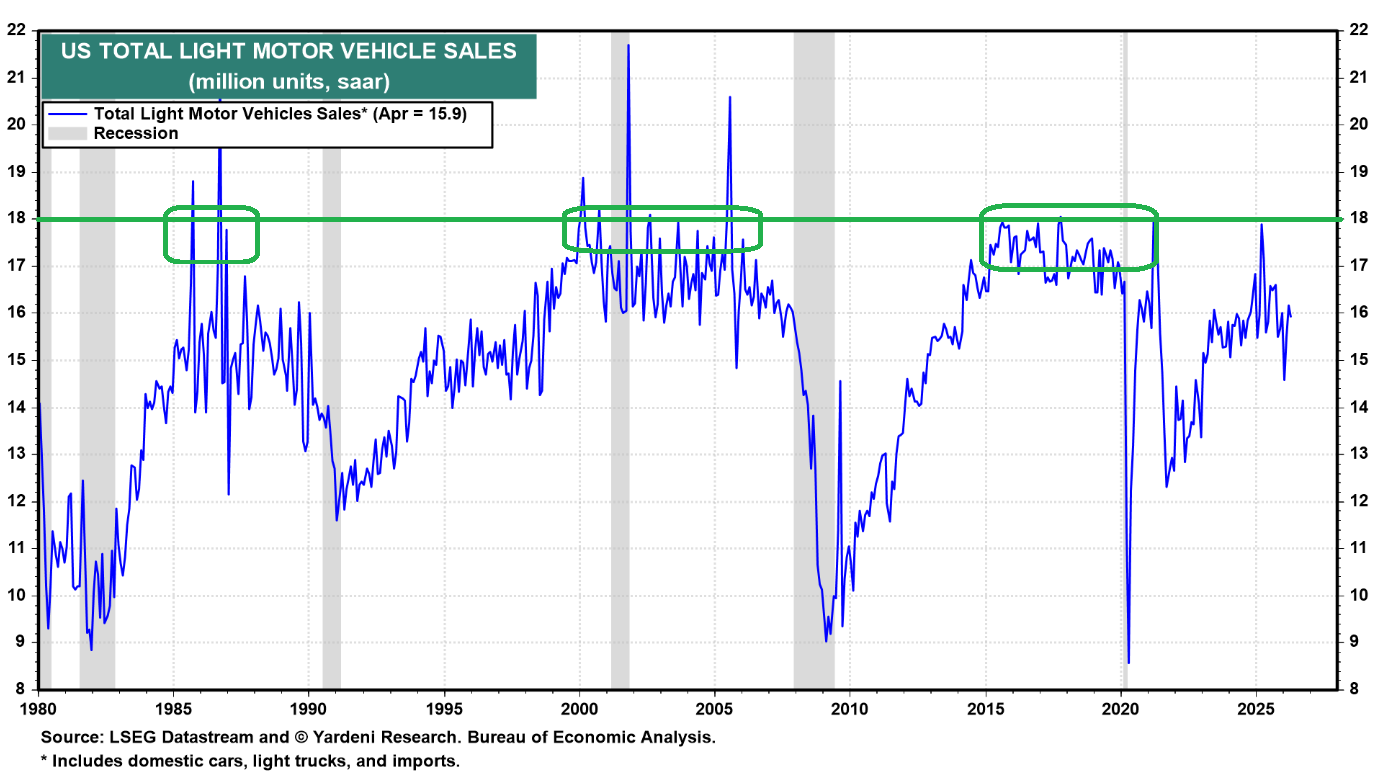
US SAAR sitting well below prior cycle peaks: US SAAR at 15.9M today versus 17M to 18M+ in every prior cycle going back to the 1970s, despite a population that is now far larger.
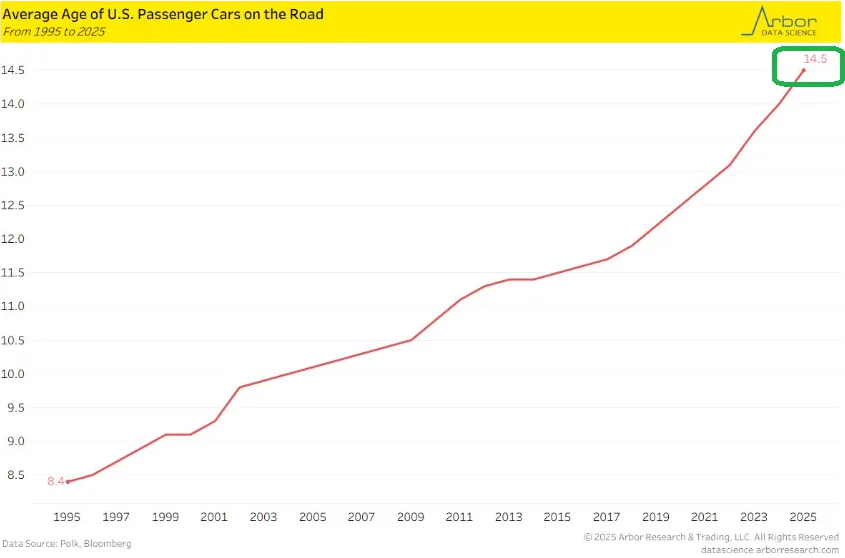
Record-high average vehicle age: Average age of US passenger cars on the road at an all-time high of 14.5 years, up from 8.4 in 1995, driving structural replacement demand.
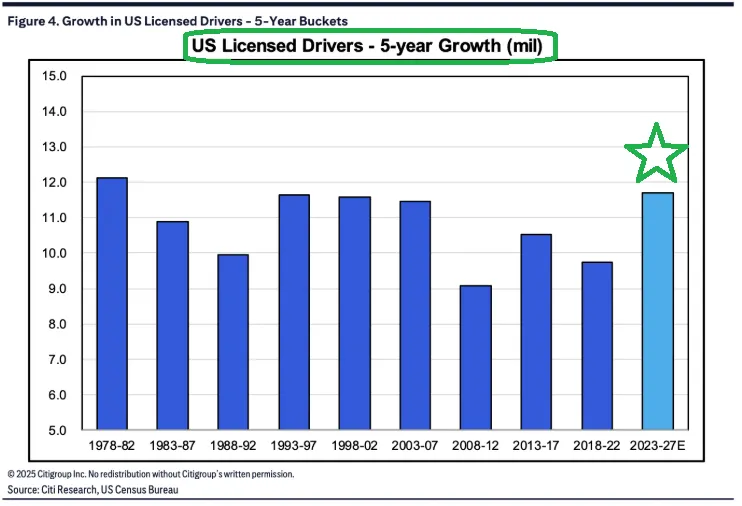
Strongest licensed driver growth in 40+ years: US licensed driver growth pacing at ~11.7M over 2023-2027E, the highest 5-year growth bucket since the late 1970s.
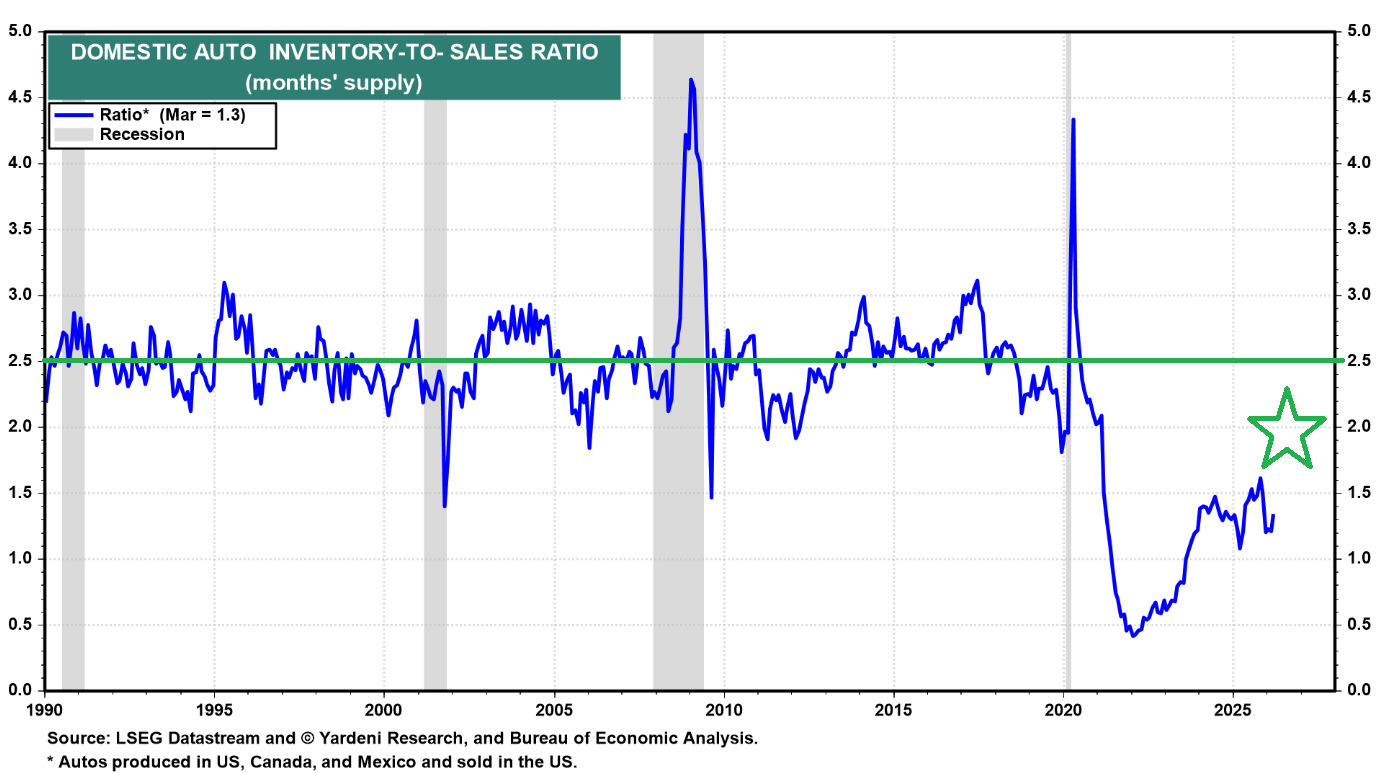
Depleted domestic inventories: Inventory-to-sales ratio sits at just 1.3 months, well below the long-term historical average.
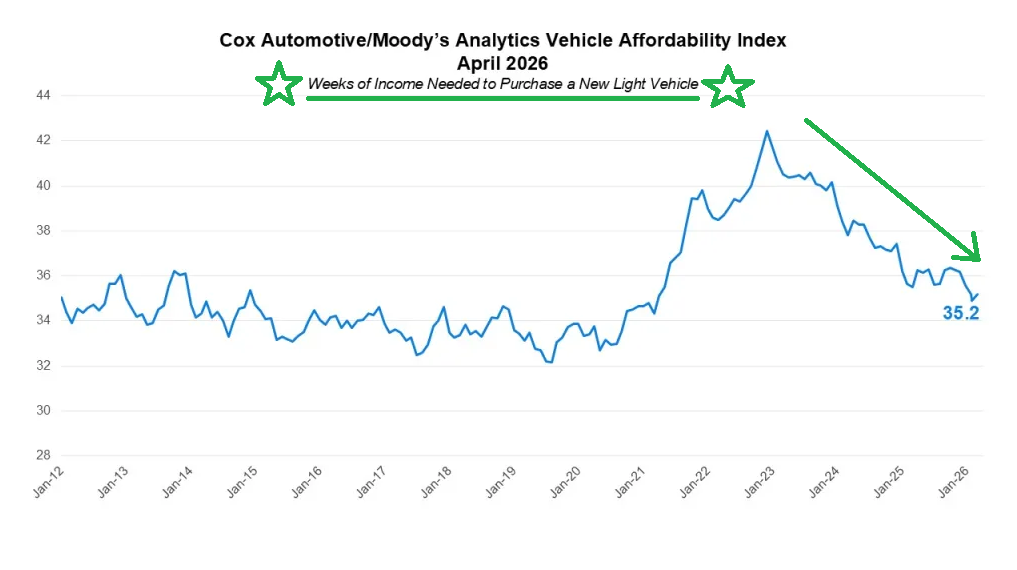
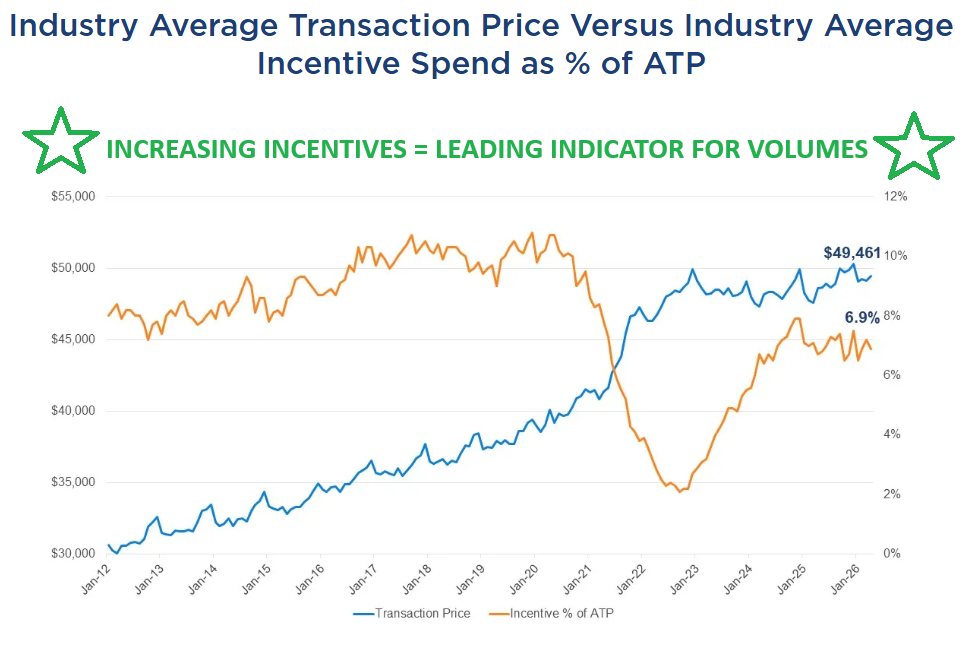
Improving affordability: Cox/Moody’s vehicle affordability index now sits at 35.2 weeks of income needed to purchase a new light vehicle, down from the ~42-week peak in early 2023.
Rising incentives: Industry incentives sit at 6.9% today versus the 9% to 10% long-term average. Plenty of room to work higher.
Ford (F) nationwide employee pricing: Ford (Cooper Standard’s #1 customer at 27% of revenue) rolled out employee pricing on most 2025 and 2026 models, providing a direct boost to volumes on CPS’s largest and highest-CPV platform.

Chinese OEM global expansion accelerating: China EV exports rose 40% Y/Y to 278,081 in April, with Chinese OEMs continuing to gain aggressive global market share. CPS expects to TRIPLE sales to Chinese OEMs over the next five years.


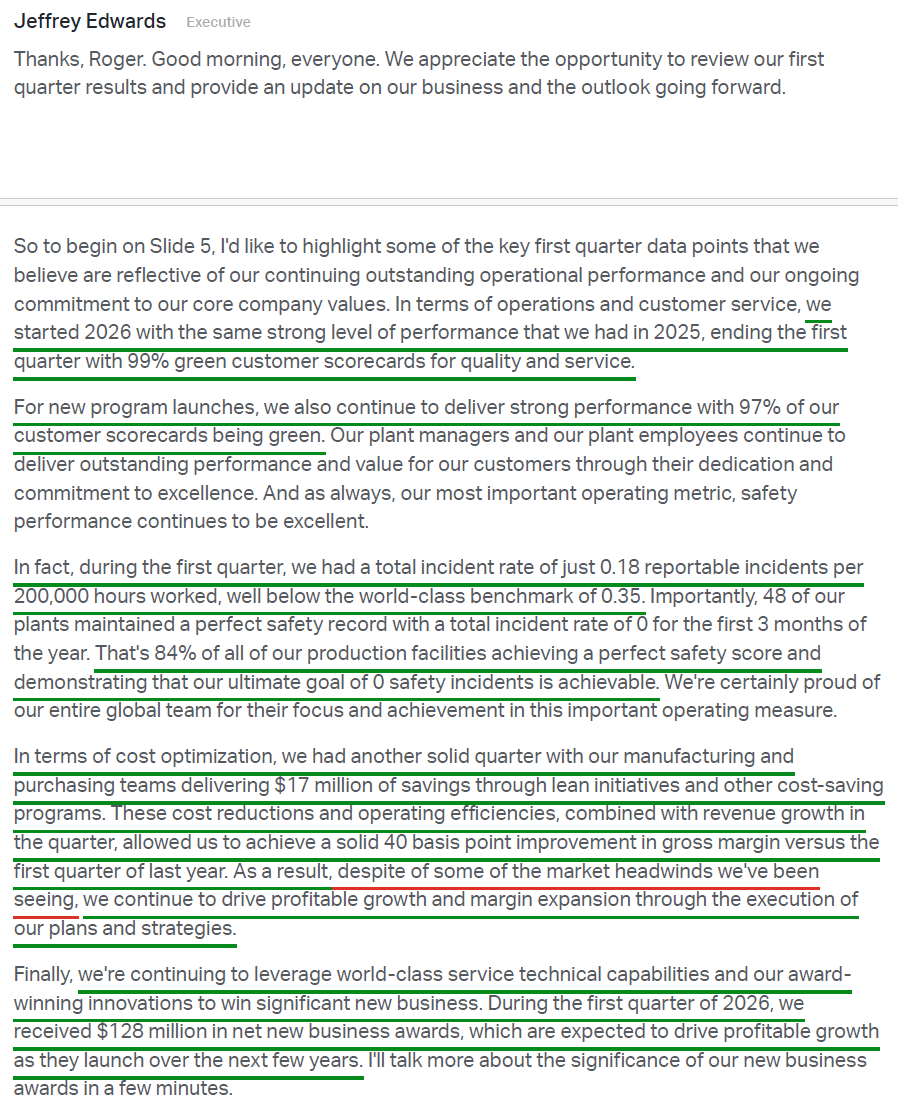
As Jeff Edwards summed it up best on the call:
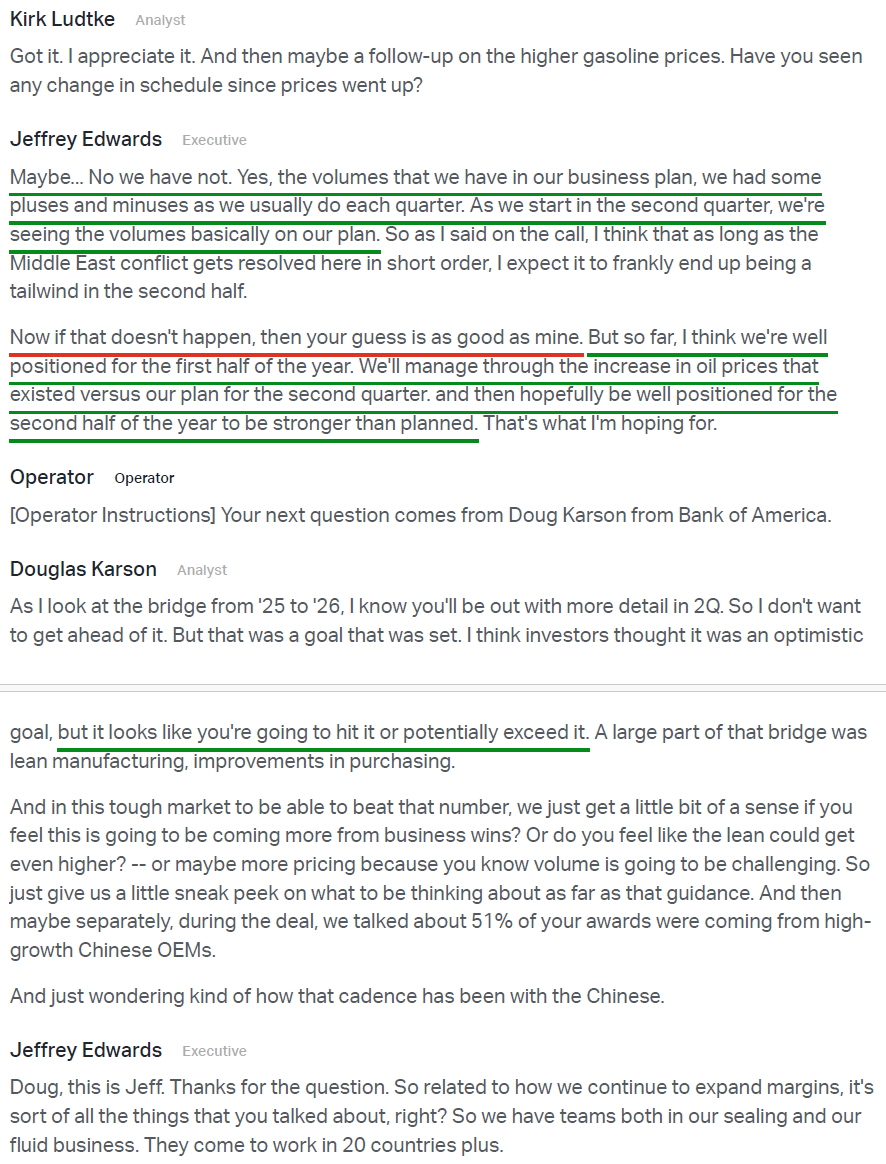
“I’m still bullish because I believe that the overall macroeconomic environment is positive. I think the geopolitical environment has to become more positive. How could it be worse? And so that’s the reason I believe the second half potentially has some tailwinds to it.”
Bottom line, Cooper Standard continues to execute on every lever within its control while waiting for the cycle to turn. When (not if) volumes normalize, the operating leverage embedded in this business is set to be MASSIVE.
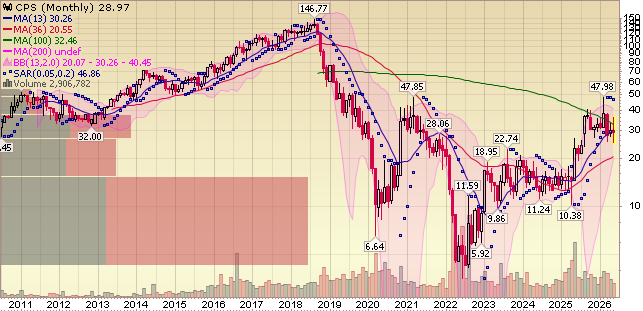
With ~$3.8B in revenue and 14%+ EBITDA margins on the table by 2030 (versus the 2017 peak of $3.6B in revenue at 12.5% EBITDA margins that drove $7.21 in EPS and a $146 stock price), the path to $10+ in earnings power is no longer a someday story. There is now a direct line of sight.
Q1 Earnings Breakdown
10 Key Points
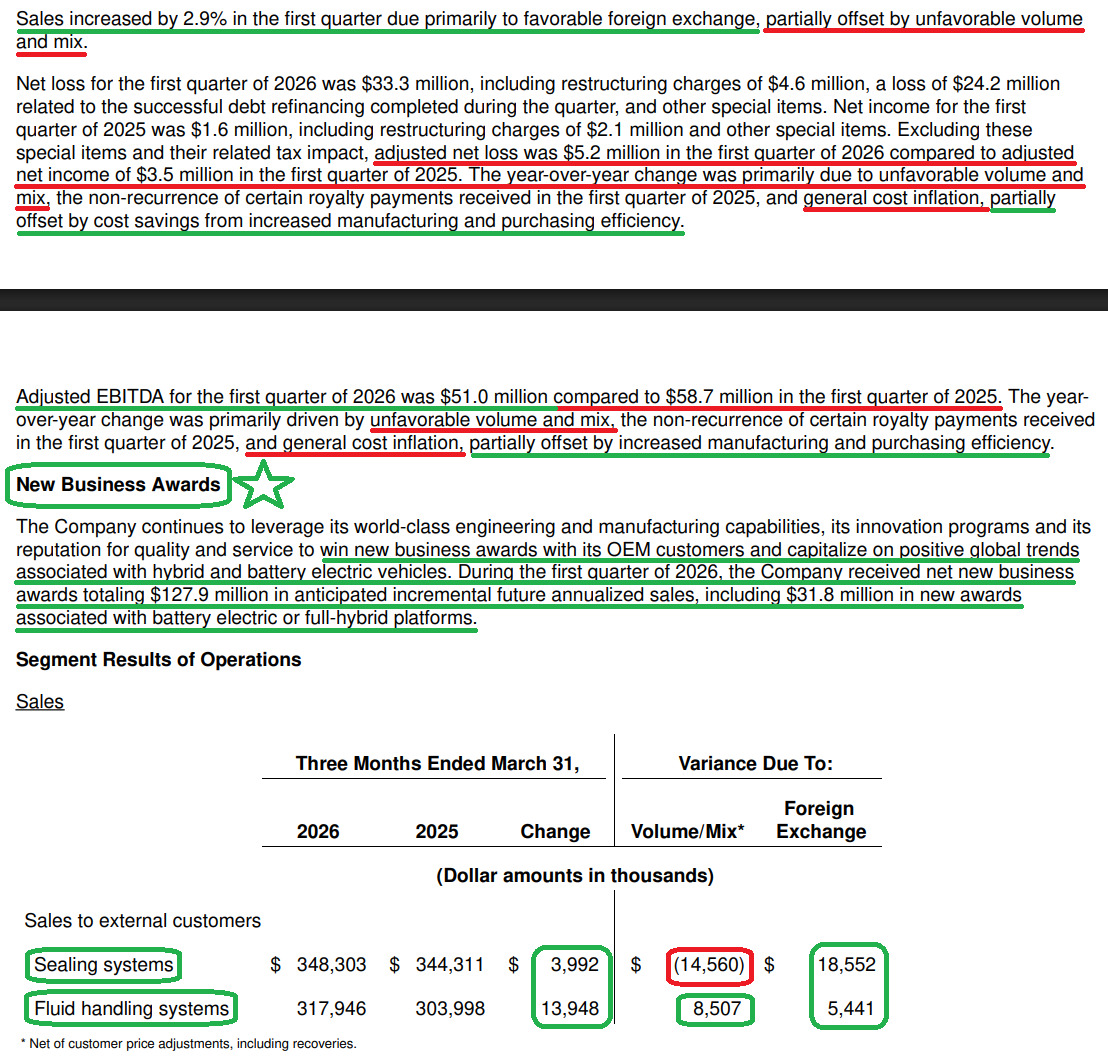
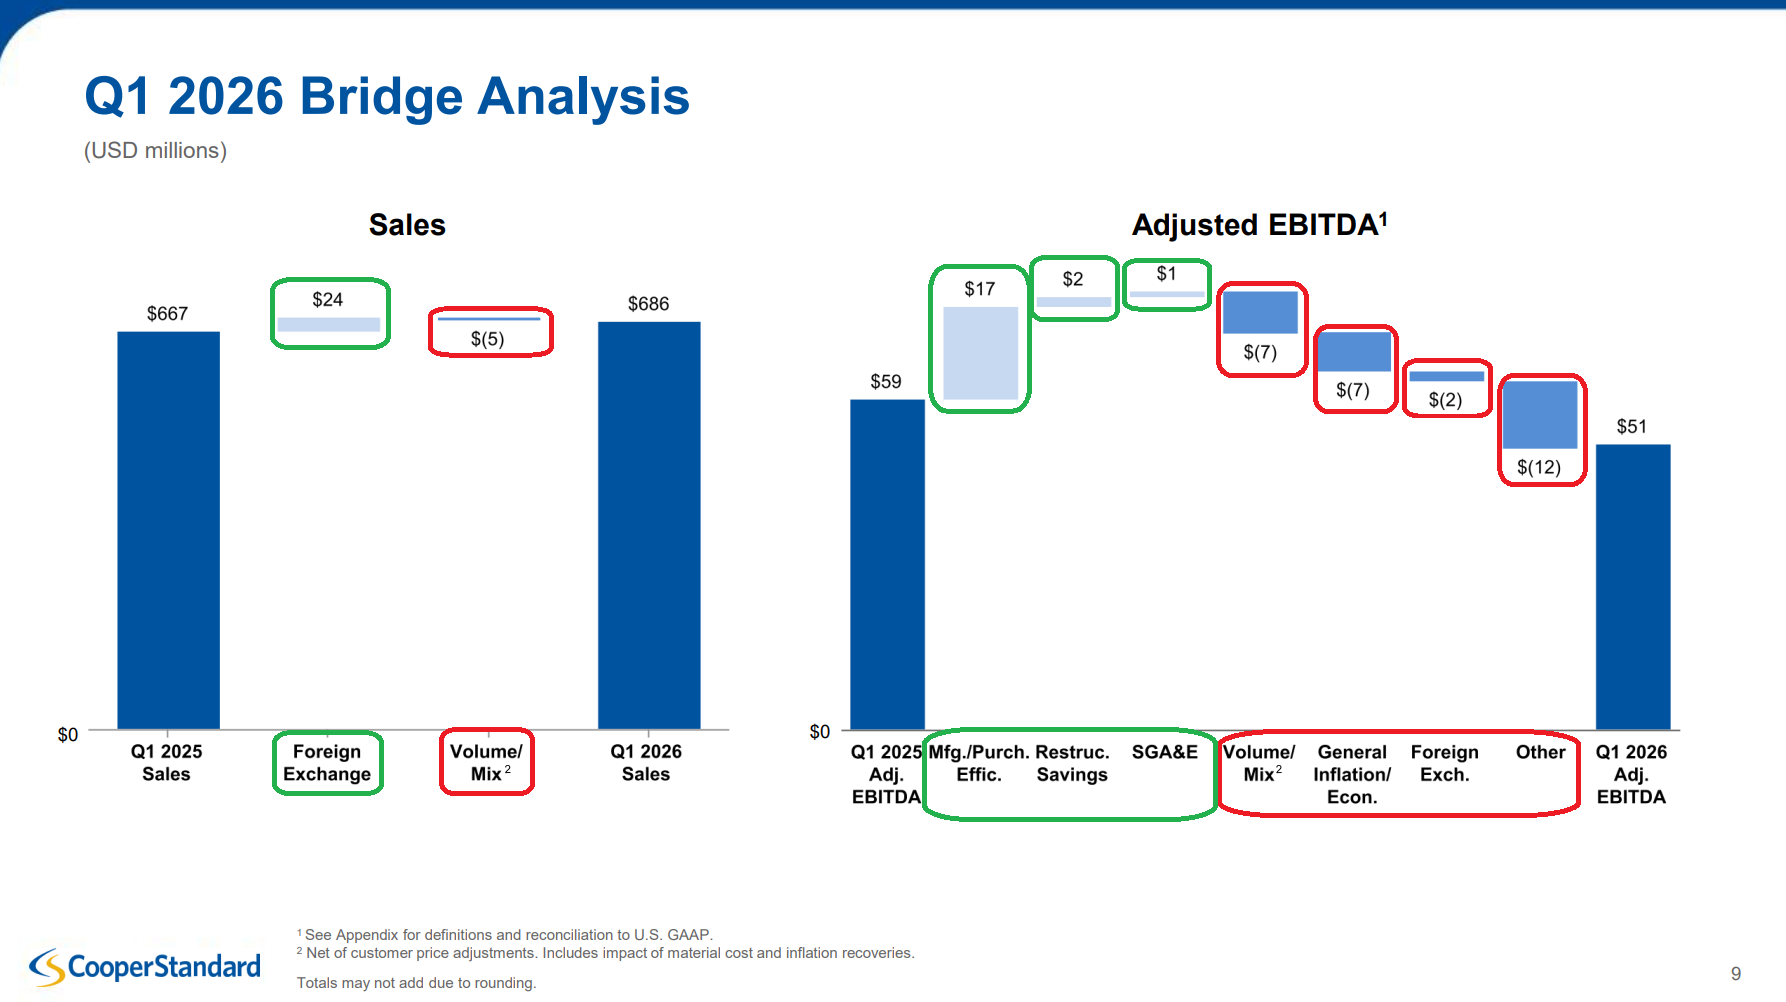
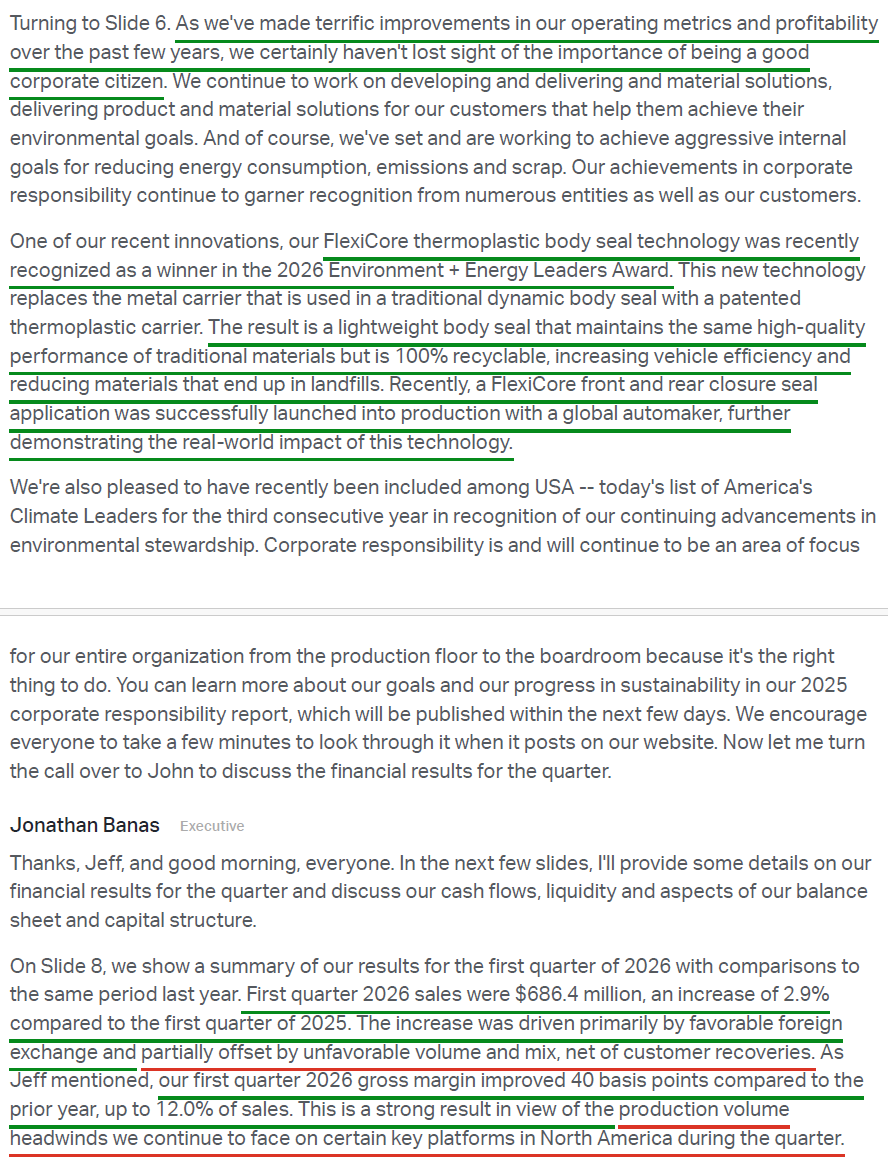
1) Cooper Standard posted $686.4M in revenue (+2.9% Y/Y), beating consensus of $660M by ~4%. Top line was driven primarily by a $24M favorable FX tailwind, partially offset by ~$5M of unfavorable volume and mix, net of customer price recoveries.
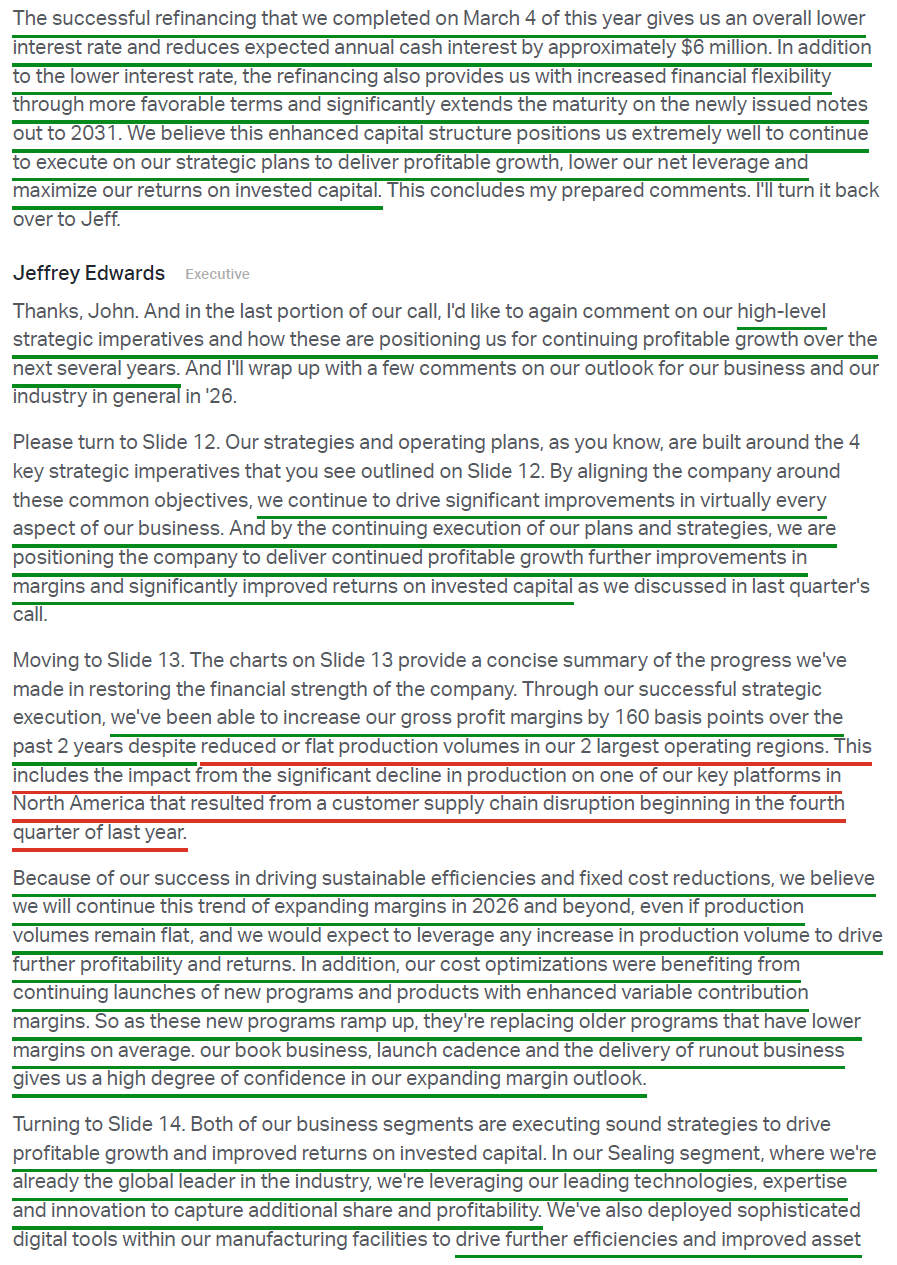
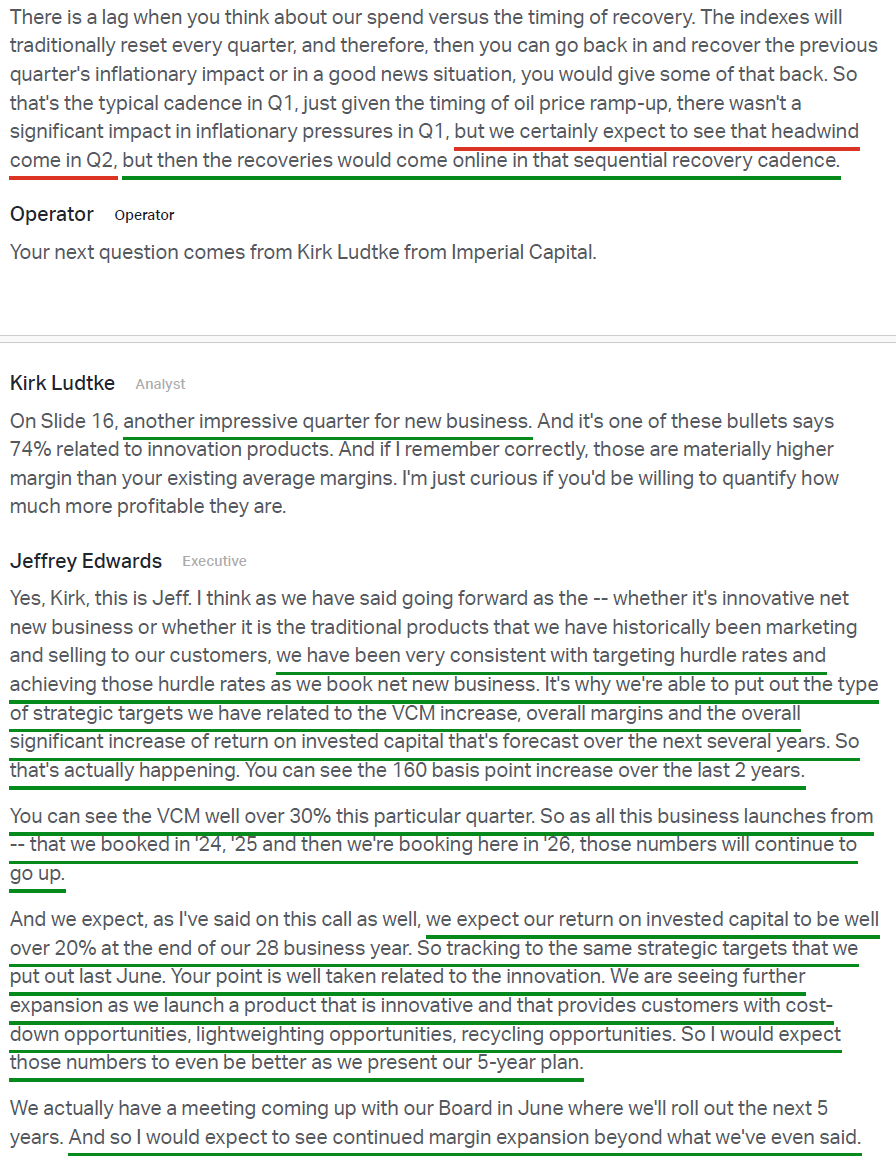
2) Gross profit came in at $82.4M (+6.8% Y/Y), with gross margins expanding 40 bps to 12.0% despite the volume backdrop and the non-recurrence of a one-time royalty payment received in the prior year. This brings the trailing two-year expansion to ~290 bps from Q1 2024’s 9.1% gross margin level, all delivered without any volume tailwind. The expansion was supported by $17M of manufacturing and purchasing lean savings and an additional $2M from prior restructuring initiatives delivered during the quarter. Management expects gross margin expansion to accelerate in 2026 and beyond as new programs ramp with enhanced variable contribution margins (VCM running well over 30% in the quarter), older lower-margin programs run off, and cost optimization initiatives compound.
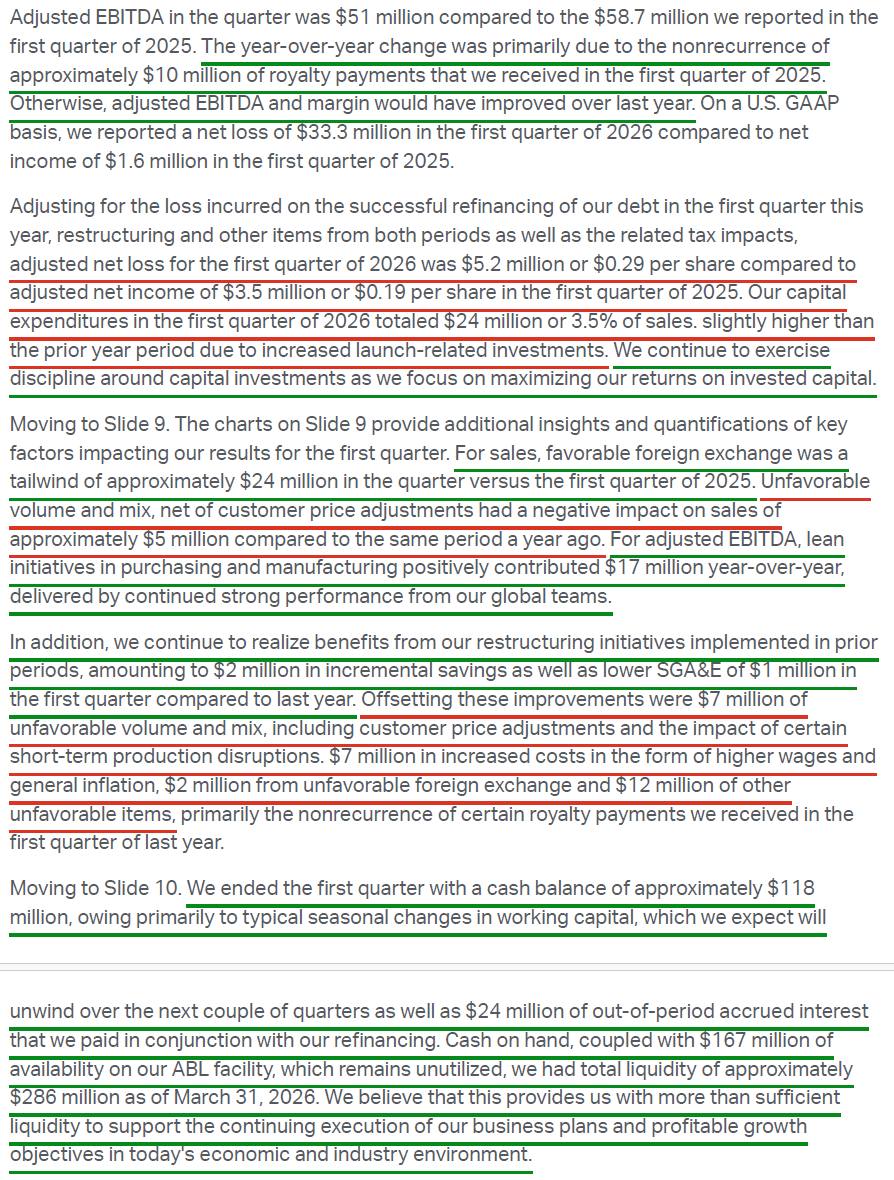
3) Adjusted EBITDA totaled $51.0M (7.4% margins) versus $58.7M (8.8% margins) in the prior year, beating consensus of $48.0M by ~6%. The Y/Y decline was driven by the non-recurrence of ~$10M of royalty payments received in Q1 2025, with management noting that, excluding this one-time item, adjusted EBITDA and margins would have improved over last year. Q1 results exceeded management’s internal plan, positioning CPS to hit or exceed the midpoint of its FY26 adjusted EBITDA guidance of $260M to $300M and reach the all-important double-digit margin target this year.
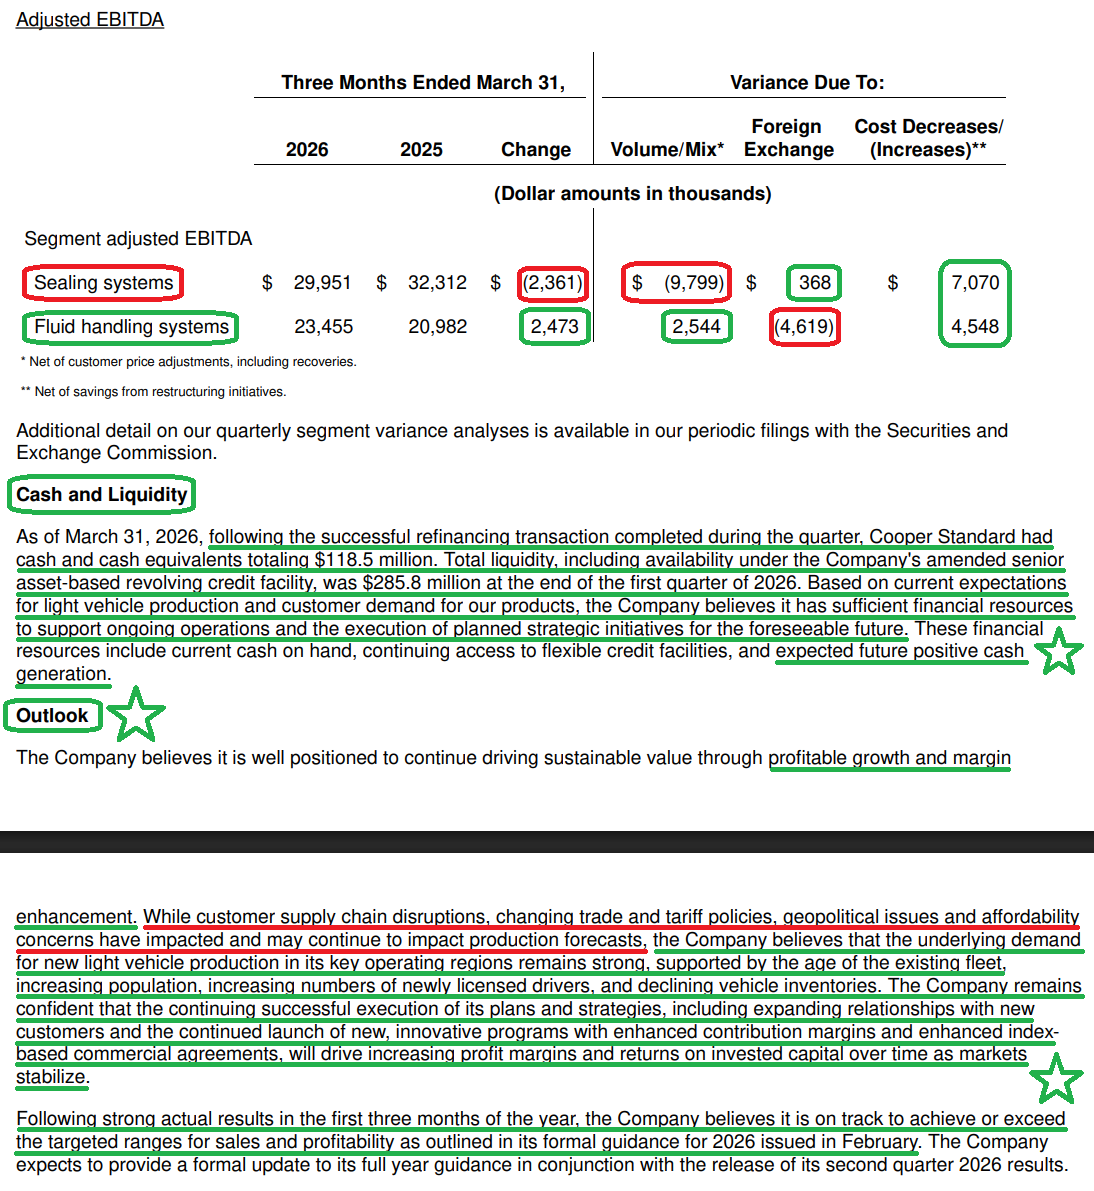
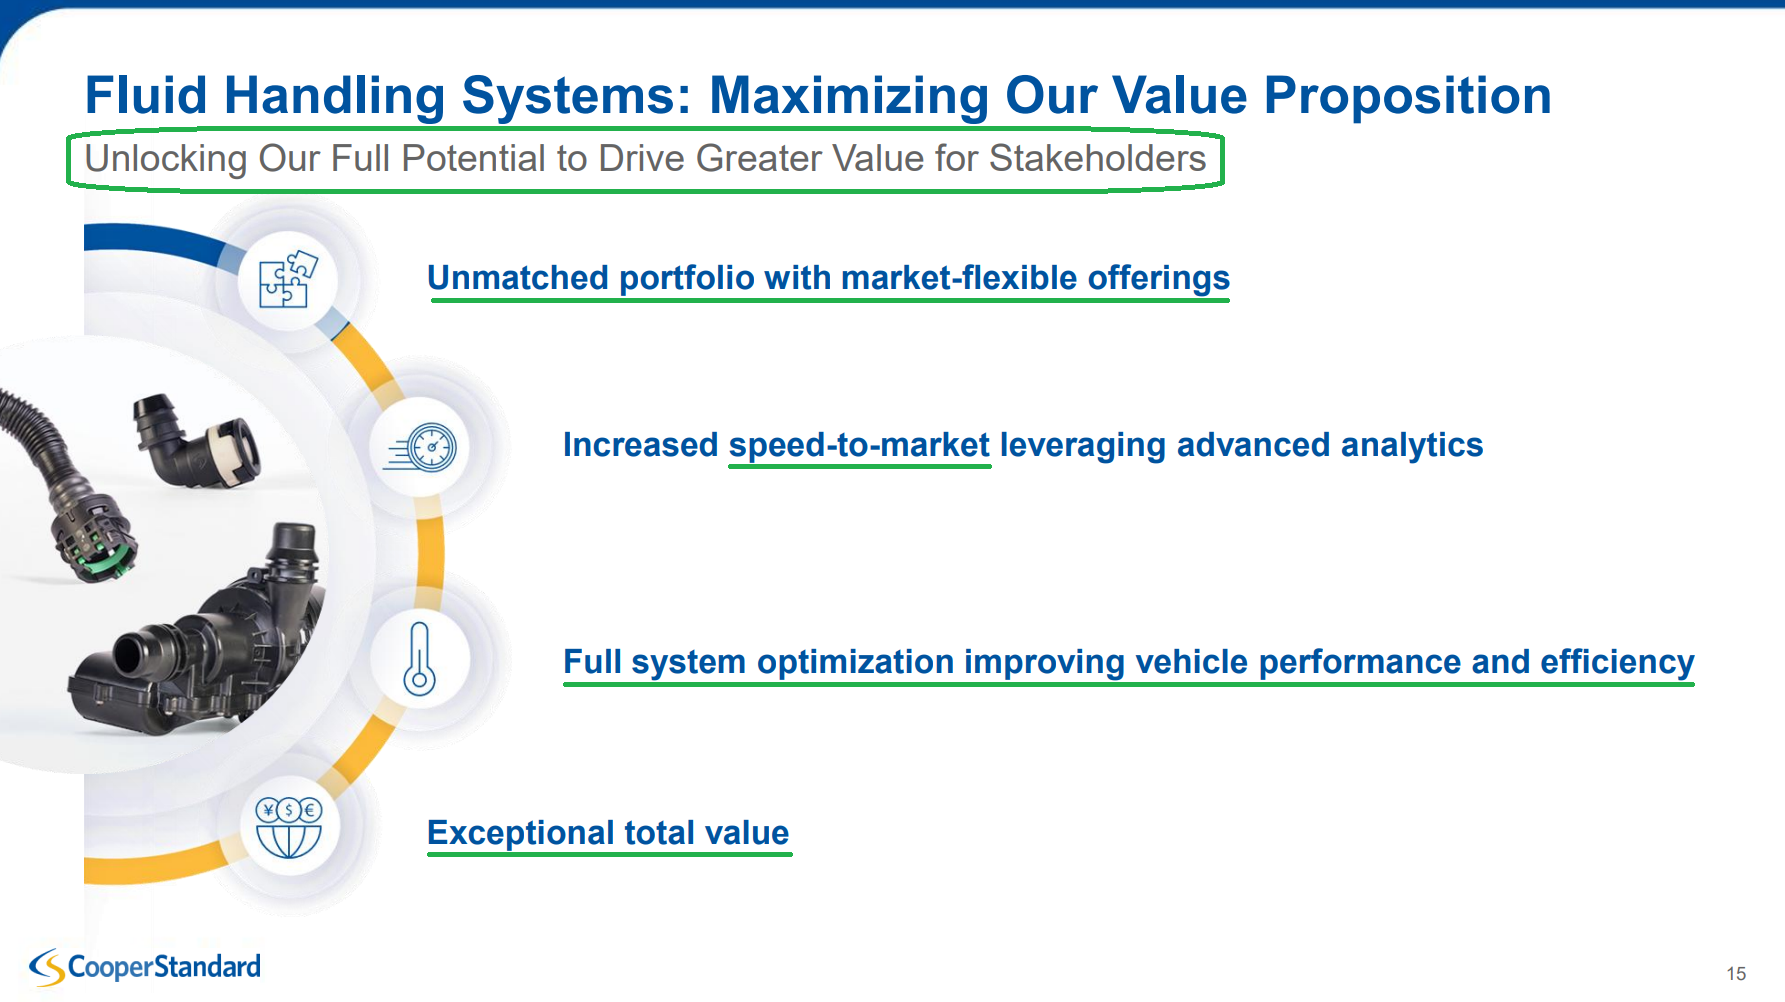
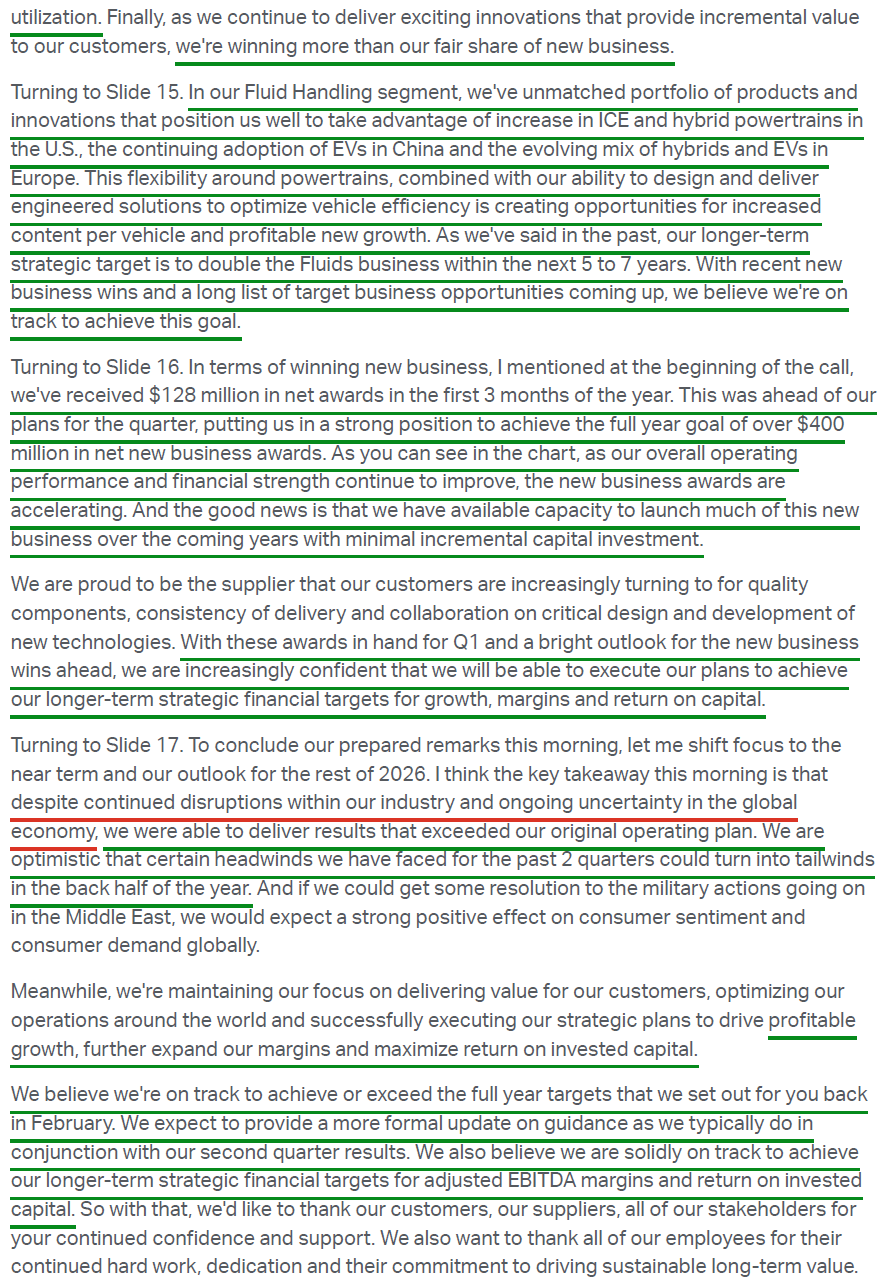
4) Fluid handling systems delivered revenue of $317.9M (+4.6% Y/Y) and adjusted EBITDA of $23.5M (7.4% margins) versus $21.0M (6.9% margins) in the prior year, with both volume/mix and cost actions contributing positively. This is the segment management views as the key unlock for CPS, leveraging its unmatched portfolio to capitalize on the increasing global mix of hybrid powertrains (+80% CPV) and EVs (+20% CPV). Management reiterated the strategic target of doubling the fluid handling business over the next 5 years, supported by a strong book of recent wins and a long pipeline of target opportunities.
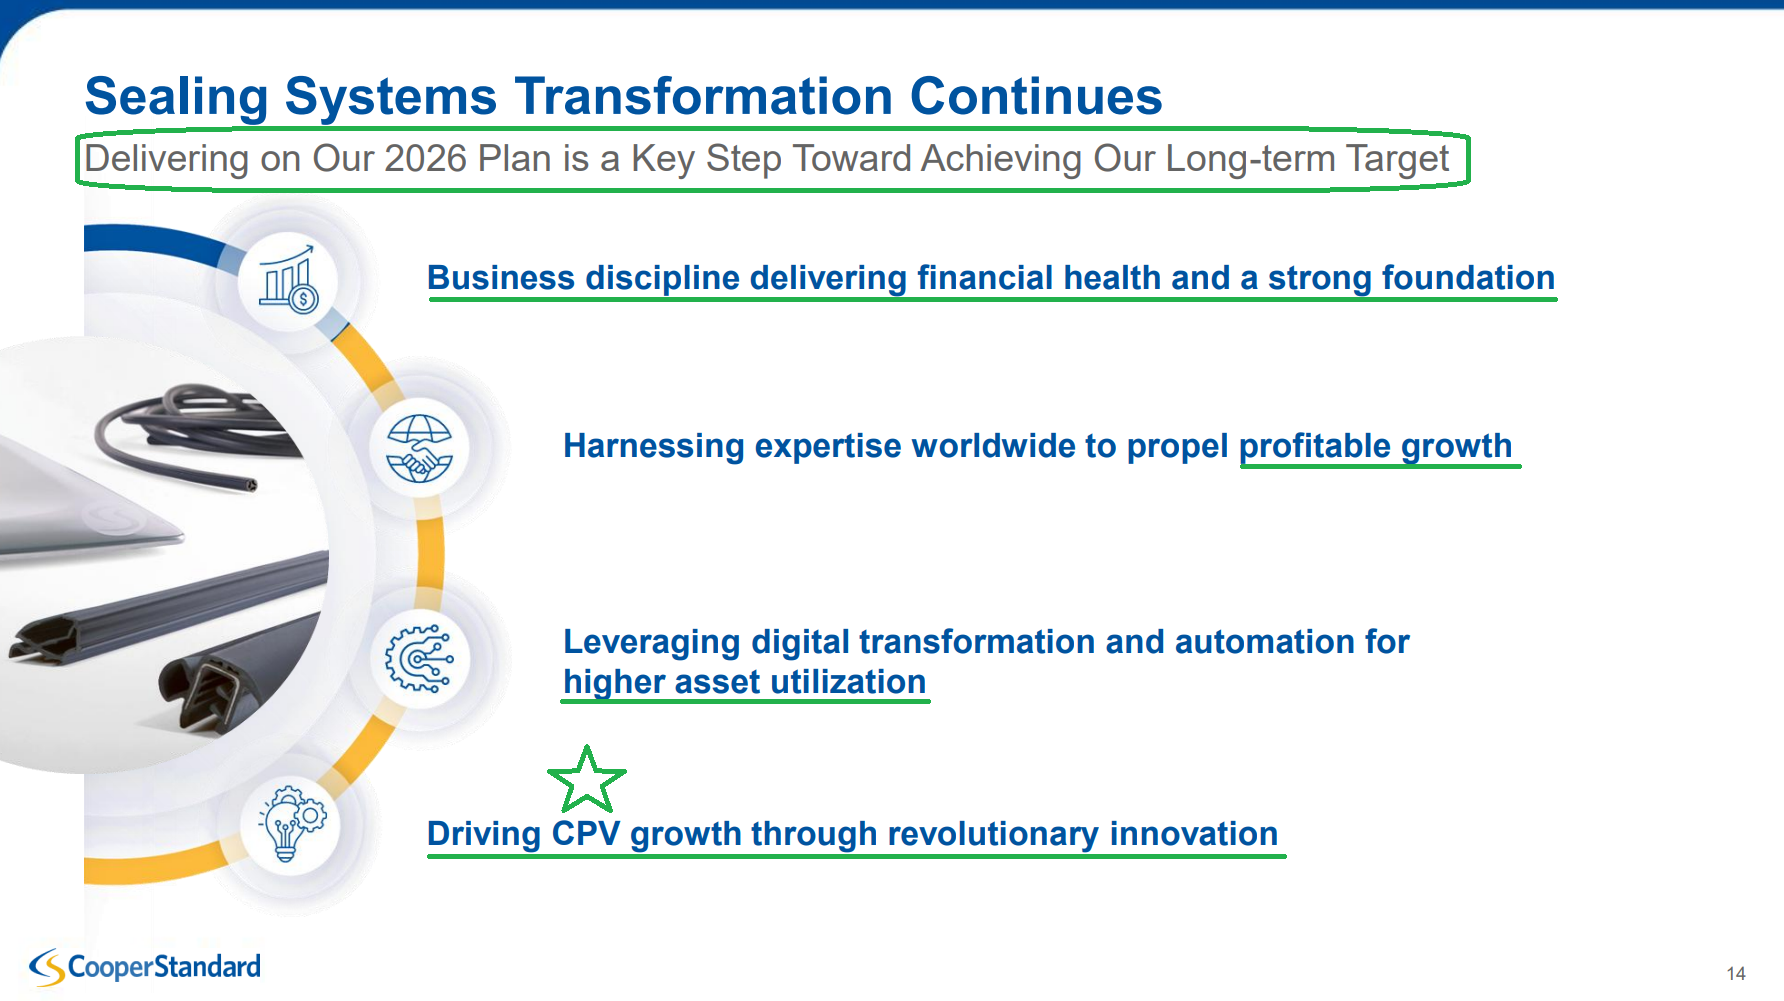
5) Sealing systems delivered revenue of $348.3M (+1.2% Y/Y) and adjusted EBITDA of $30.0M (8.6% margins) versus $32.3M (9.4% margins) in the prior year, with volume/mix serving as the primary headwinds, partially offset by $7M of cost actions. CPS remains the global leader in this segment, and management continues to leverage digital transformation, automation for higher asset utilization, and innovation to drive CPV growth and capture share. The 2030 sealing target of $1.8B+ in revenue and 13%+ adjusted EBITDA margins remains firmly on track.
6) CPS secured $127.9M of net new business awards during Q1, more than doubling the ~$55M won in Q1 2025 and tracking well ahead of plan. The mix breakdown was ~60% fluid handling and 40% sealing, with ~50% North America-based and a large portion tied to Chinese OEMs. Of the $127.9M, $31.8M was tied to battery electric or full hybrid platforms. Q1 alone annualizes to over $512M, putting CPS firmly on track to exceed the FY26 target of $400M+ (+34% Y/Y vs. FY25’s record $297.9M). Most importantly, 85% to 95% of the business that will launch in 2027 and 2028 is already booked, providing strong visibility into the forward margin trajectory.
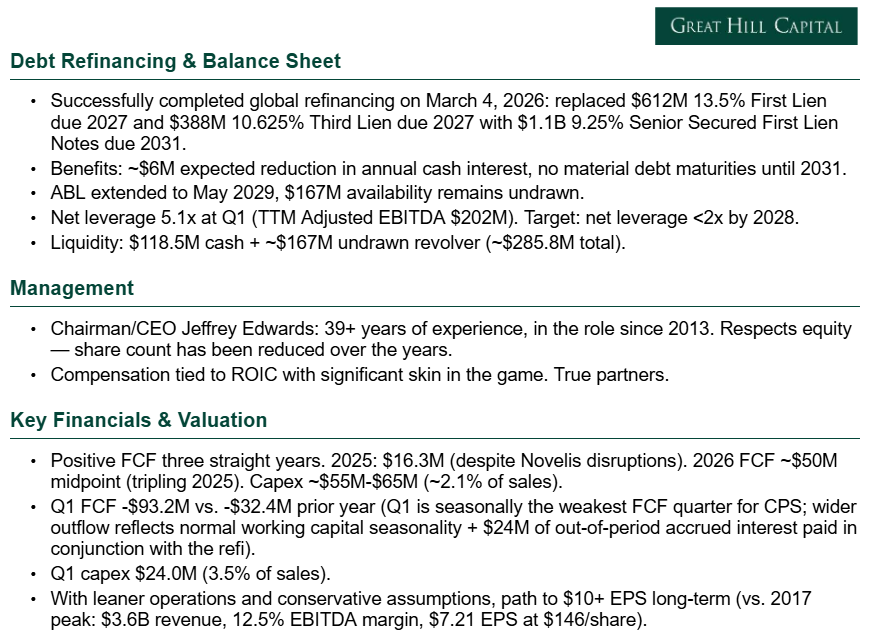
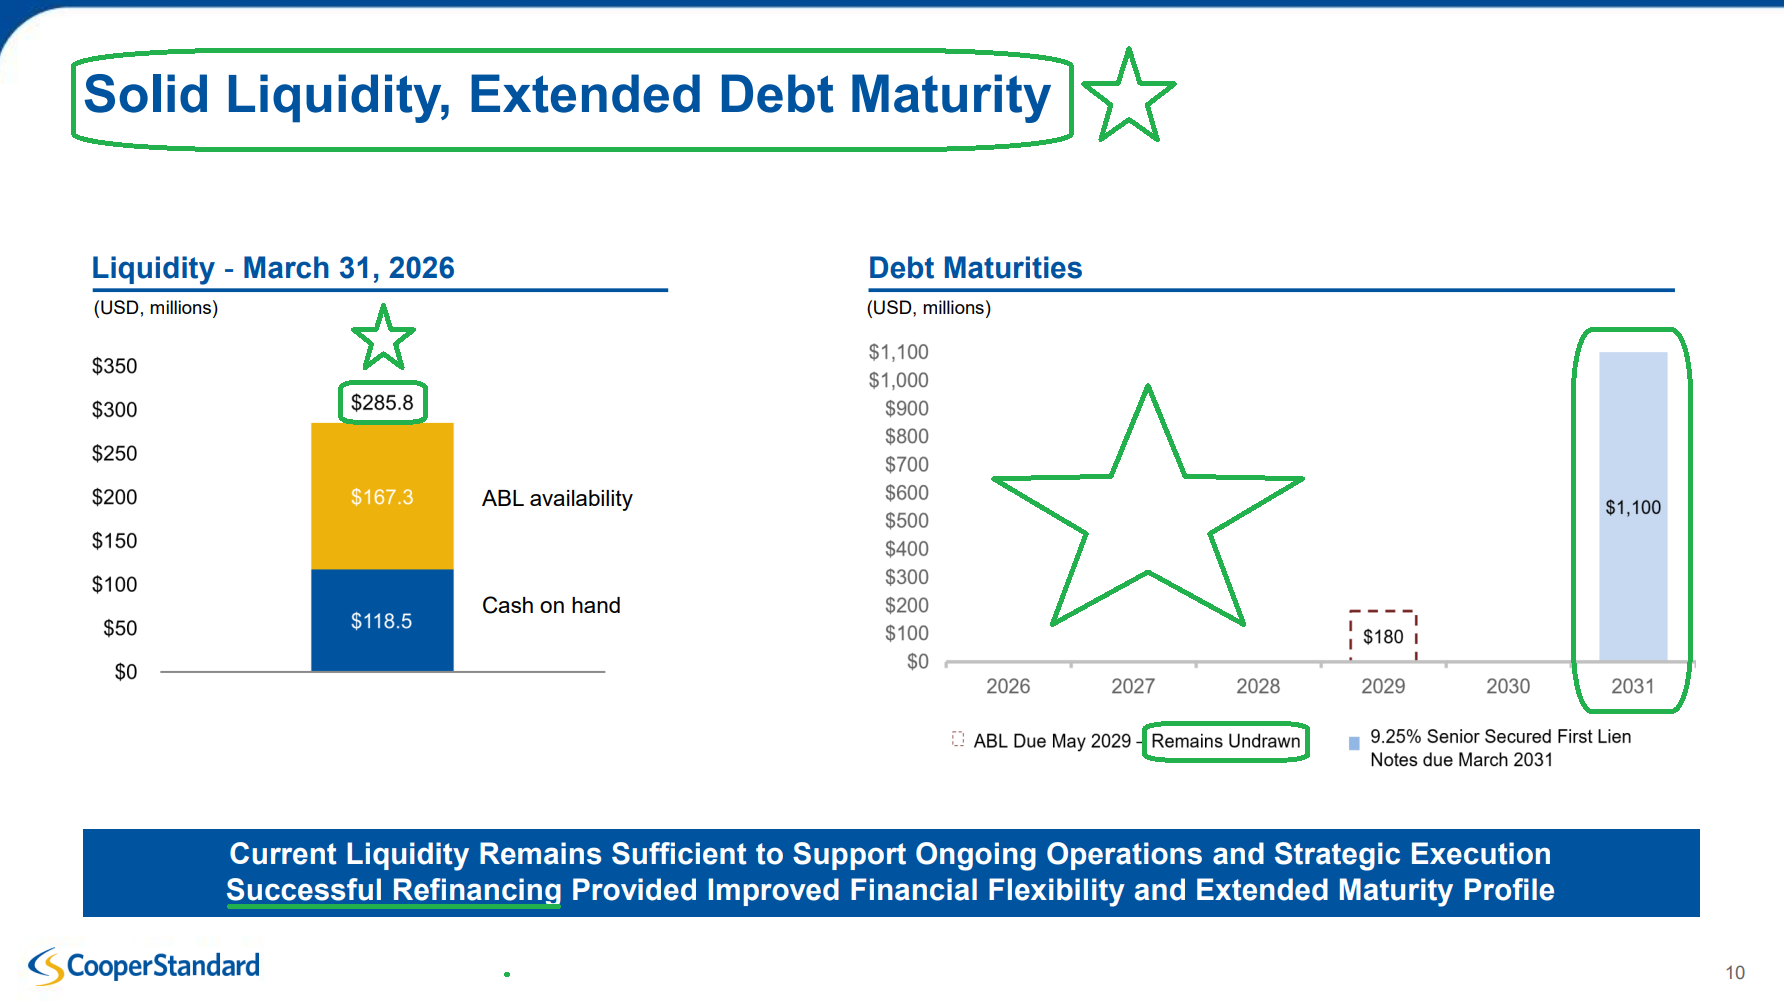
7) On March 4, 2026, CPS successfully completed a global refinancing, replacing the $612M 13.5% first lien notes and $388M 10.625% third lien notes (both maturing in 2027) with $1.1B of 9.25% senior secured first lien notes due 2031. The transaction eliminates all material near-term debt maturities until 2031 and reduces this year’s expected cash interest expense by ~$6M. Cash on hand at quarter-end totaled $118.5M, with total liquidity of $285.8M, including the undrawn $167M ABL (extended to May 2029 as part of the refi).
8) Free cash flow during Q1 was an outflow of $93.2M, compared to an outflow of $32.4M in the prior year period. The outflow reflects normal Q1 working capital seasonality (which consistently unwinds in the back half) and an additional $24M of out-of-period accrued interest paid in conjunction with the refi. Management remains confident in delivering a fourth consecutive year of positive free cash flow in FY26.
9) Capex during the quarter totaled $24.0M (3.5% of sales), modestly higher than the prior year due to increased launch-related investments. Management reiterated FY26 capex guidance of $55M to $65M (~2.1% of net sales at the midpoint), continuing to operate lean compared to the bloated 5% to 6% of sales averages, with the focus firmly on tripling ROIC and delivering 20%+ ROIC by the end of FY28.
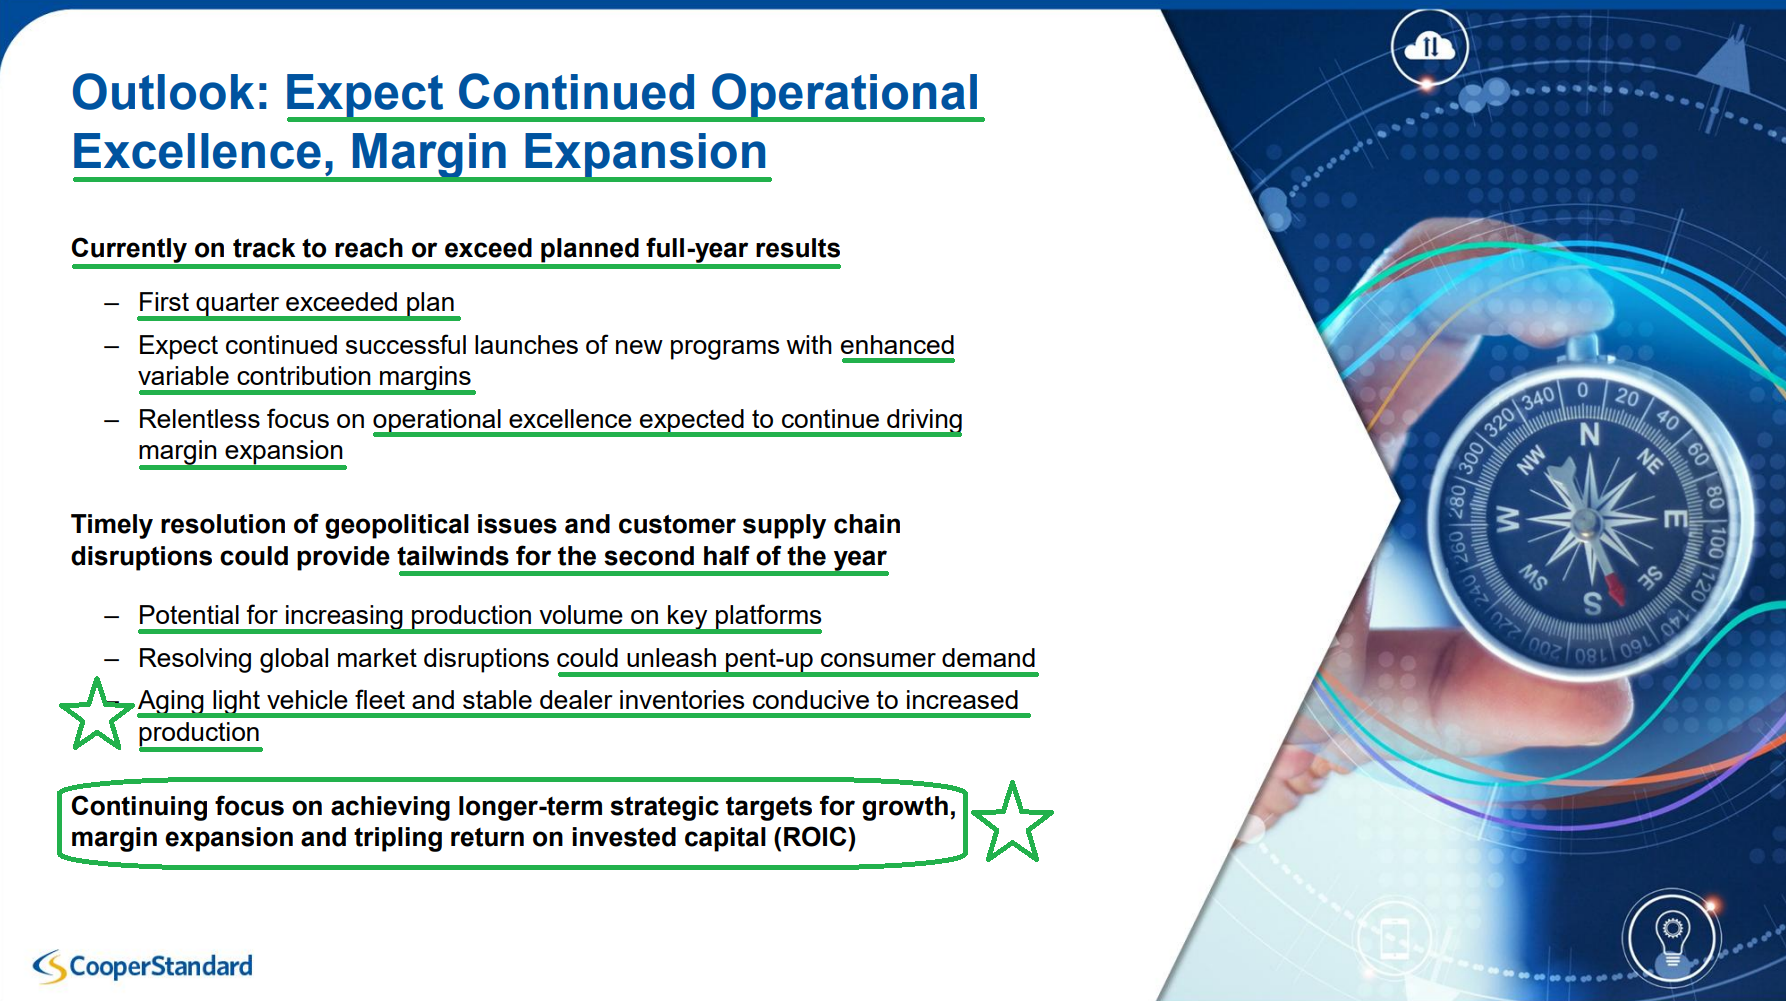
10) Management reiterated FY26 guidance of $2.7B to $2.9B in net sales and $260M to $300M in adjusted EBITDA, noting the company is on track to achieve or exceed these targets following Q1 outperformance, with a formal guidance update expected alongside Q2 results in August. The company remains well-positioned on tariffs and input cost pressure, with over 70% of exposure covered by contractual indexes with customers and the remainder negotiated on a rolling basis. Management noted that the headwinds of the past two quarters could turn into tailwinds in the back half of the year if geopolitical tensions ease, with underlying demand for new light vehicle production in key operating regions remaining strong, supported by the aging fleet, growing population, expanding licensed driver base, and declining vehicle inventories.
Earnings Call Highlights
Advance Auto Parts (AAP) Update
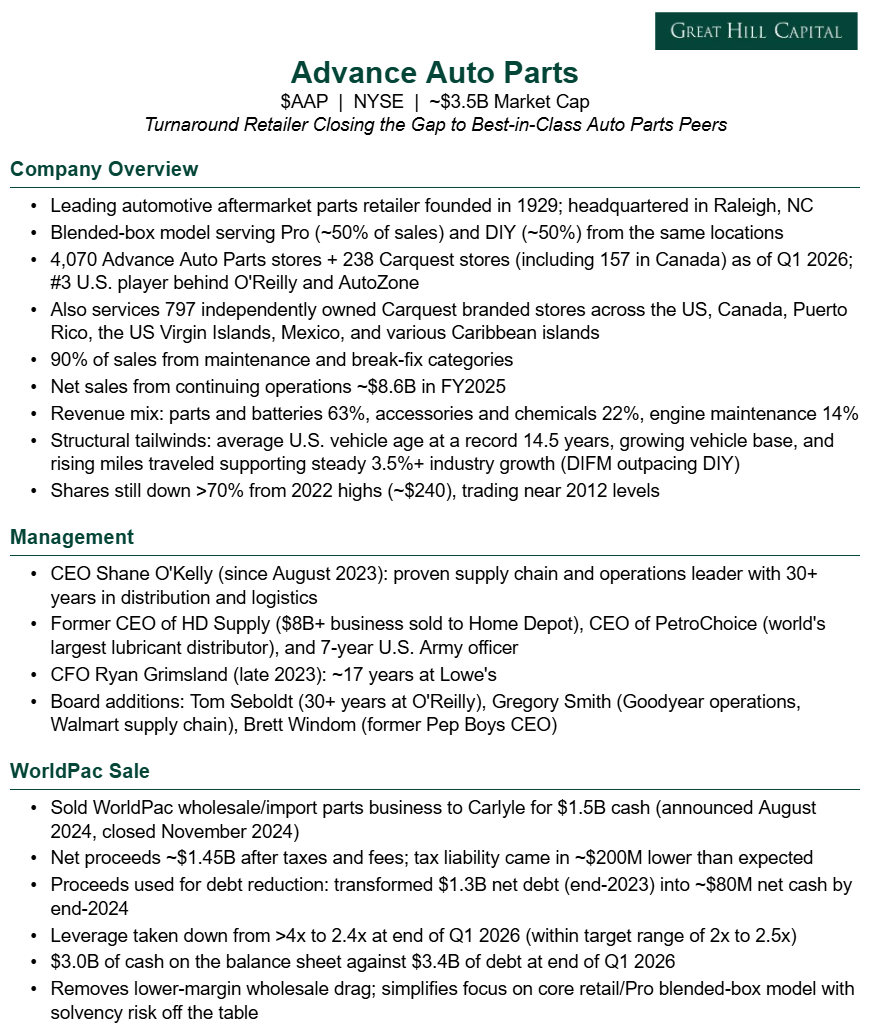
For newer readers, here’s a quick overview of the key drivers behind our thesis on Advance Auto Parts, the long-neglected auto parts retailer undergoing a back-to-basics turnaround with substantial margin recovery still ahead:
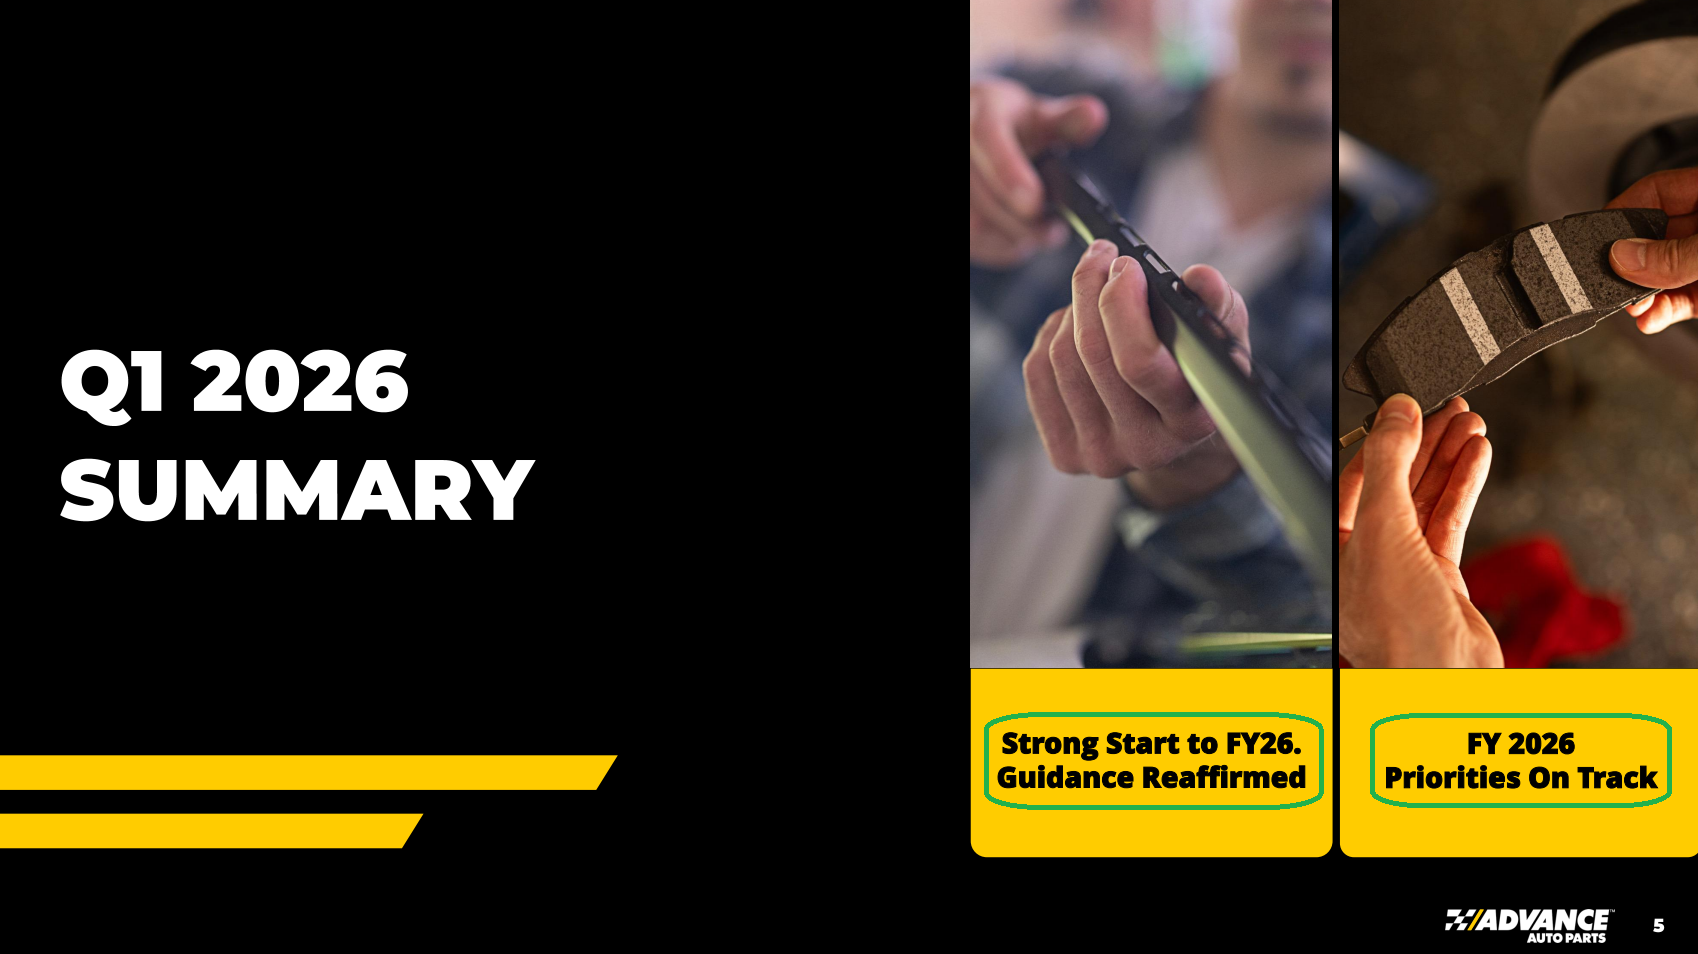
Right part, right place, right time. That is finally what AAP is delivering.
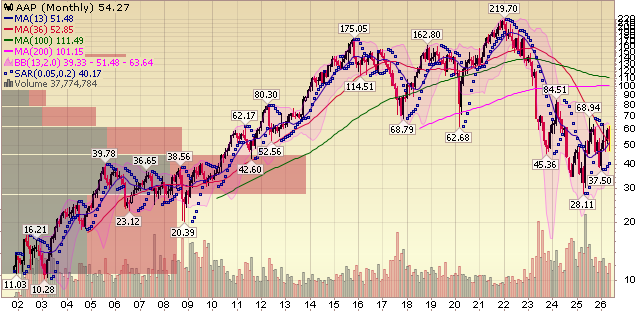
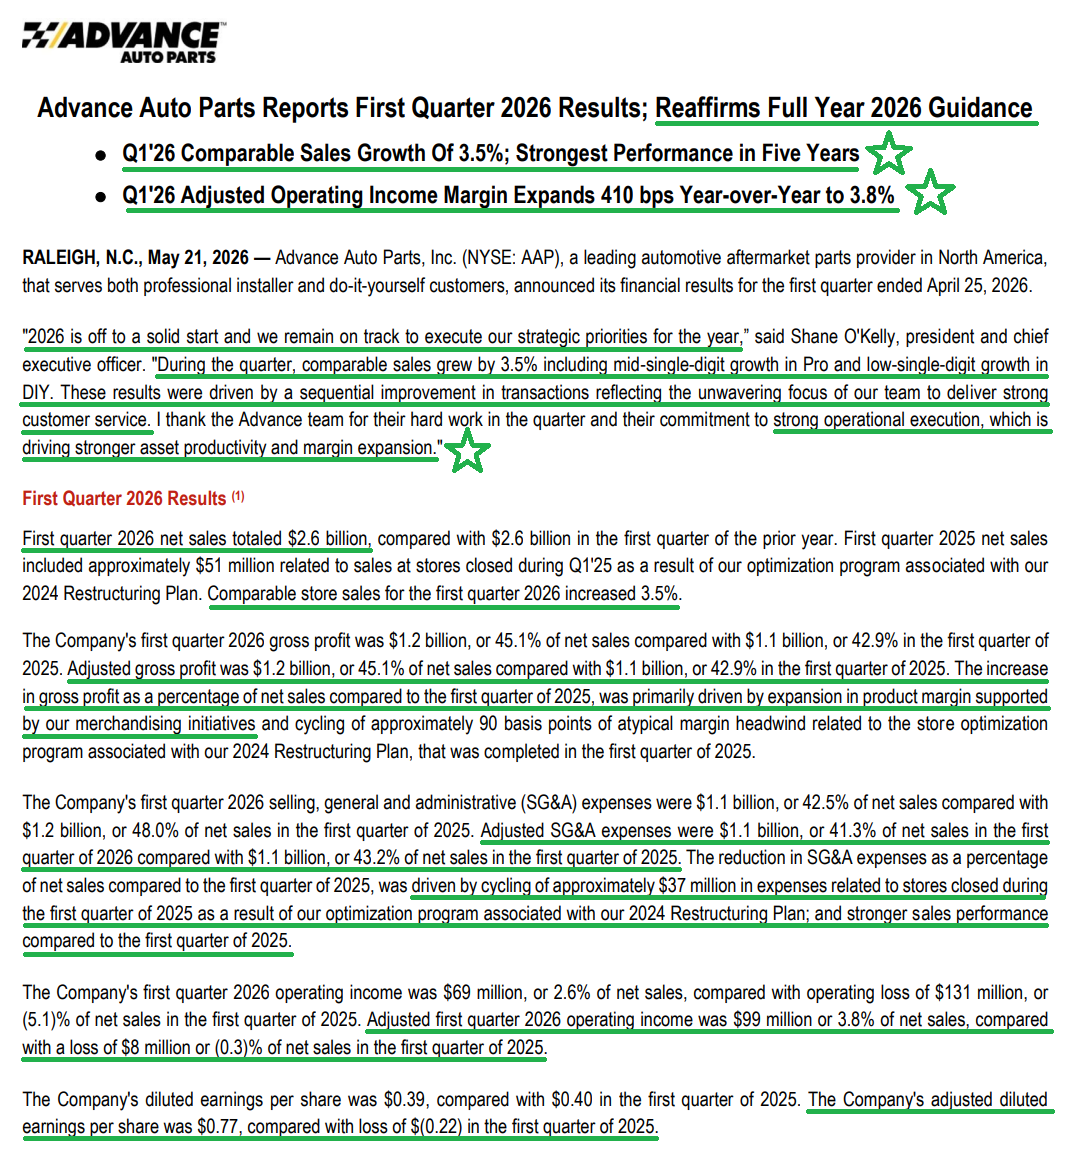
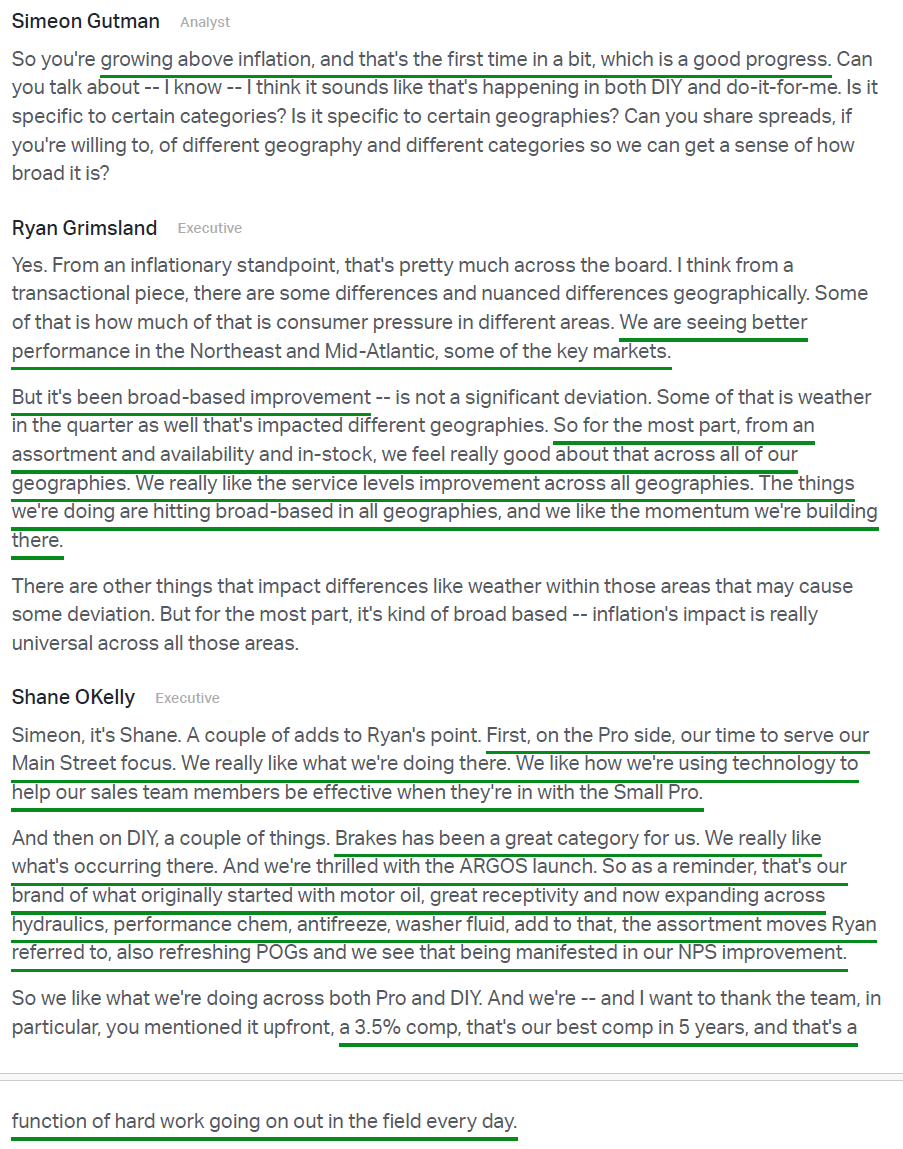
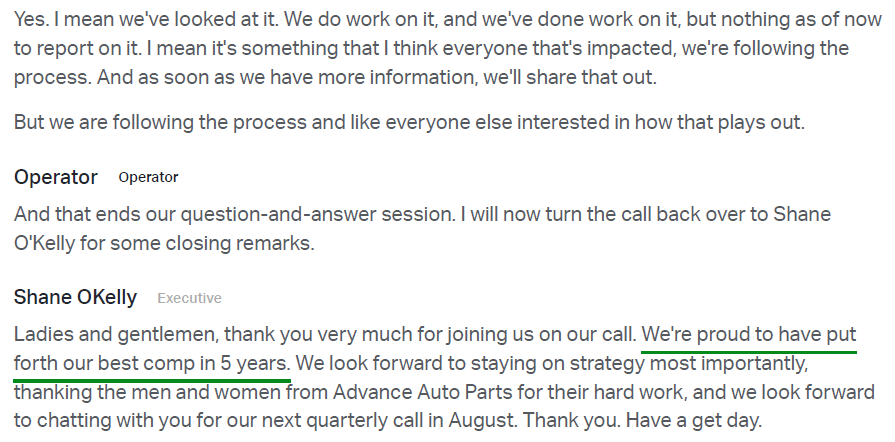
Advance Auto Parts shot the lights out in Q1, posting its strongest comp sales growth in five years at +3.5% while expanding adjusted operating margins 410 bps Y/Y to 3.8%. The print was a welcome surprise that bucked the prevailing consumer doom-and-gloom narrative, sending shares as much as 20% higher following the release. Shares have now nearly doubled from the lows reached when the business was priced for death, as the market slowly comes around to the reality that the operational overhaul under CEO Shane O’Kelly is translating into tangible results.
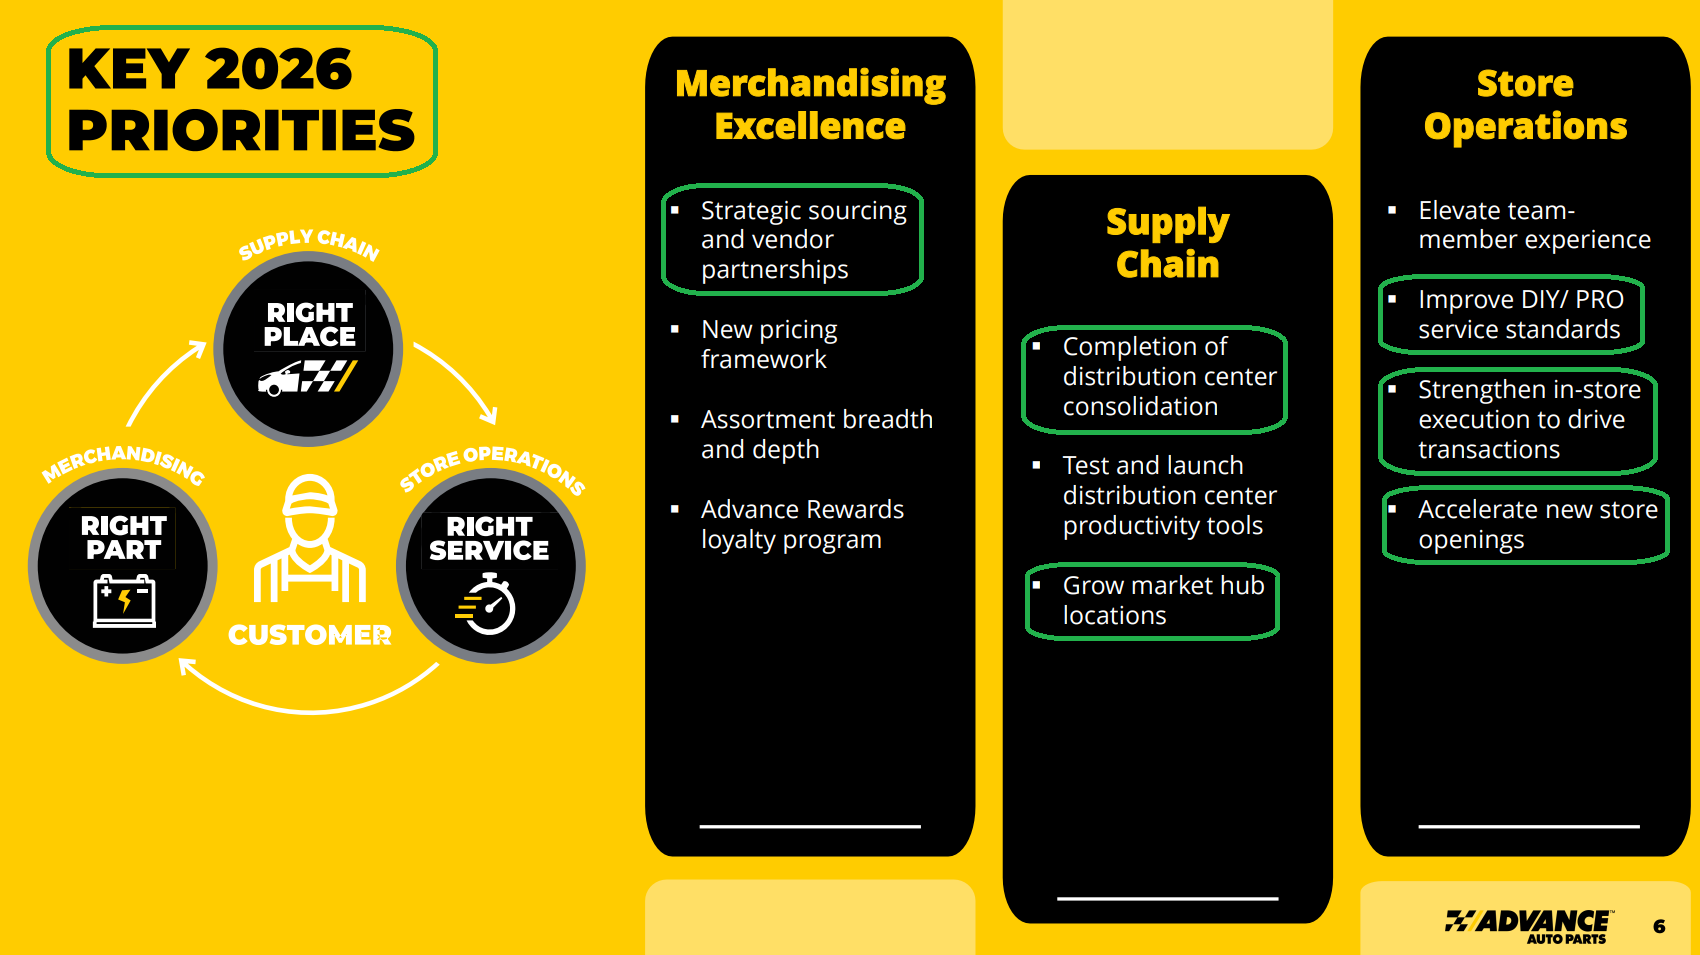
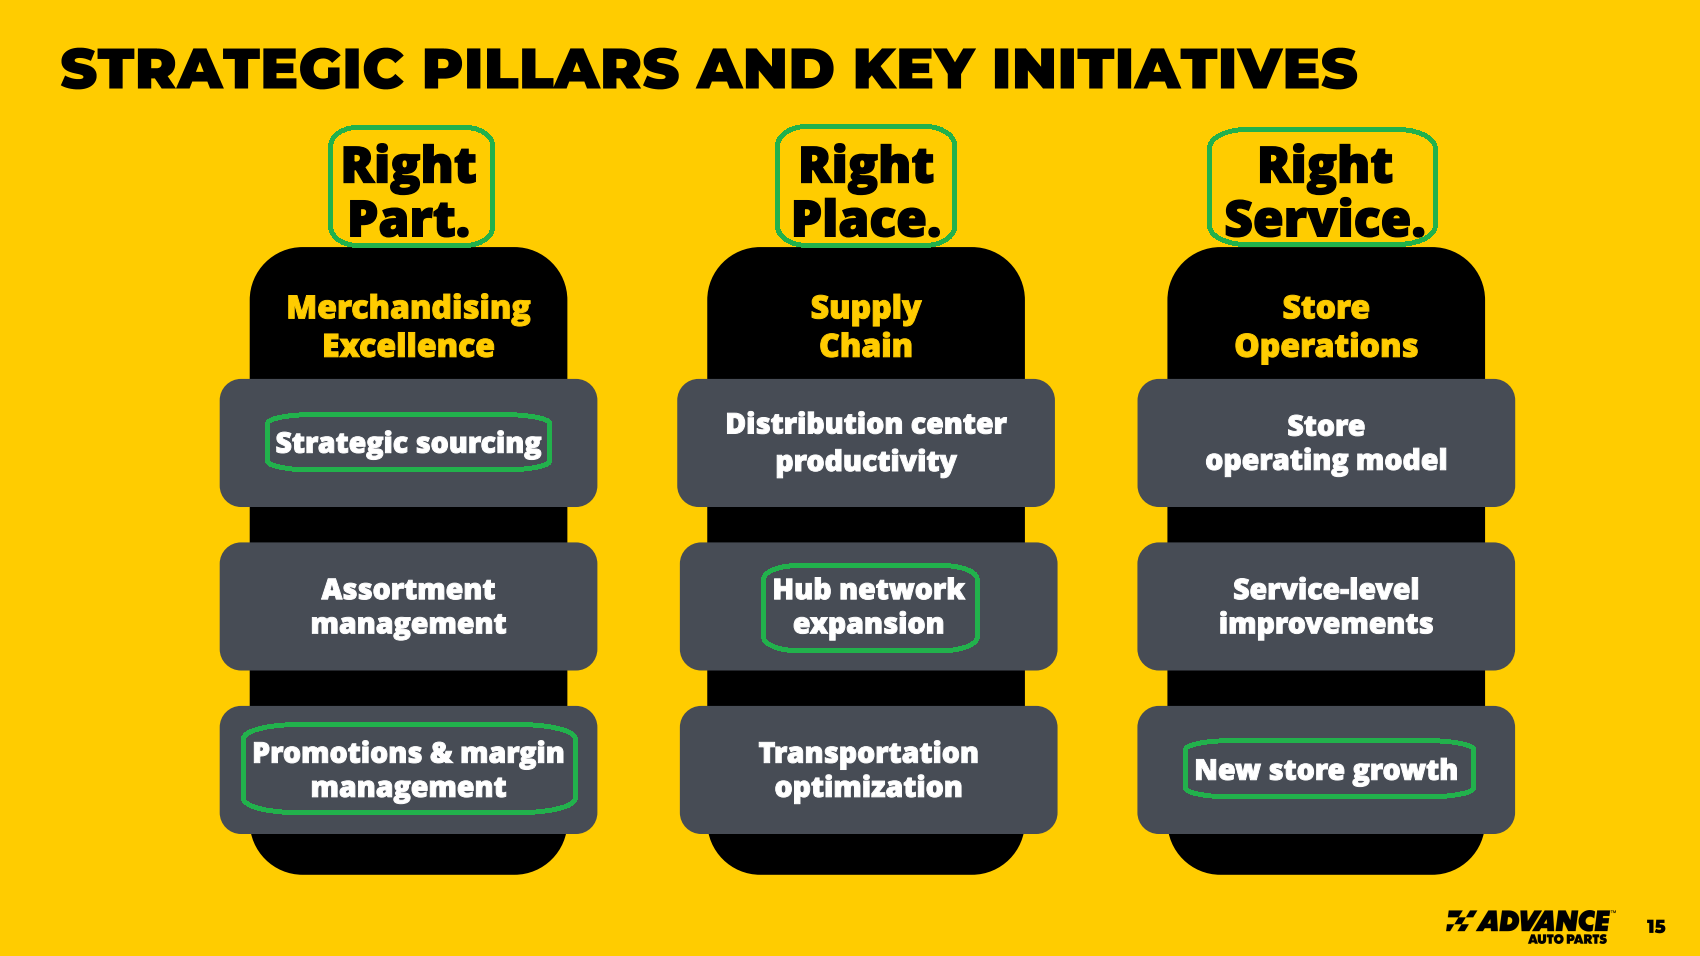
The simple truth is that AAP was neglected for so long that the fixes didn’t require reinventing the wheel, but rather disciplined execution and a return to basics. For an auto parts retailer, that means having the right part in the right place at the right time. After years of operating with an inefficient supply chain that routinely failed to accomplish that fundamental objective, O’Kelly and team ripped off the Band Aid and got to work.
AAP has reduced its bloated distribution network by more than half to just 16 DCs, adopted the hub-and-spoke model used by best-in-class peers O’Reilly (ORLY) and AutoZone (AZO), expanded SKU assortment to more than 100K products, and tightened in-store operations with employees behind the counter who actually know auto parts. These long overdue changes are beginning to deliver exactly the kind of results one would expect: parts availability has improved from the low-90% range to the high-90% range, Pro delivery times have fallen to under 40 minutes, and AAP is finally moving up the call sheet for customers in need of parts.
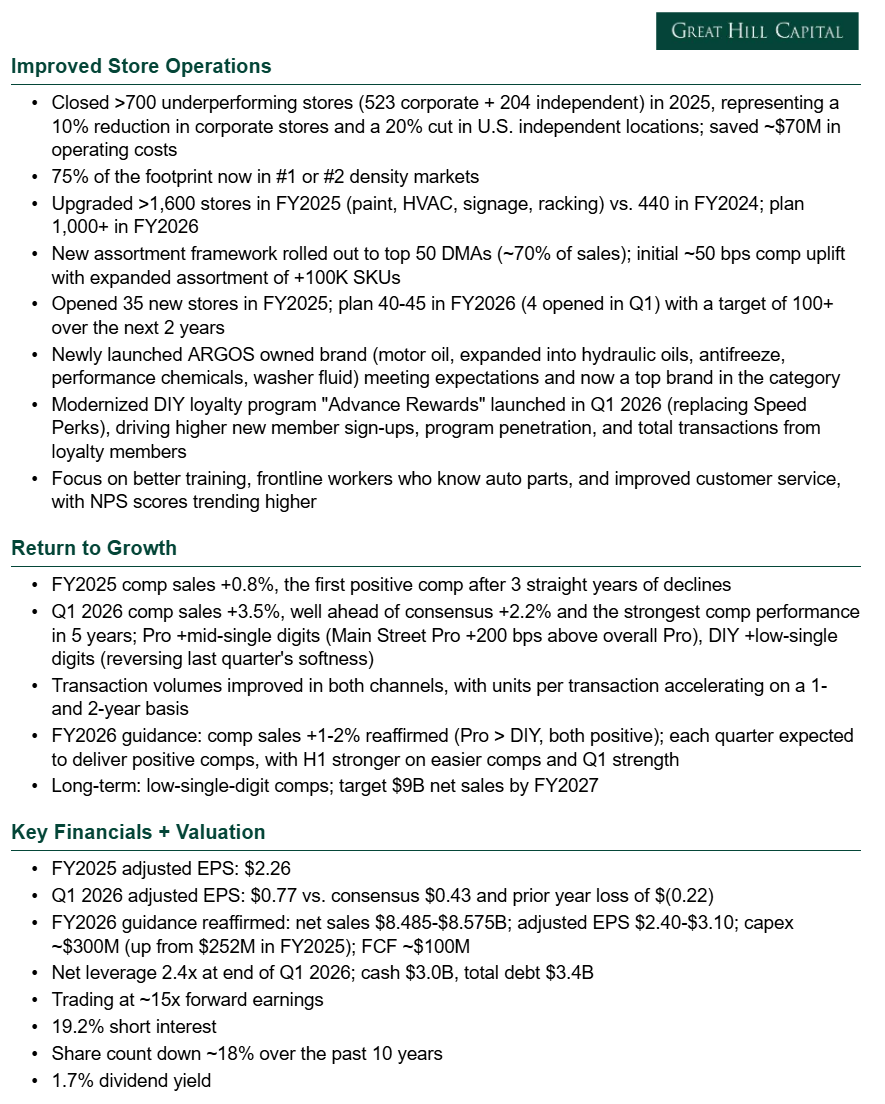
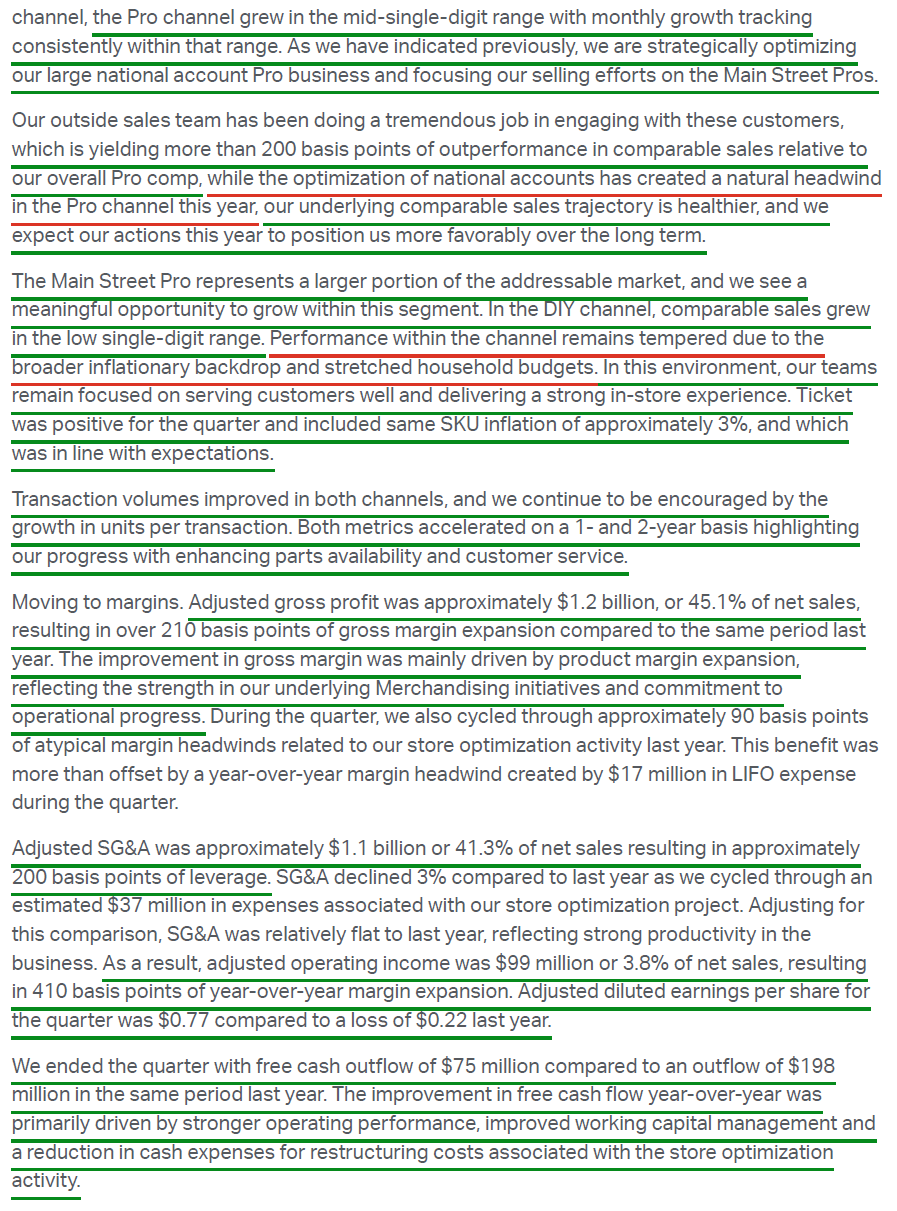
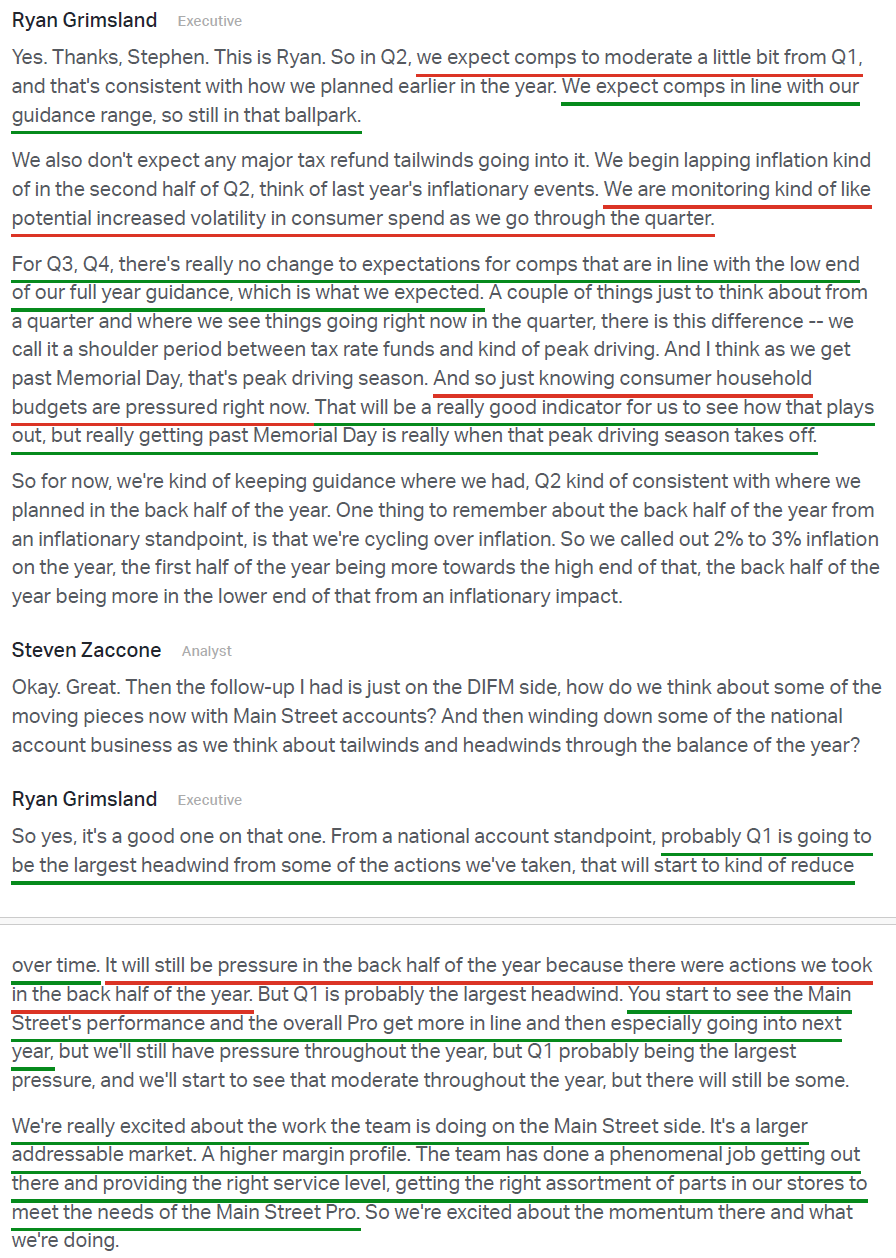
Those operational improvements were the key driver behind both DIY and Pro channels posting accelerating transactions and units per transaction in Q1, with DIY returning to low-single-digit growth and Pro delivering mid-single-digit growth. More importantly, the Main Street Pro segment, AAP’s #1 focus as it pivots away from lower-margin national accounts, outperformed the broader Pro business by more than 200 bps.
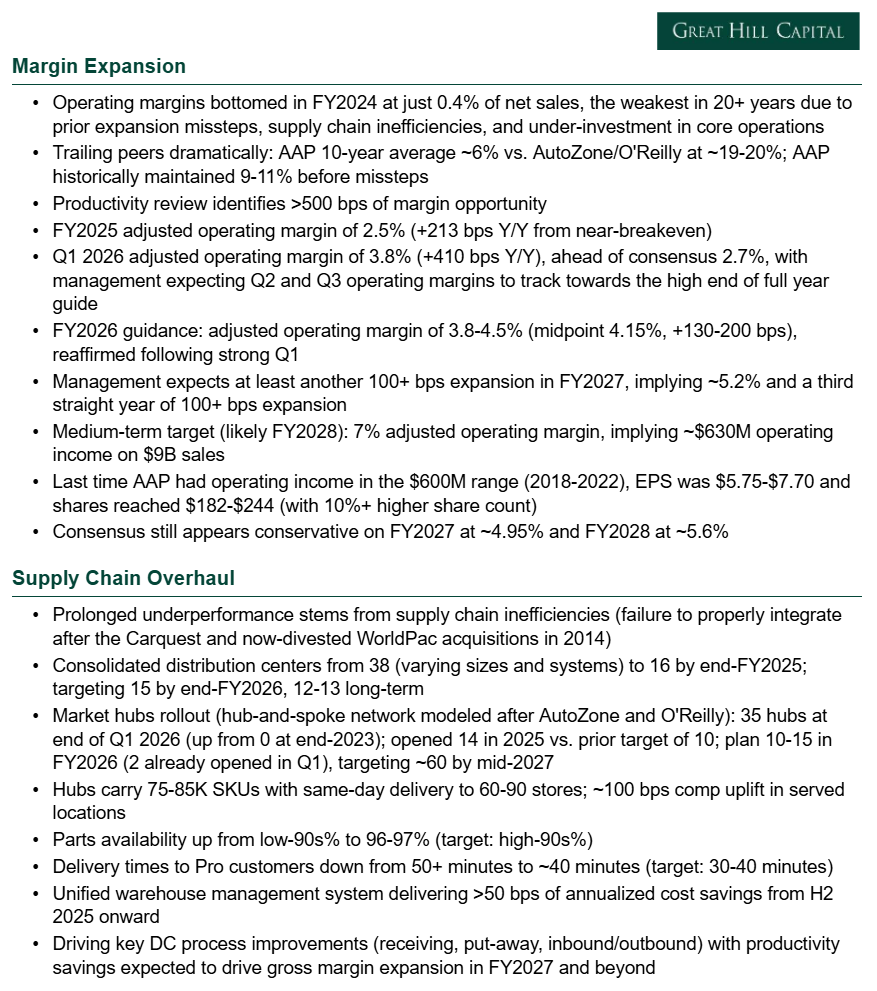
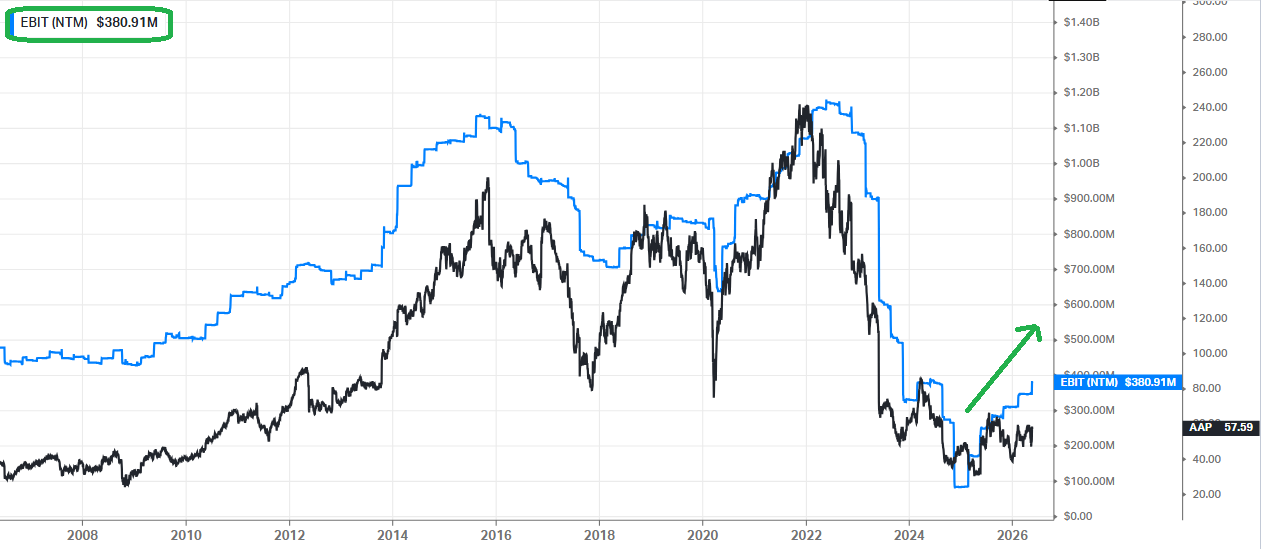
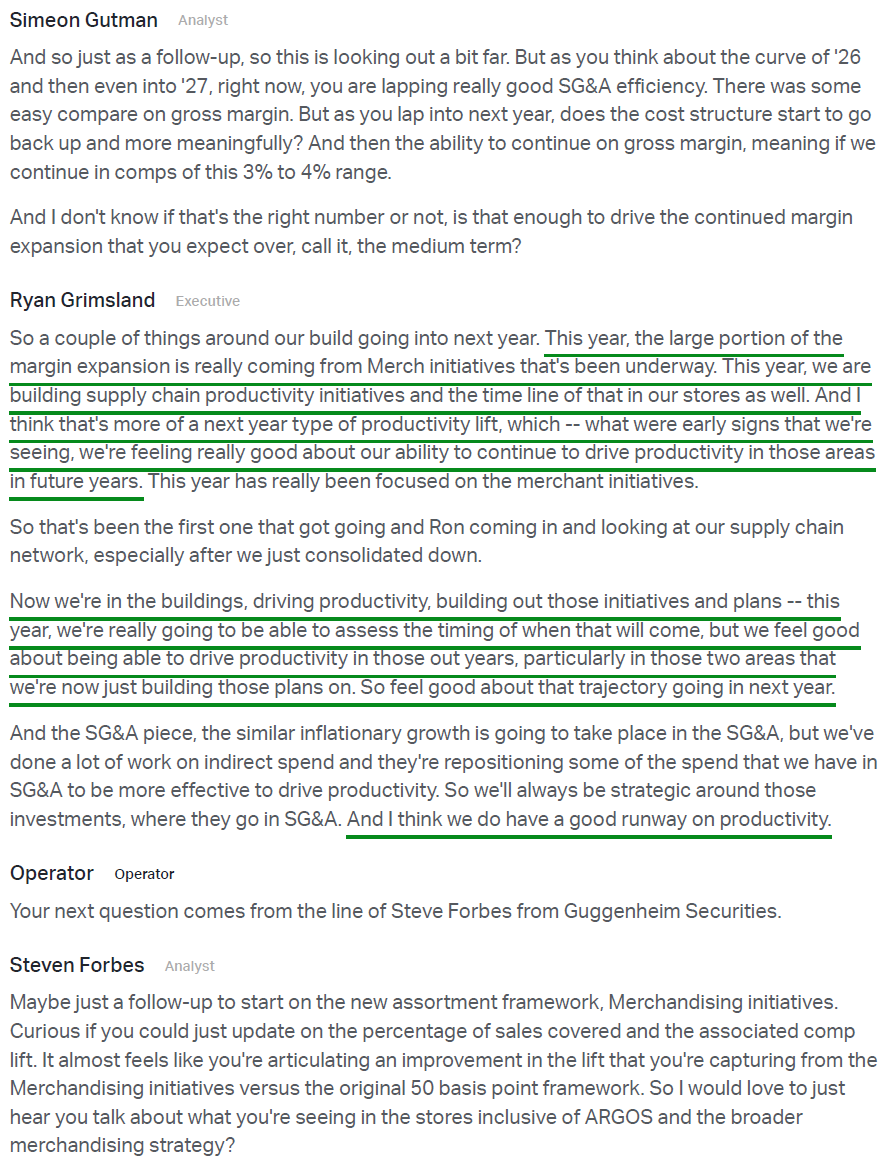
These improvements are also supporting an operating margin recovery that is only beginning to come off the mat. After bottoming at trough levels of just 0.4% in FY2024, the weakest in more than 20 years, the #1 metric in the AAP turnaround still has plenty of runway ahead as margins work their way back toward the company’s historical high single digit range.
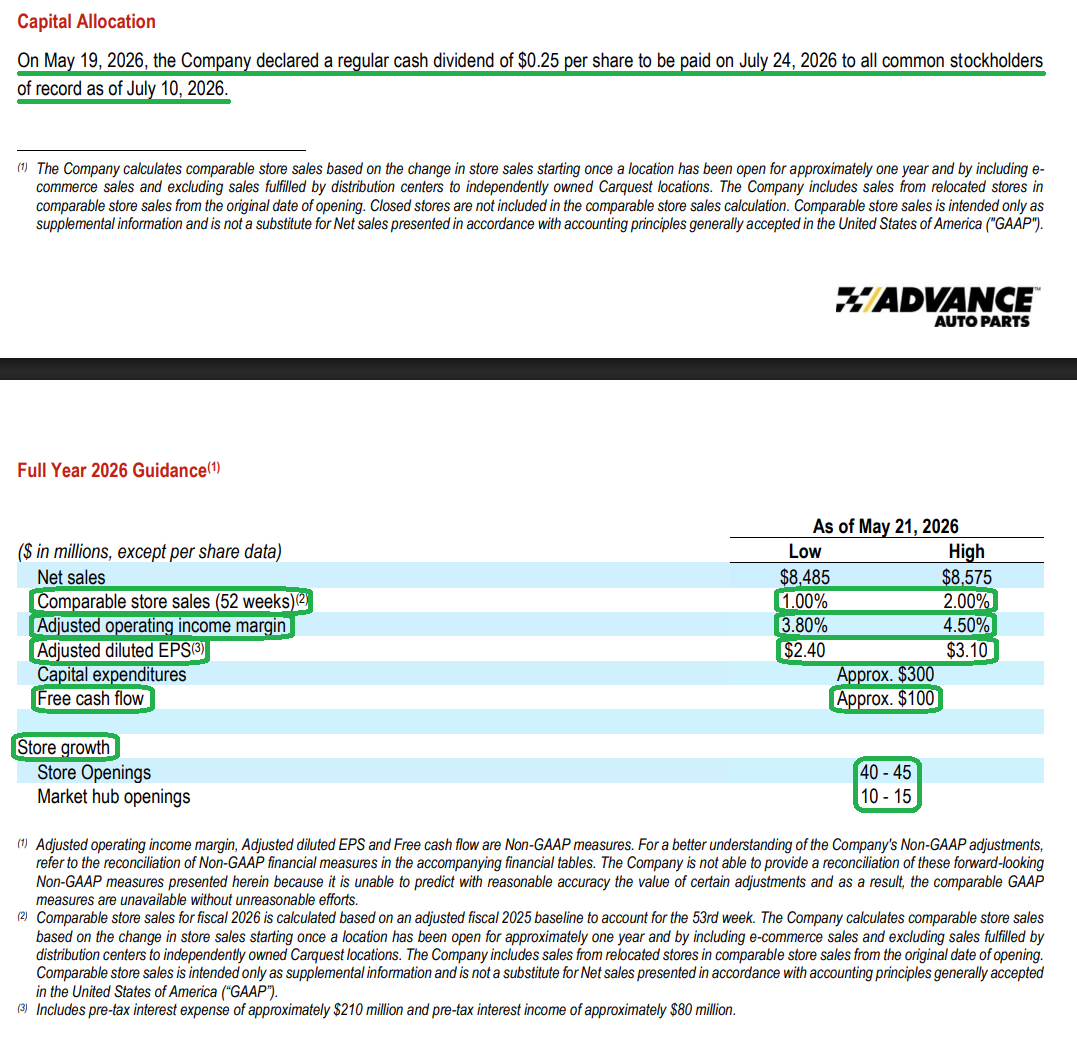
Management continues to expect full-year operating margins in the 3.8% to 4.5% range, with the midpoint implying +165 bps Y/Y expansion. With at least another ~100 bps of improvement expected in FY27 (~5.2% at the midpoint), AAP is on track to reach its medium-term 7% target by what increasingly looks to be FY28, a very manageable hurdle that still leaves it well below the high teens+ operating margins consistently generated by best-in-class peers.
But as we like to say, the key to happiness is low expectations, and the implications of even a return to high single digit operating margins are massive. On ~$9B in revenue, 7% operating margins would translate to ~$630M in operating income, a level that historically supported well over $6/share in earnings power and a stock trading north of $150 at the low end.
After multiple false starts in what the market has long viewed as a never-ending turnaround, consensus remains largely on the sidelines in show-me mode, sitting at ~5% operating margins for FY27 and ~5.6% for FY28. We are more than happy taking the other side of that skepticism, with the supply chain, merchandising, and executional overhaul under O’Kelly being exactly the medicine the doctor ordered.
For a closer “under the hood” look at the turnaround strategy being executed and why the numbers are just beginning to inflect, the recent interview below with Shane O’Kelly is well worth a listen:
Q1 Earnings Breakdown
10 Key Points
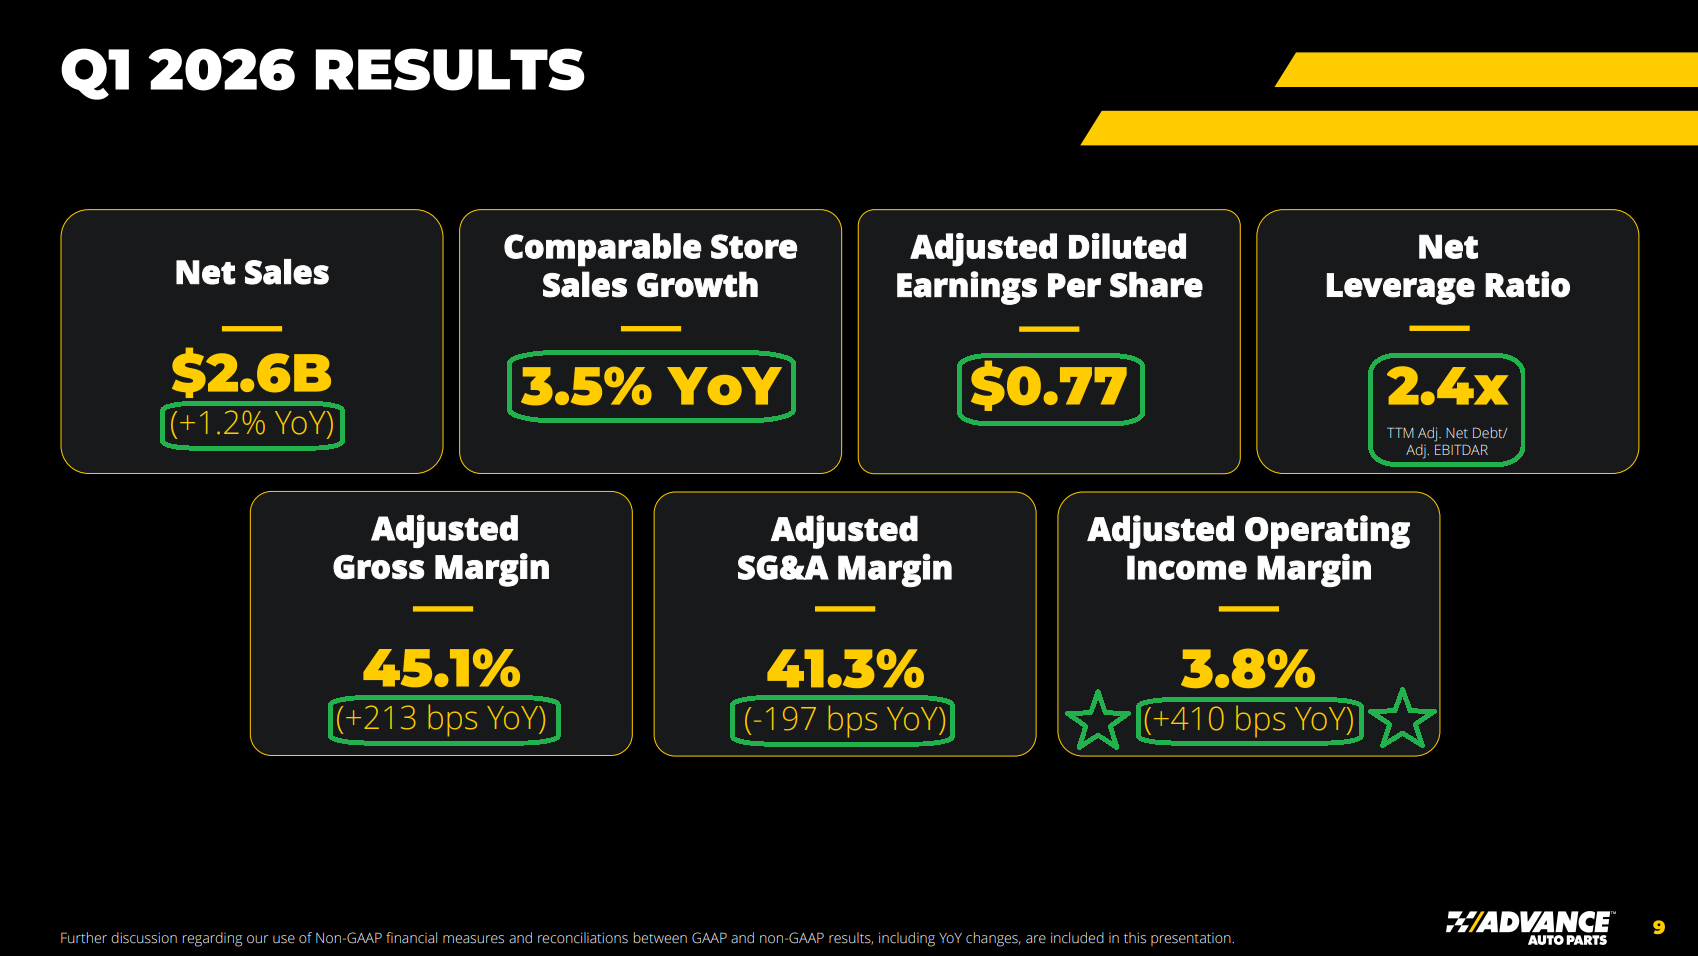
1) AAP delivered $2.61B in revenue (+1.2% Y/Y), beating consensus by ~$40M, with underlying growth partially offset by a ~2 point headwind from cycling $51M of liquidation sales tied to last year’s store optimization program. Adjusted diluted EPS of $0.77 beat the $0.43 consensus estimate by ~66% and compares to a loss of $(0.22) in the same period last year.
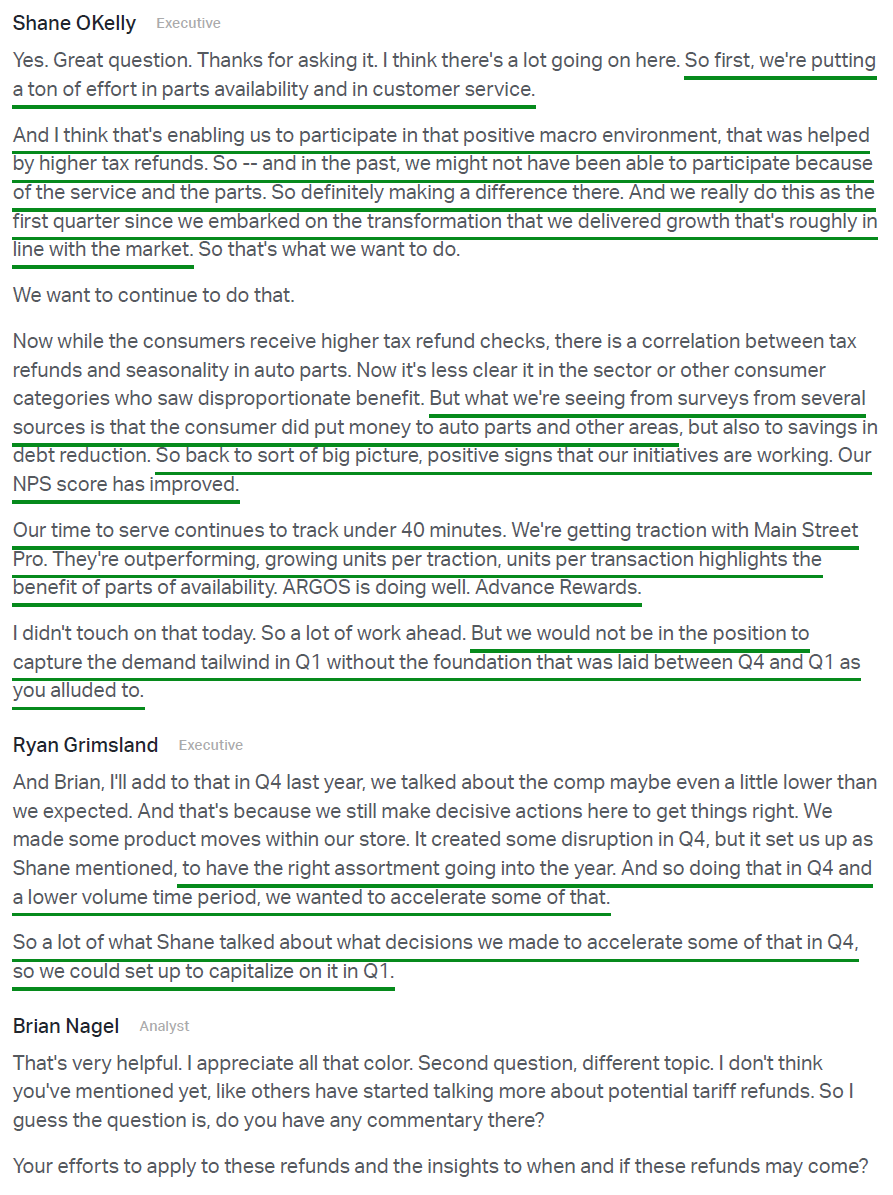
2) Comp sales grew 3.5% in Q1, well ahead of the 2.2% consensus estimate and marking the strongest quarterly comp performance in 5 years. Both channels contributed, with Pro up mid-single digits and DIY reversing last quarter’s softness to deliver low single digit growth. Transaction volumes improved in both channels, while units per transaction accelerated on both a 1- and 2-year basis, driven by the benefits of better parts availability and customer service. Management noted results were closely aligned with broader market trends, marking meaningful progress against the last few years of market underperformance.
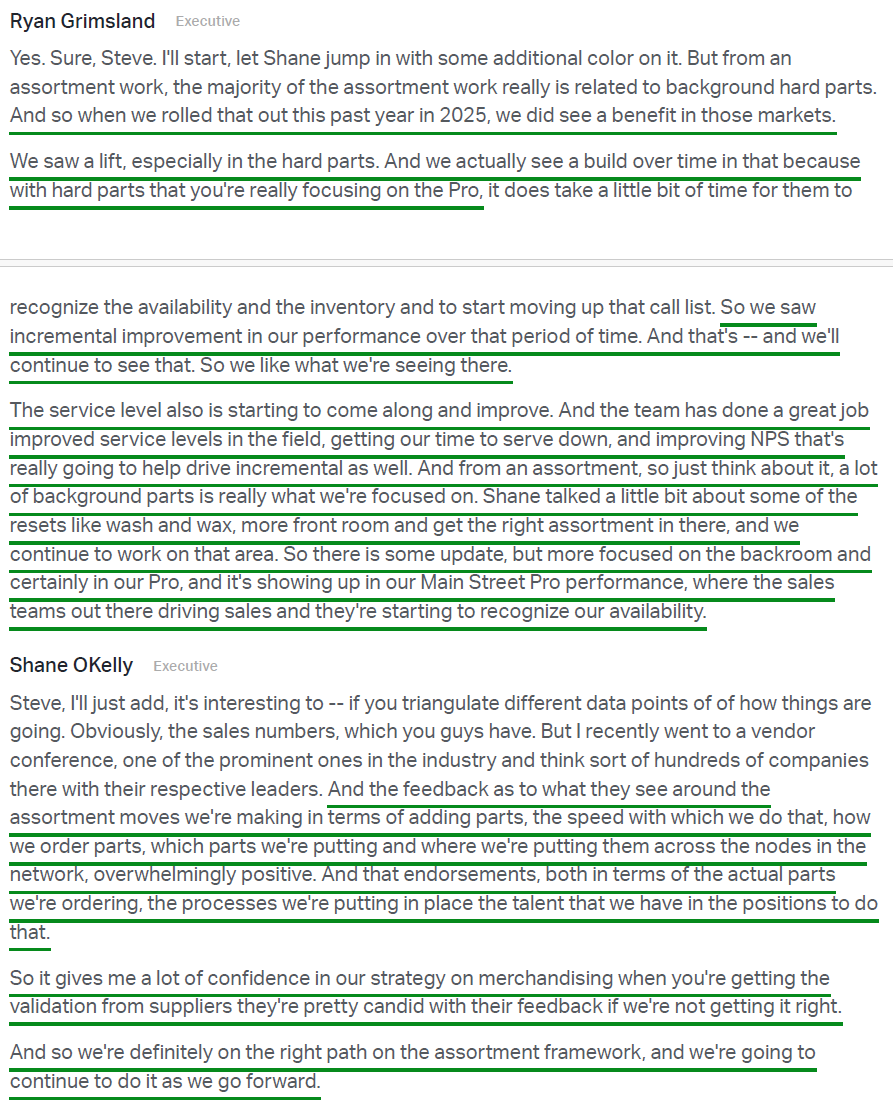
3) The Pro channel grew mid-single digits in Q1, driven by Main Street Pro outperforming overall Pro by >200 bps. Management continues to strategically rationalize the lower-margin national account book and reallocate selling resources toward Main Street, which represents both a larger addressable market and a higher margin profile. The expanded SKU assortment, particularly in brakes and undercar, continues to drive above-average Pro comps and help capture more Main Street business, while delivery times remained consistently under the 40-minute threshold.
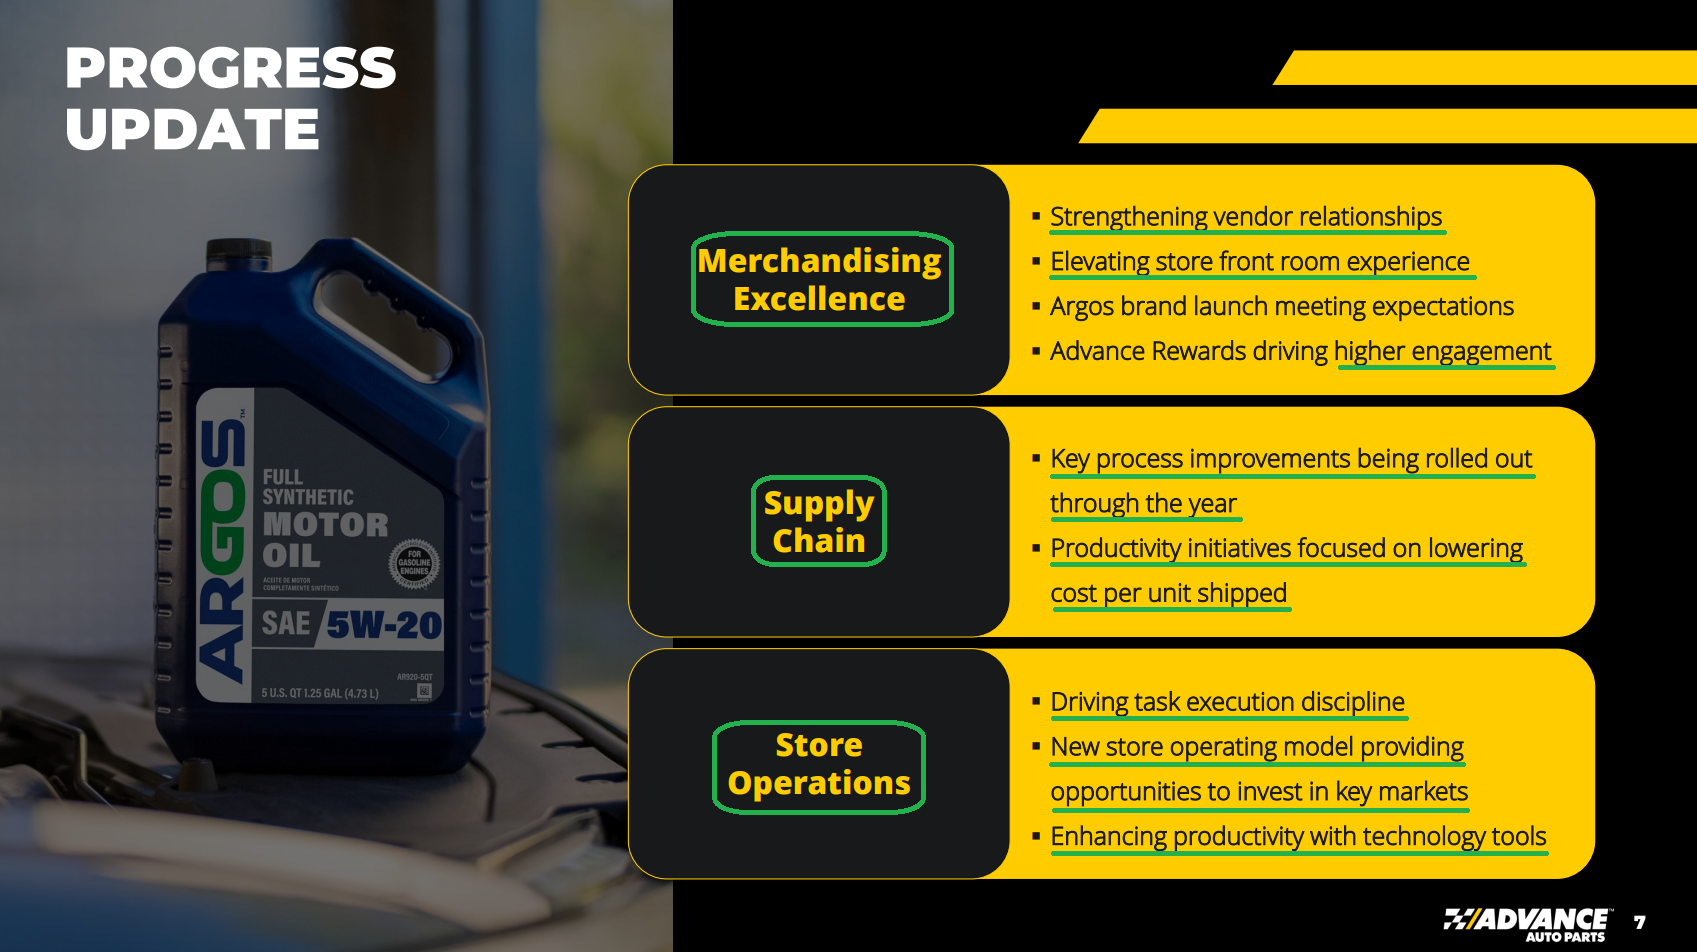
4) DIY returned to positive low single digit growth in Q1, compared to a low single digit decline in the prior quarter, despite what management described as a still-stretched consumer backdrop. A key driver behind the improvement was ARGOS, AAP’s newly launched owned brand, which met expectations as a top brand in the motor oil category and has since expanded into hydraulic oils, antifreeze, performance chemicals, and washer fluid. Management also rolled out Advance Rewards during the quarter, the modernized DIY loyalty program replacing Speed Perks, which has seen strong early engagement, with new member sign-ups, program penetration, and total transactions from loyalty members all trending higher since launch.
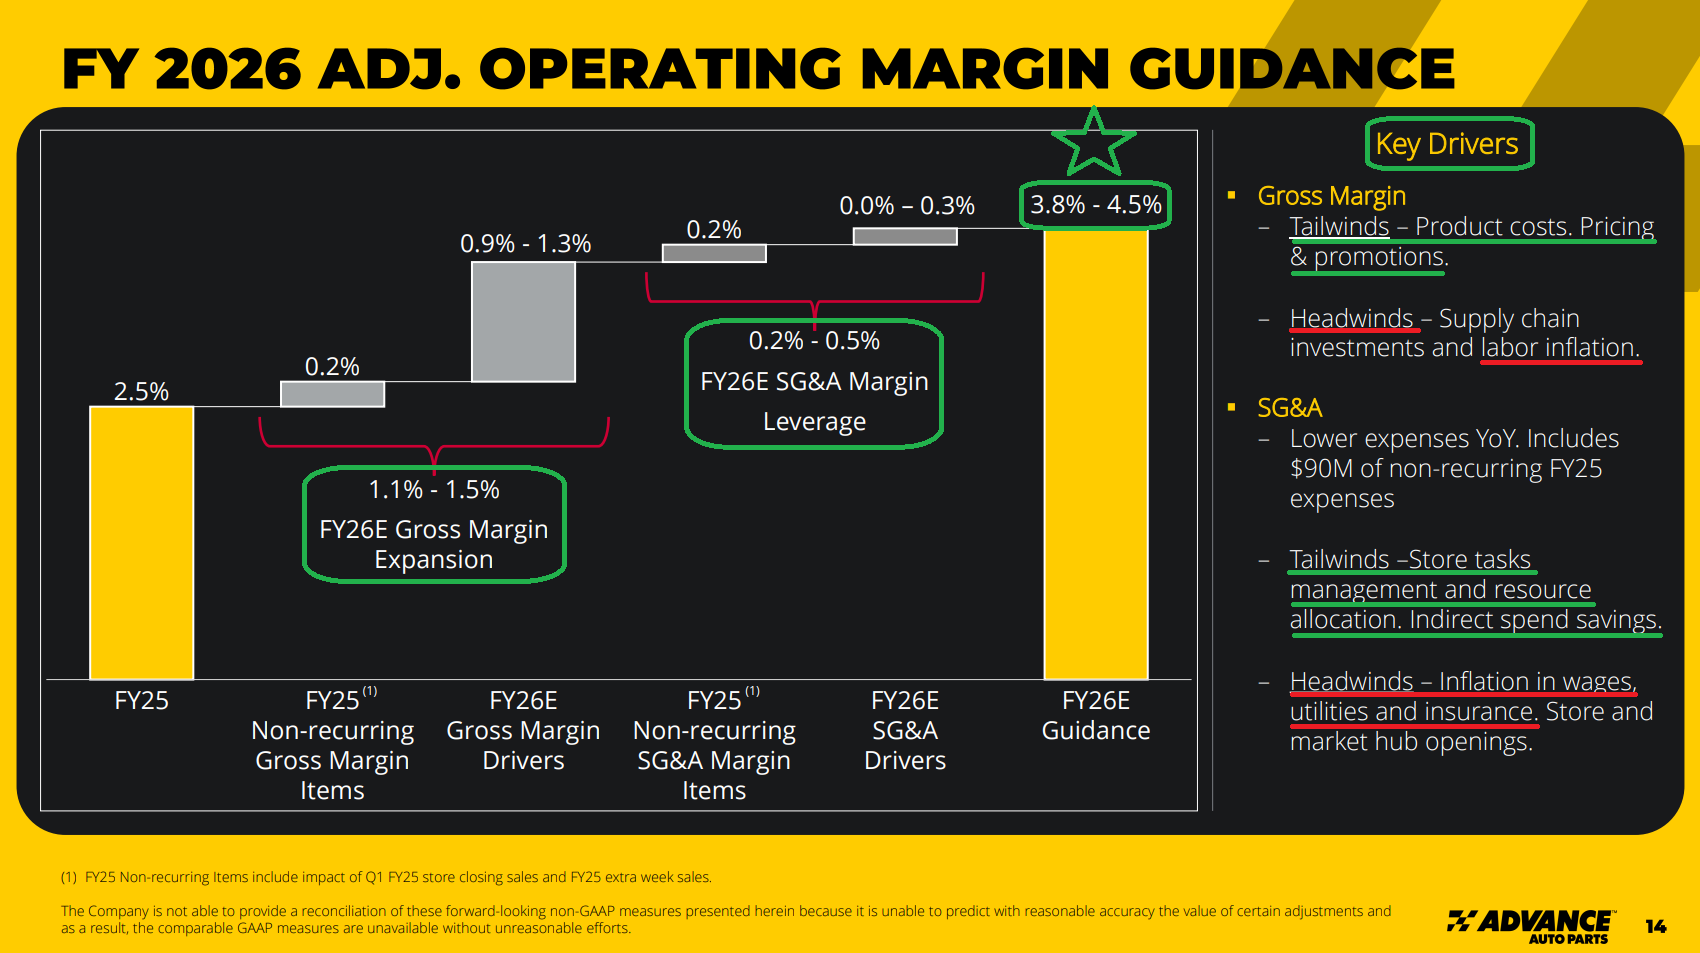
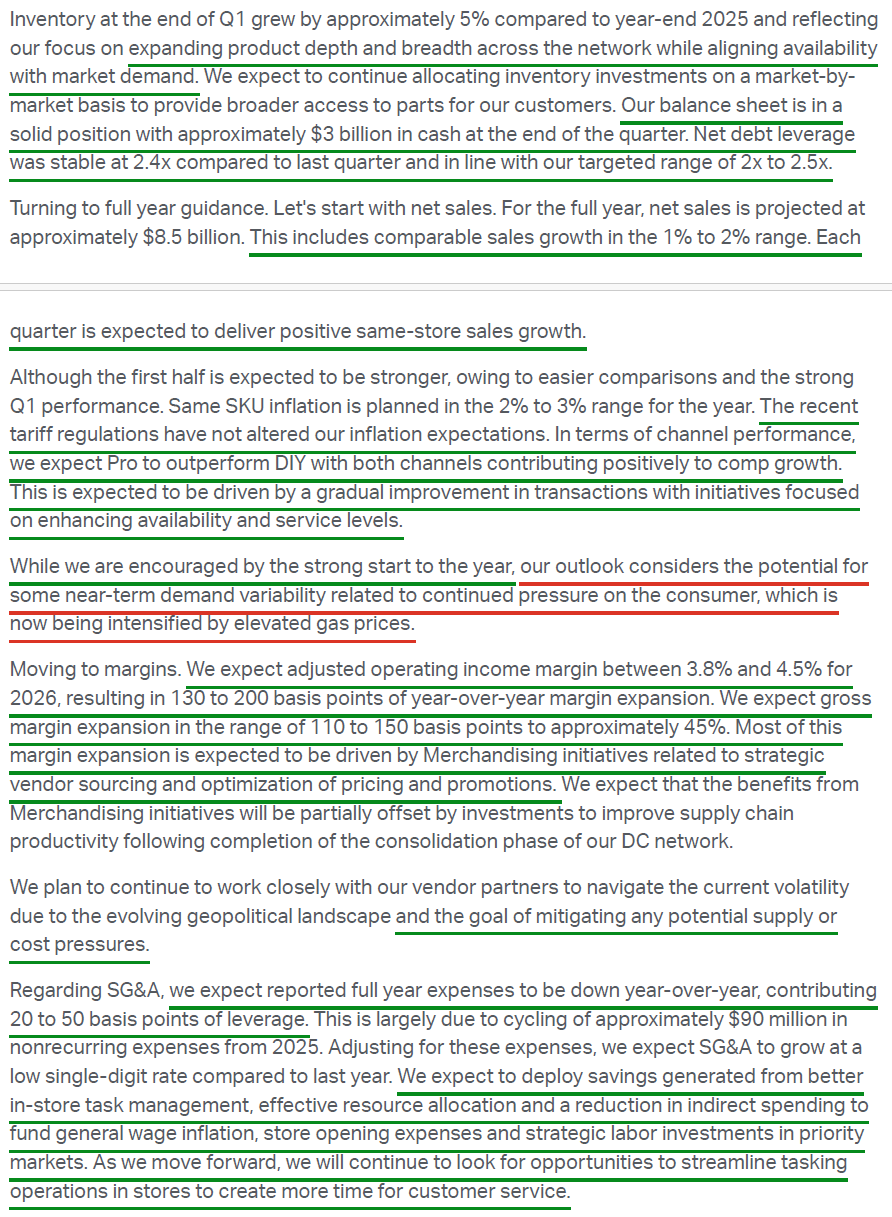
5) Adjusted gross margins came in at 45.1% (+213 bps Y/Y), driven by product margin expansion from merchandising initiatives and the cycling of ~90 bps of atypical margin headwinds related to last year’s store optimization program. Management expects FY26 gross margin of ~45%, with Q2 and Q3 tracking around the high end given seasonally favorable mix, implying 110 to 150 bps of full year gross margin expansion.
6) The most important metric in the AAP turnaround, adjusted operating margin, came in at 3.8% (+410 bps Y/Y), far ahead of the 2.7% consensus estimate. Merchandising execution and product margin expansion drove most of the progress in Q1, and management expects merchandising to remain the primary catalyst for margin improvement throughout the year. Management maintained FY26 guidance of 3.8% to 4.5% (vs. consensus 4.1%) and expects Q2 and Q3 operating margins to track toward the high end of the full year guide, with the medium-term ~7% target still viewed as appropriate and intact.
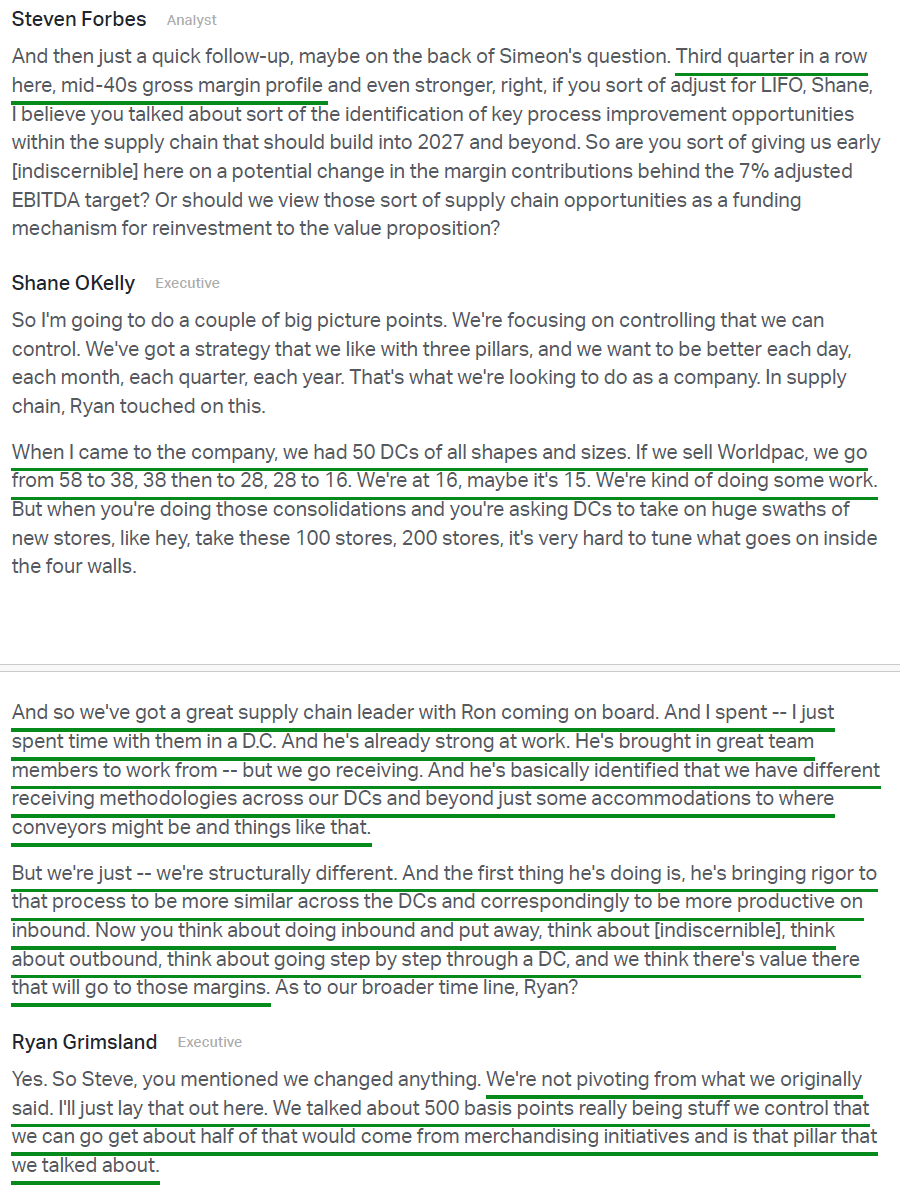
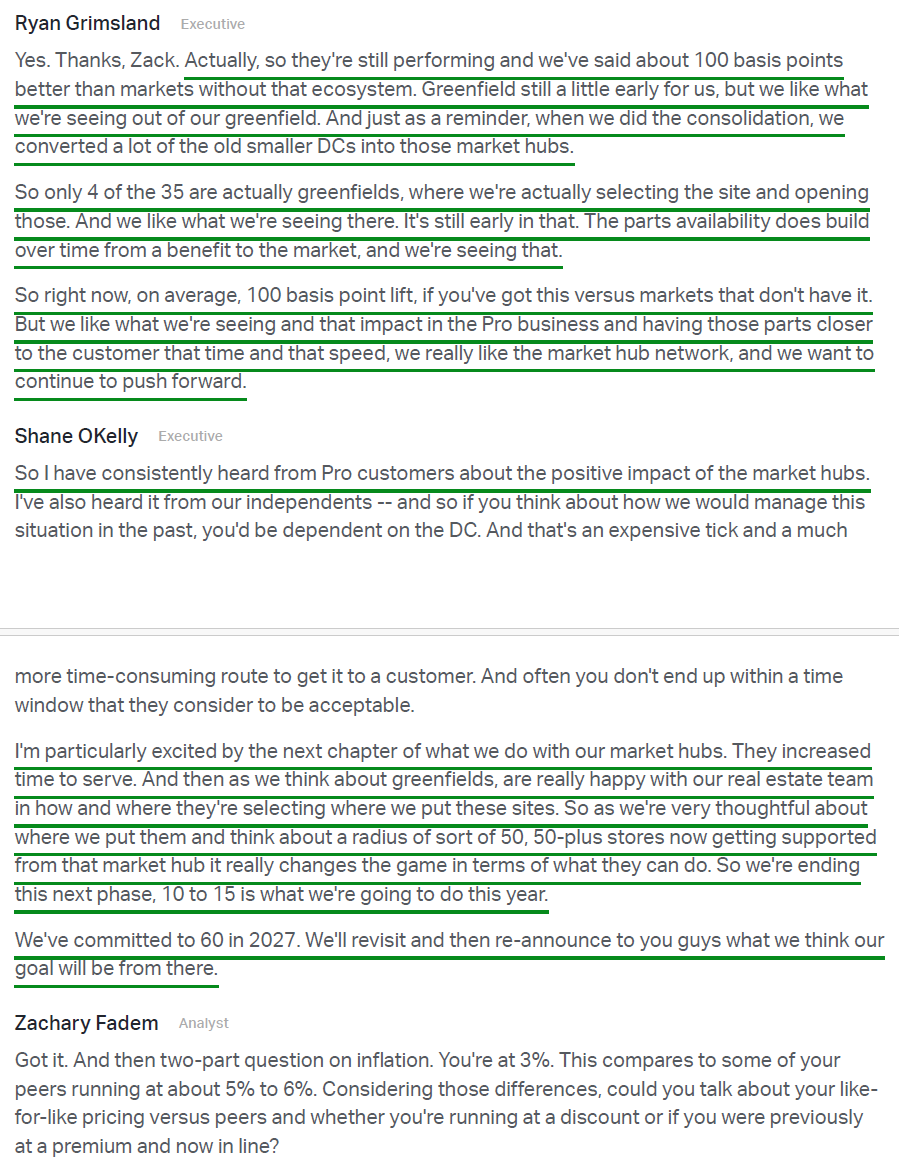
7) The supply chain transformation continues to progress on plan. Following the consolidation of the DC network from 38 facilities to 16, management has shifted its focus toward streamlining and standardizing operations, with a comprehensive review of DC workflows already identifying several process improvements expected to support further gross margin expansion in 2027 and beyond. On the market hub front, AAP opened 2 additional hubs in Q1, bringing the total to 35, and remains on track to add another 10 to 15 hubs in FY2026, keeping the company on pace to reach its ~60 hub target by 2027. These hubs carry 75K to 80K SKUs and provide same-day parts availability across a service area of 60 to 90 stores, driving an average comp sales uplift of ~100 bps in supported markets versus non-hub markets.
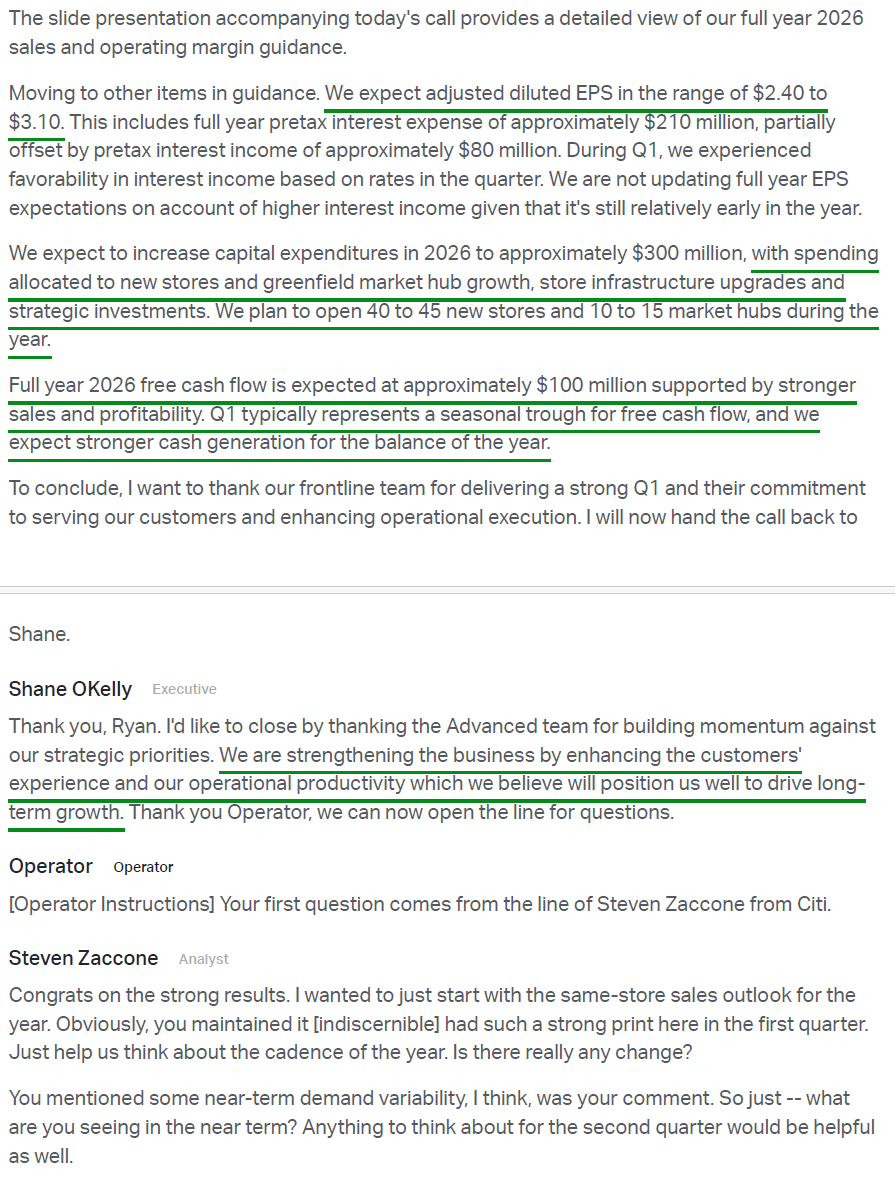
8) Q1 free cash flow was an outflow of $75M compared to an outflow of $198M in the prior year period, with the improvement driven by stronger operating performance, better working capital management, and lower restructuring cash charges of $6M versus $90M last year. Q1 is typically the seasonal trough for cash flow generation, with FY26 FCF guidance of ~$100M reaffirmed and significantly stronger cash generation expected over the balance of the year. This improvement comes despite capex stepping up to ~$300M in FY2026 (versus $252M in FY2025), with spending supporting 40 to 45 new store openings, 10 to 15 market hub openings, infrastructure upgrades across more than 1,000 stores, and other strategic investments.
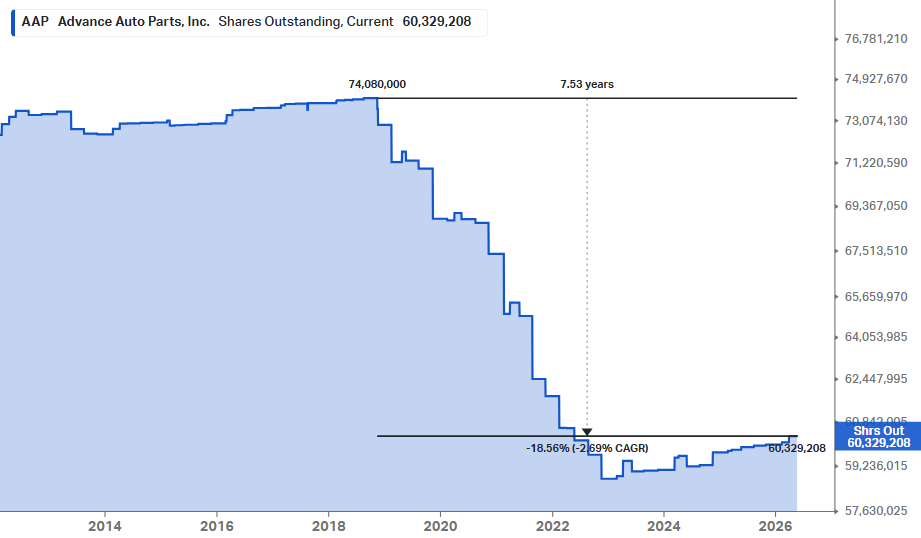
9) The balance sheet remains in a solid position, with ~$3.0B of cash on hand against $3.4B of total debt at the end of Q1 2026. Net leverage held steady at 2.4x, in line with last quarter and within management’s targeted range of 2.0x to 2.5x. Management continues to work toward re-establishing an investment-grade credit rating, which would be a material unlock for the business.
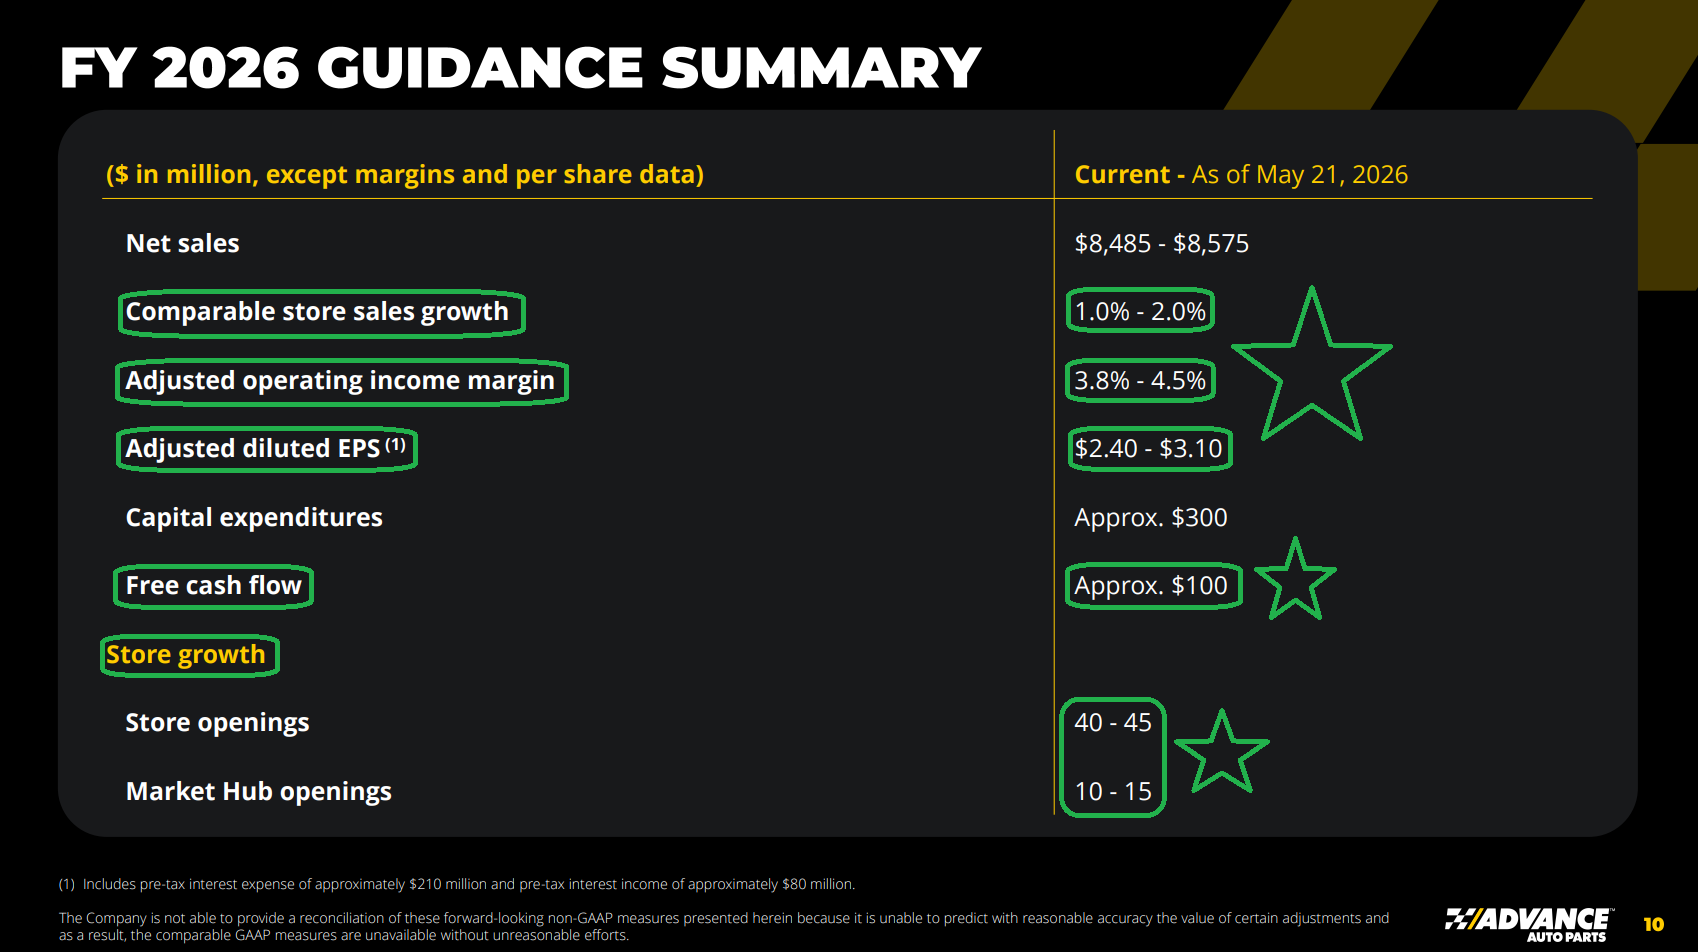
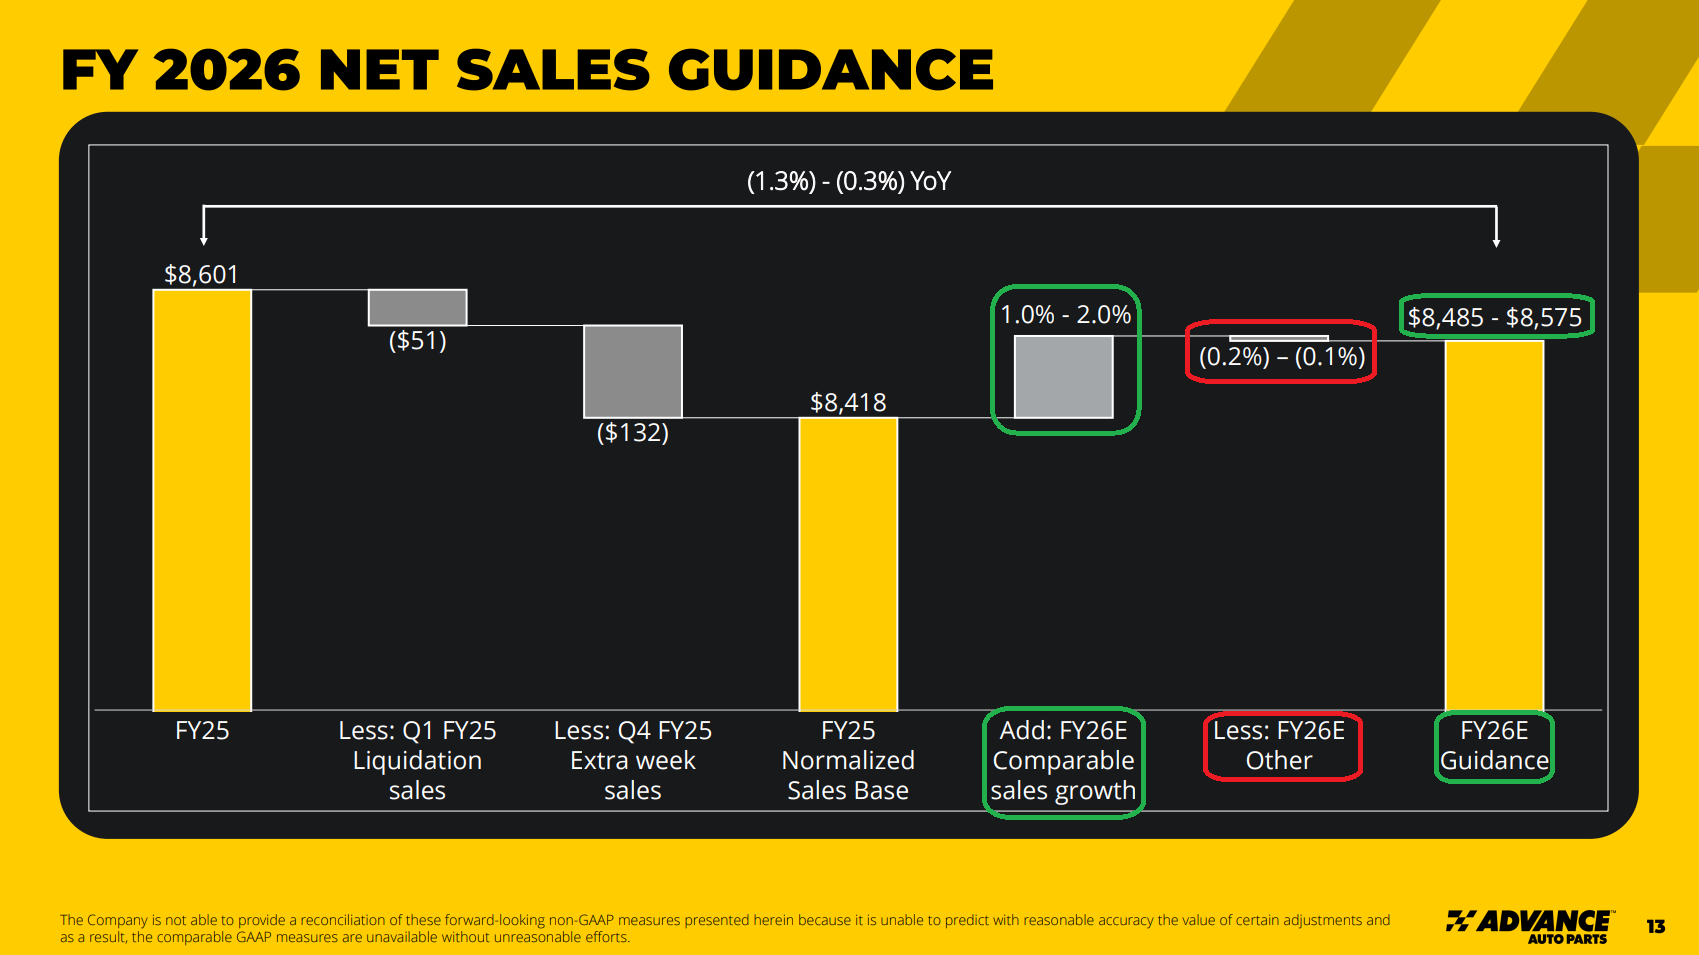
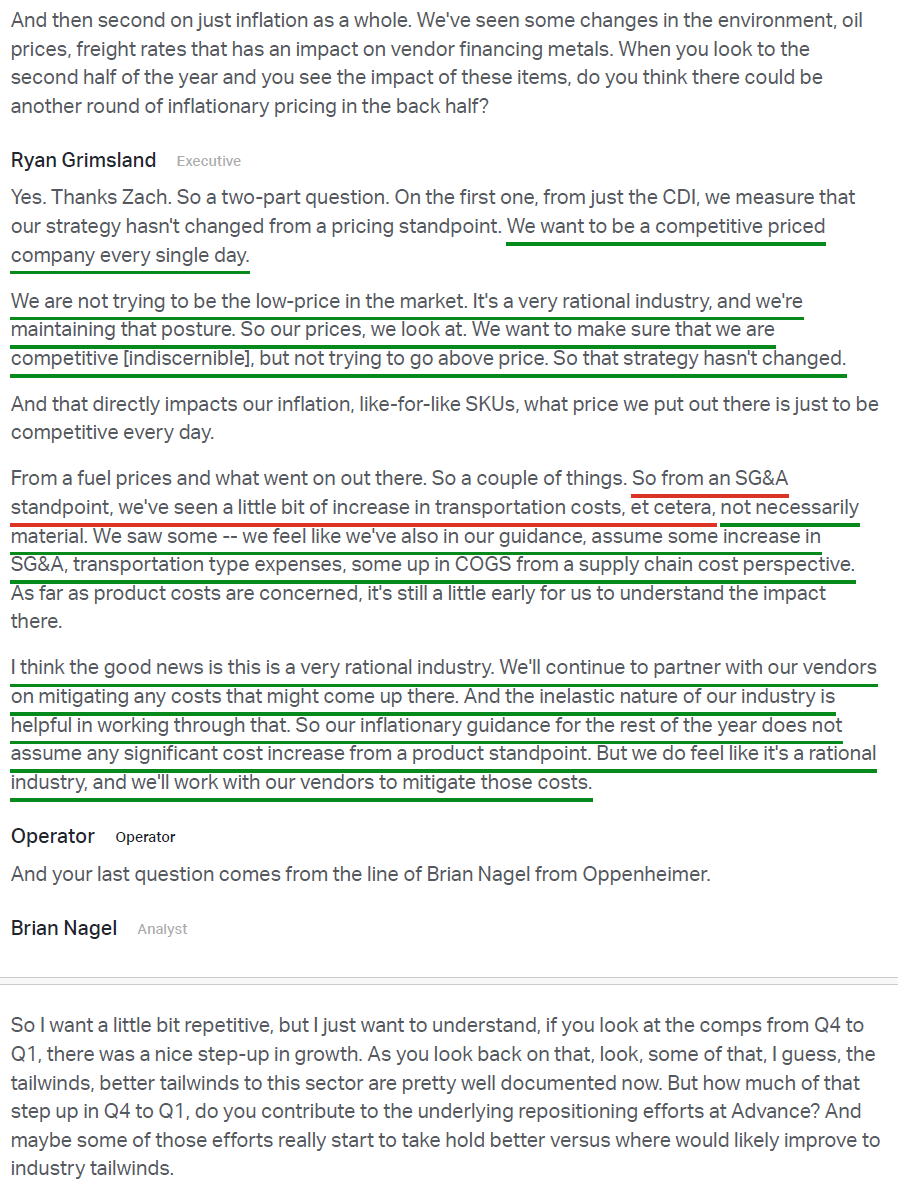
10) Management reiterated full year guidance across the board following the strong Q1 print. Net sales are expected to be $8.49B to $8.58B, with comp sales growth of 1.0% to 2.0% and positive comps expected in each quarter. Adjusted operating margins are projected to reach 3.8% to 4.5% (vs. 2.5% prior year), while adjusted diluted EPS is expected to be $2.40 to $3.10 ($2.75 midpoint, +21.7% Y/Y growth), below the $2.90 consensus estimate. Management called out near-term demand variability tied to tax refunds and the Memorial Day peak driving season as consumers continue to face pressure from elevated gas prices, though the inelastic, needs-based nature of the business (~90% repair and maintenance) continues to provide a steady backdrop.
Earnings Call Highlights
General Market
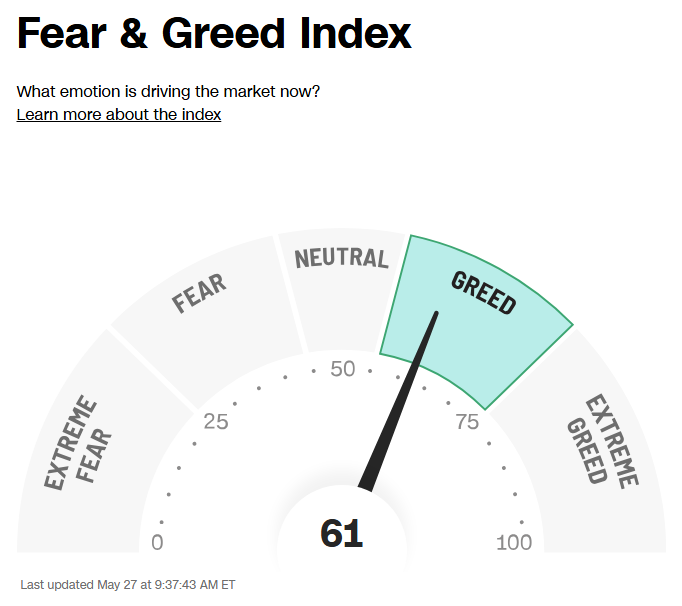
The CNN “Fear and Greed Index” remained unchanged at 61 this week. You can learn how this indicator is calculated and how it works here: (Video Explanation)
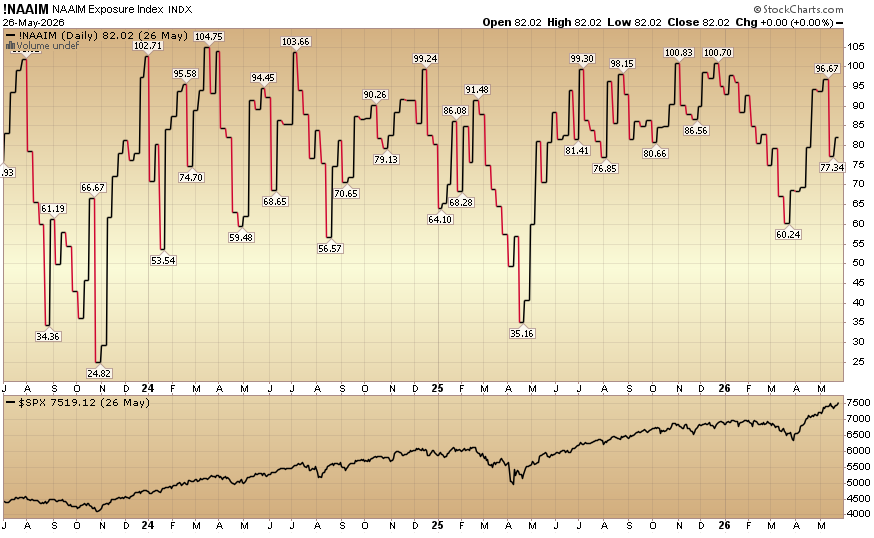
The NAAIM (National Association of Active Investment Managers Index) (Video Explanation) rose to 82.02% equity exposure this week from last week’s 77.34%.
Our podcast|videocast will be out sometime today. We have a lot of great data to cover this week. Each week, we have a segment called “Ask Me Anything (AMA)” where we answer questions sent in by our audience. If you have a question for this week’s episode, please send it in at the contact form here.
Larger accounts $5-10M+ can access bespoke service anytime here.
Not a solicitation.
*Opinion, Not Advice. See Terms


Comments
Log in or sign up to join the conversation.