

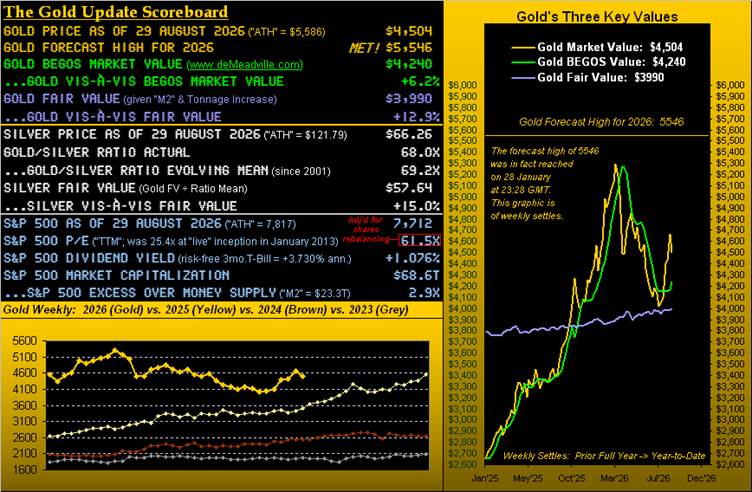
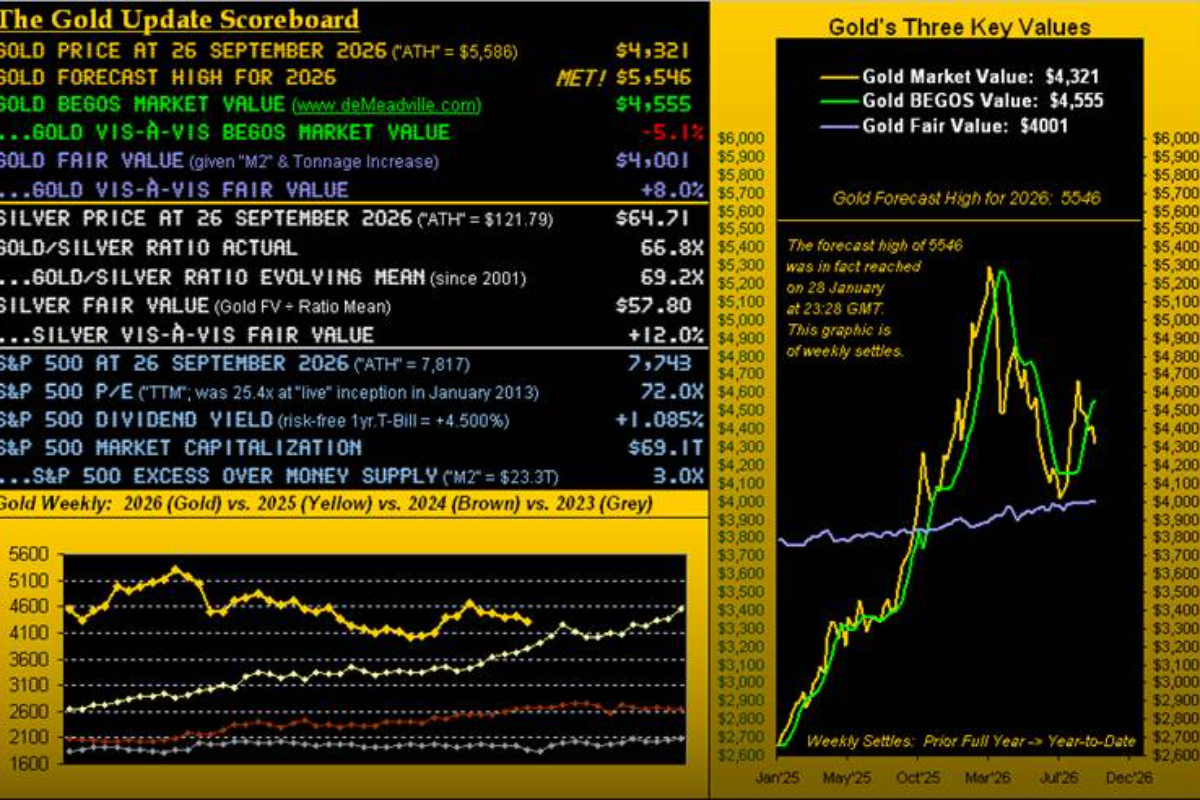
Yes: following five consecutive up weeks for Gold, this past one was down, price settling yesterday (Friday) at 4504. ‘Twas Gold’s fourth-worst weekly performance (-3.4%) of the 34 full trading weeks year-to-date, yesterday alone being the 12th-worst single session (-3.2%) thus far through 2026’s 166 trading days. Fortunately, per the upper Scoreboard’s right-hand panel, the week’s dip actually appears nothing more than a blip.
No: we are not predicting an imminent outright crash for the S&P 500. However, ’tis seasonally “that time of year” with crash conditions — certainly by lack of both supportive earnings and money supply — more acute than across any and all of Black Tuesday in ’29, the Garzarelli Cavatelli in ’87, the Asian Contagion in ’97, the Russian Debt Crisis in ’98, the DotComBomb in ’00, the FinCrisis in ’08 and the Ovid to Covid in ’20. Let’s face it, folks: the dough ain’t there. We’re simply awaiting the fear.
Specific to Gold, just as it had rallied two weeks ago upon StateSide SecTreas Scott “Buy Back Bonds!” Bessent’s move to lower yields, price yesterday careened back down upon FedHead Kevin “The Warrior “ Warsh in Wyoming having inferred the Federal Open Market Committee may have to vote to tighten money should inflation not recede toward the desired annualized 2% target. In fact, his stated current inflation rate (Personal Consumption Expenditures basis) of 3.7% matches our overall “12-Month Summation” average through July as we see here:
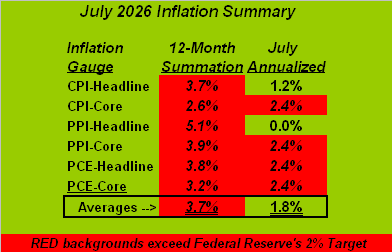
However, our “July Annualized” column averages to just 1.8%, aided by slowing headline inflation per both the retail measure’s Consumer Price Index and the wholesale measure’s Producer Price Index.
“Well, maybe July was just a ‘one-off month’, mmb…”
Seasonally, Squire, July can be rather subdued, notably by the PPI headline inflation measure. The “Great American Sap” (hat-tip dear old Dad) has towed his boat to the lake to vegetate and drink 12-oz. cans of Coors for two weeks rather than constructively engage in any material economic stimulus.
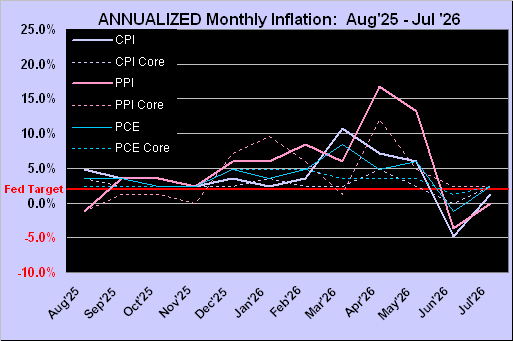
Such digression aside, here is another view from one year ago-to-date of each monthly inflation metric annualized (which for you WestPalmBeachers down there means multiplied by 12). The red axis is the Fed’s preference for 2% inflation, toward which — following what was a deflationary June — the metrics for July converged:
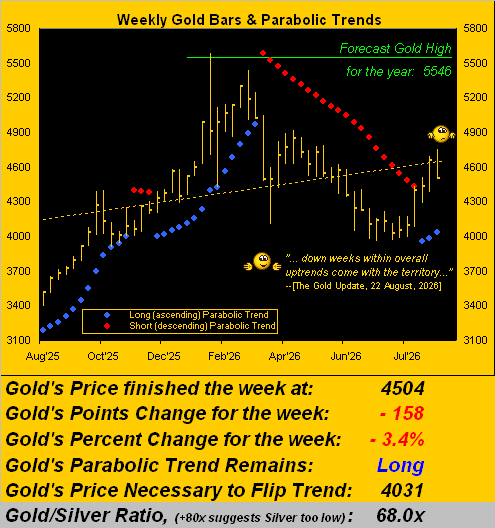
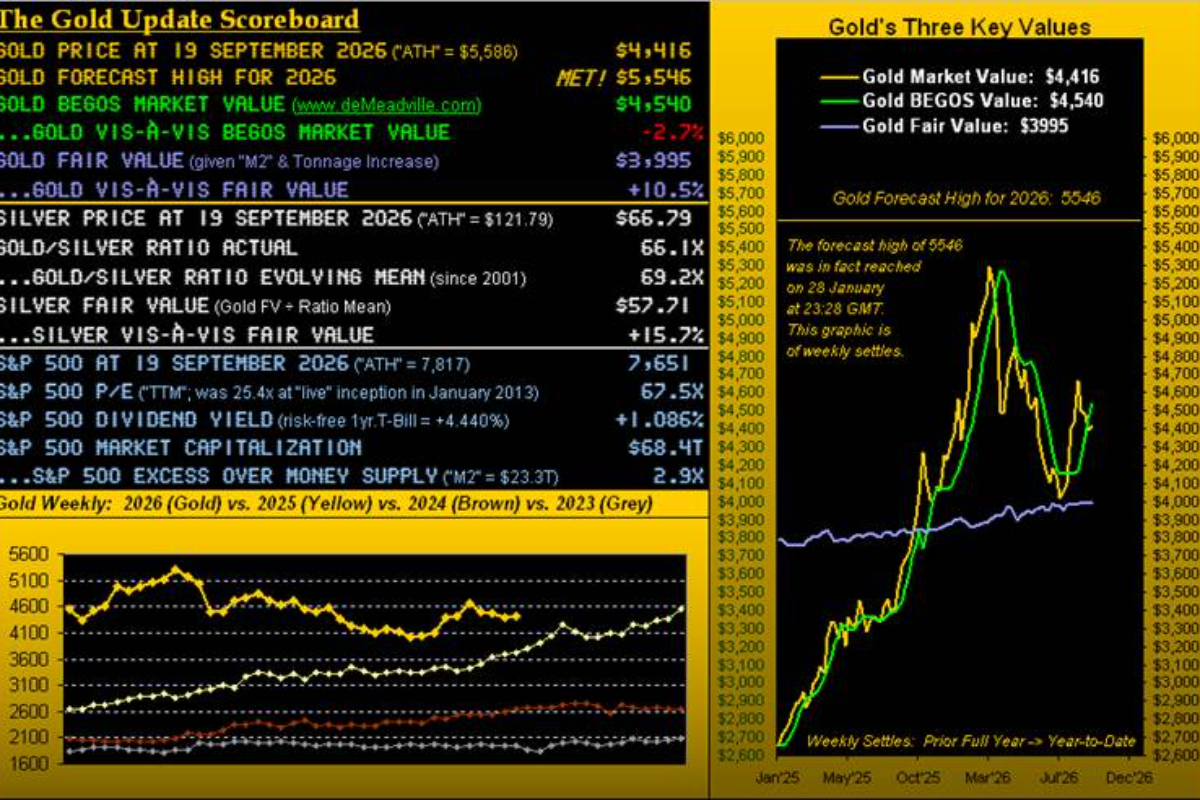
Either way, from the conventional wisdom Gold perspective, lower rates/yields are friendly as they depress the Dollar, although vice-versa are inhospitable. Recall as well from last week’s missive our graphic of Gold having reached well above its BEGOS Market Value (as also depicted in today’s opening Scoreboard), such that price was potentially at a near-term peak. Still, despite Gold’s poor performance for this past week, the broader picture continues on balance in resumption of upside form per the weekly bars and rightmost blue parabolic Long trend dots:
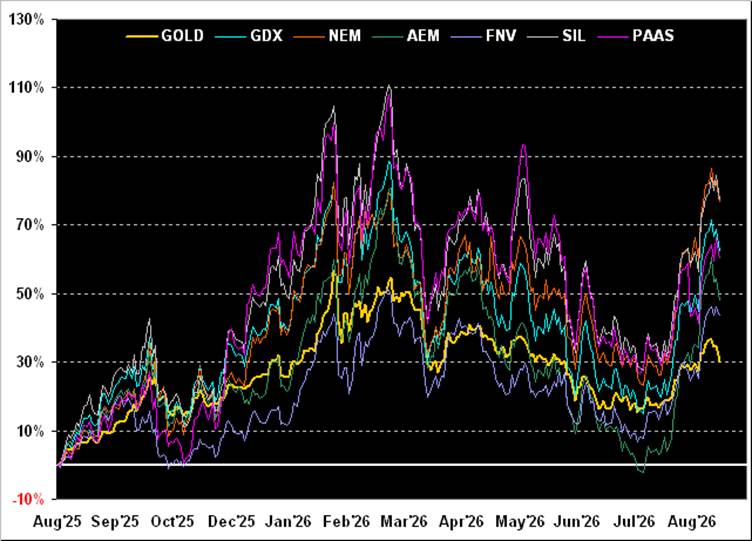
As well, it being month-end (less one trading day), let’s go to our year-over-year percentage tracks of Gold along with premier of its metals equities. And the leverage of the latter is clearly on display as we find Gold itself +30%, Franco-Nevada (FNV) +43%, Agnico Eagle Mines (AEM) +48%, Pan American Silver (PAAS) +60%, the VanEck Vectors Gold Miners exchange-traded fund (GDX) +62%, along with Newmont (NEM) and the Global X Silver Miners exchange-traded fund (SIL) both +77%. Livin’ large by the leverage of late are the equities lads!
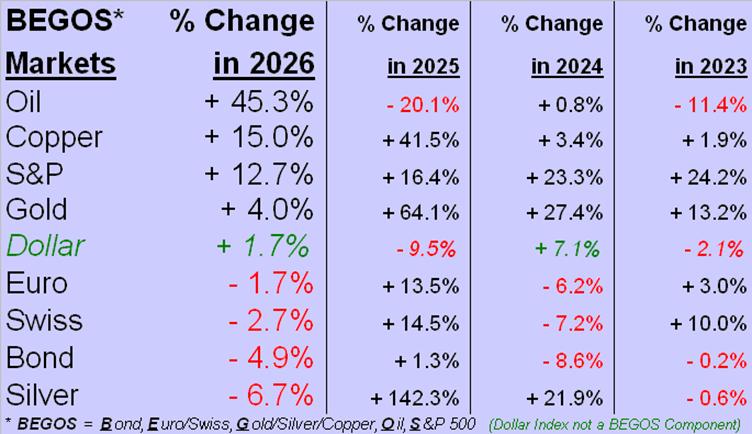
We’ve more in maintaining our month-end mode with the year-to-date BEGOS Market Standings. Just a month ago, Gold was third-from-the bottom, -5.4%: now ’tis in fourth position, +4.0%; however, we again find Silver in the cellar. Poor ol’ Sister Silver… especially with Cousin Cooper +15.0%… “Got Silver?” (hint-hint, wink-wink, nudge-nudge):
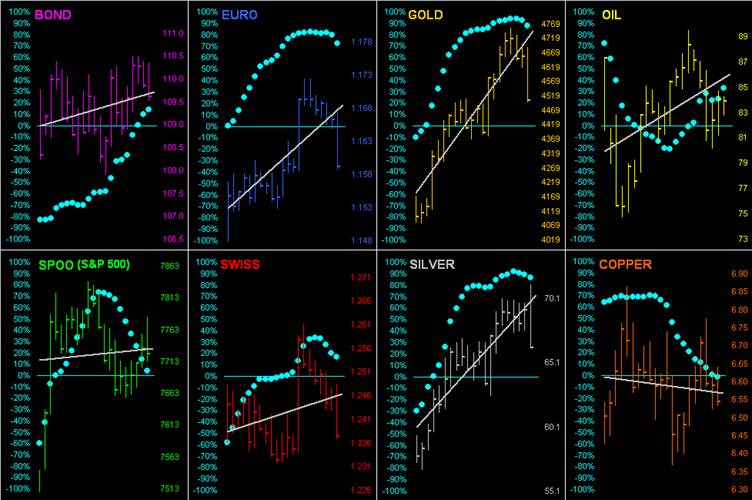
And in keeping with the BEGOS bunch, let’s go ’round the horn across their respective past month (21 trading days) wherein seven of the eight components (save for Copper, which as just cited has already been having an excellent year) are sporting positive grey trendlines. That stated, we are near-term wary of the baby blue dots that depict trend consistency now rolling over notably for Gold, Silver, and the Euro. As you regular readers and website followers know, our leading indicator of the “Baby Blues” falling below the +80% level portends still lower prices near-term (as was the case for the Euro at Wednesday’s settle). Neither those for Gold nor Silver at this writing have (yet) broken below +80%. But should they so do in the next day or two, Gold’s nearby support structure starts from just above here (4504) at 4509 down to 4366, and for Silver (currently 66.26) from 66.98 down to 62.45. That said, hardly do we think one ought abandon the precious metals during this near-term adversity. (As to the S&P 500, did we mention ’tis historically “Crash Season”?)
“Good one, mmb. Here’s your picture.”
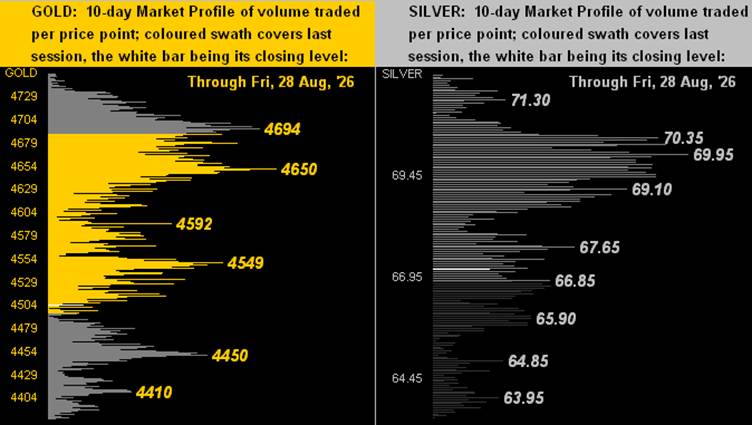
In further turning to the 10-day Market Profiles for Gold on the left and for Silver on the right, the prices of both precious metals traveled southerly this past week, their respective white lines denoting Friday’s settles. Volume-dominant level supporters and resistors are as labeled:
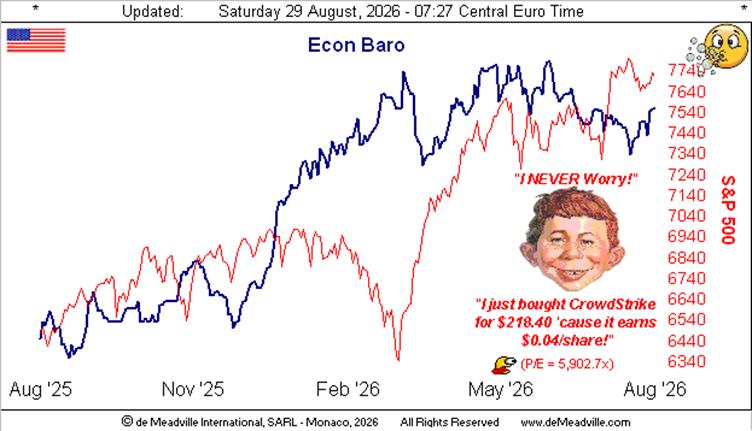
However, having recently stopped moving southerly is the Baro. Only four of the Economic Barometer’s incoming metrics for the past week were worse period-over-period. BUT: included therein was the Chicago Purchasing Managers’ Index for August, which slipped from an “expansion” reading in July of 57.6 to now a “contraction” reading of 47.1. Except for the onset of Covid per the April 2020 reading, this August’s negative Chi PMI swing was the worst since that into February of 2015, following which the S&P 500 fell by as much as -11.5% over the ensuing six months … just in case you’re scoring at home. And again, we now sit on the threshold of the S&P’s potential “Crash Season” … albeit of the aforementioned bevy of occurrences, there’ve been only two of -50% so far this century. So, not to worry. Here’s the Baro:
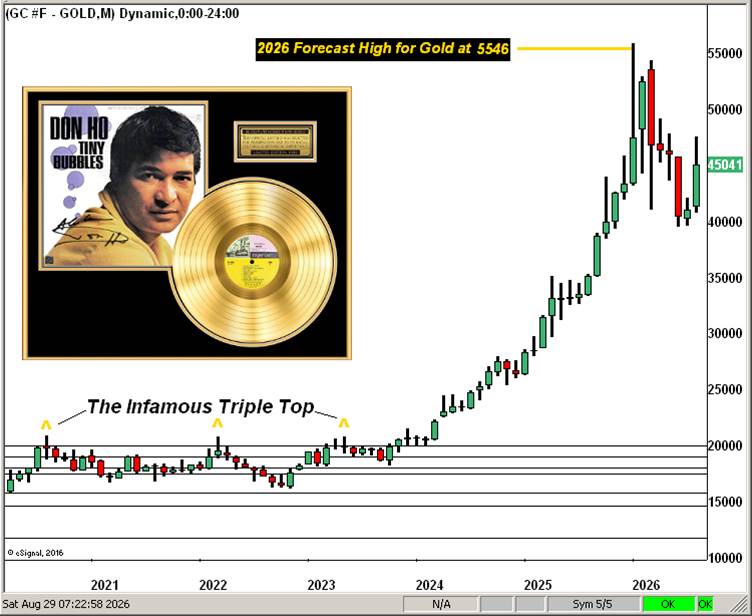
So whilst the herd blows bubbles as the S&P itself bubbles, let’s instead return to something of substance: Gold by its monthly structure so far this decade. Oh to be sure, Gold went through a stage of bubbling earlier this year in reaching the All-Time High of 5586 (29 January) — then +44% above Fair Value — only to thereby return, (as you’ll herein recall), come 24 June.
Regardless, as currencies have come and gone over the centuries, throughout there’s always been Gold: good ol’ Gold! Again, it has had periodic bubbles; but they’ve been relatively “Tiny Bubbles” –[’66] compared to those of Dollar debasement, debt and (understatement) S&P. Here’s the structure graphic, the rightmost candle showing an on-balance strong August, (and albeit with one trading day still to go), Gold’s best net month (+8.8% even in accounting for Friday’s demise) since February (+9.6%). You tell ’em in Golden style there, Don!
To sum it up, a bit more near-term Gold slippage is what we envisage, but hardly enough to flip the broader-based weekly parabolic from Long to back to Short: ‘twould entail from here a further fall of some -10%, whereas we’re instead keenly eyeing the 4900s to trade on this overall upside run.
‘Course, that in the following context would be modest. Given (per the opening Scoreboard) the ratio of the S&P 500’s market capitalization/liquid money supply being 2.9x, plus the ever-expansive insolvency of the U.S. Treasury, we provide this calculation, with which you can impress your friends at next weekend’s StateSide Labor Day BBQs:
Gold today: $4,504/oz. (Fair Value $3,990/oz.);
“Print” $45.5T to make S&P investors “whole” were the Index liquidated today;
and
“Print” $40.1T to make the U.S. Treasury “whole” were its debt paid down today;
…a little drumroll please…
Resultant Fair Value for Gold: $18,365/oz.
Or, as aforestated:

Adhere to Gold!
Comments
Log in or sign up to join the conversation.