

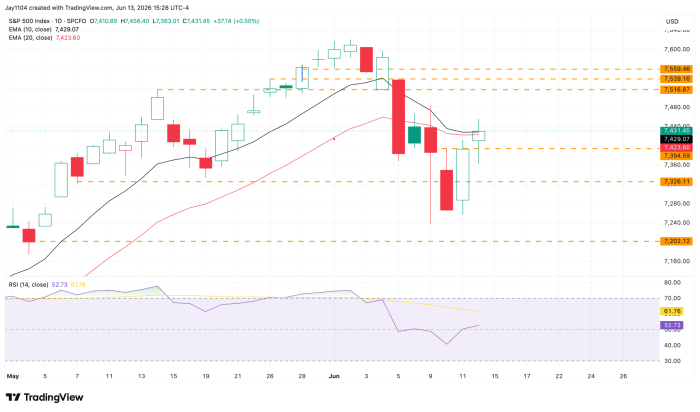
The market got off to a rocky start this week but managed a pretty decent rebound after last week’s big decline. Most of the gains came on Thursday, on news that there may be a deal between the US and Iran again — something that’s been ongoing since March. Whether or not a deal actually gets signed, the market still responds every time, and I think that’s really the key. By the close, the S&P 500 was slightly above its level at the close last Friday.
The catch is that it’s still pressed up against its 10- and 20-day exponential moving averages, which are clearly acting as resistance for now, with more technical resistance stacked just overhead.
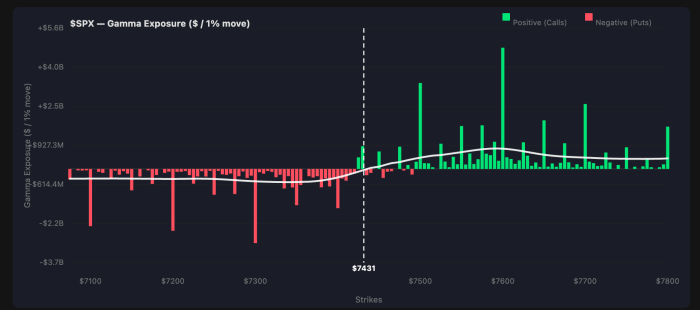
From a positioning standpoint, we’re back in positive gamma (a state where dealers’ hedging dampens moves instead of amplifying them), but only faintly. A drawdown next week could flip us back into negative gamma, where dealer hedging instead goes with the market and accelerates the move — that’s a lot of what powered Thursday’s rally. In positive gamma, you tend to get more of a pinning effect than a trend. With monthly options expiring on Thursday the 18th (the market is closed Friday the 19th for the holiday) and a lot of that gamma set to roll off, it wouldn’t surprise me if next week is fairly muted and range-bound.
The bigger event is the Fed on Wednesday, and I think it’s a meeting that could catch the market a little offside with a more hawkish stance. It helps to frame where we’re coming from. At the March meeting under Jay Powell, the projections had median dots (the FOMC’s rate-path forecast) at 3.4% for 2026, with the cutting cycle leveling off around 3.1% into early 2027.
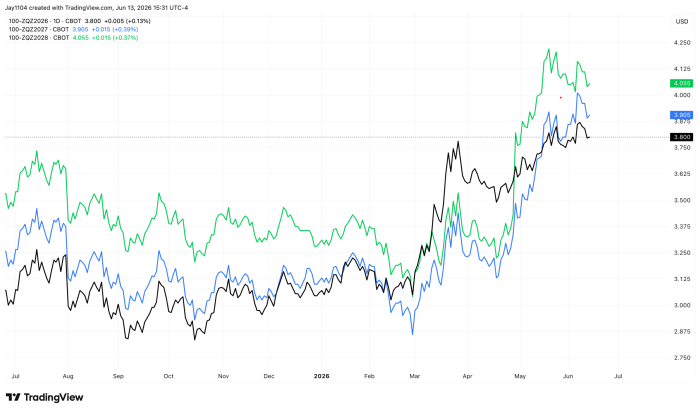
Markets have repriced a lot since then. Fed funds futures are now trading around 3.80% for 2026, 3.90% for 2027, and 4.05% for 2028. That basically removes the rate-cut bias that was built into the projections and tilts the conversation toward hikes. I’d also expect a change in the statement that drops the easing bias and shifts the emphasis away from the labor market and back toward inflation.
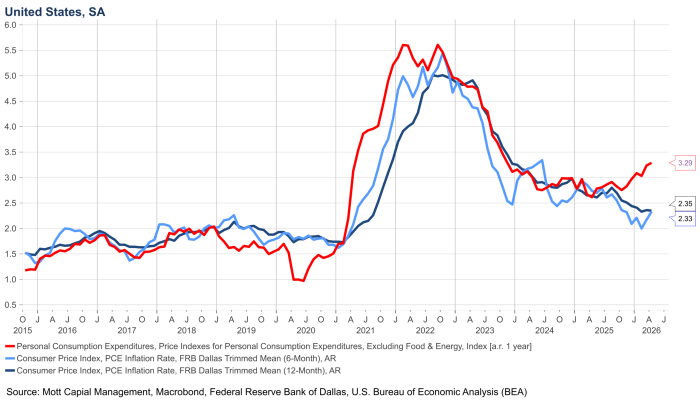
And inflation is the part that’s gotten more interesting, because it’s stopped being only an oil story. Core CPI (prices excluding food and energy) is running around 3.1% to 3.2% on a three- and six-month basis and 2.8% over the past year — which means the one-year number probably keeps drifting higher until the monthly pace rolls over. Core PCE (the Fed’s preferred inflation gauge) tells the same story, around 3.8% on a three- and six-month basis and 3.3% year over year.
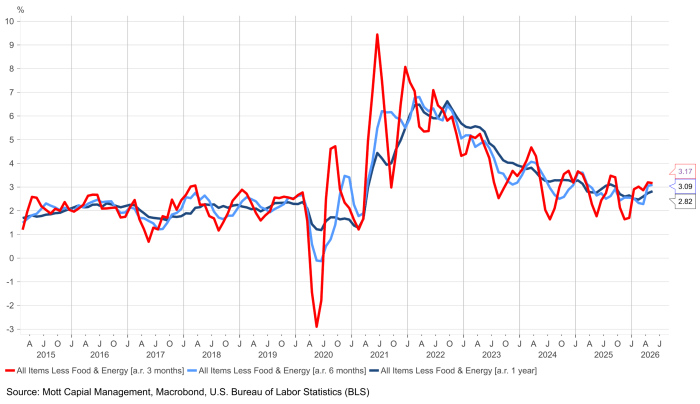
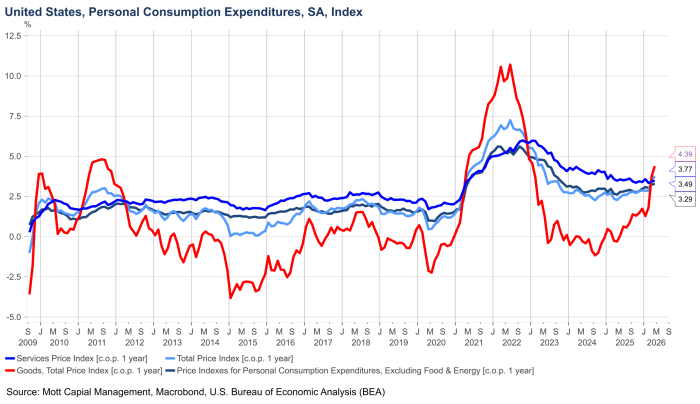
It shows up even in the measures that strip out the outliers. Trimmed mean PCE (an inflation measure that throws out the biggest movers each month, and one Kevin Warsh has pointed to) is running around 2.3%, and the Cleveland Fed’s trimmed mean CPI is around 2.9%. The lesson from 2021 is that the trimmed-mean measures were slow to catch up while core PCE was leading higher, and core PCE peaked first — and in 2019 and 2020, you never would have gotten rate cuts on the trimmed mean alone. If this were all oil, you wouldn’t see core running this hot on a three- and six-month basis, especially since oil didn’t really start moving until March. Goods prices have a lot to do with it: they’ve swung from negative to about 4.4% year over year, and that’s feeding the readings.
At the same time, the labor market looks like it’s turning. The ratio of job openings to unemployed workers has swung back above one and has been making higher highs and higher lows since December, and the payroll data, ADP, and Revelio Labs are all pointing the same way — a labor market that probably bottomed late last fall and is turning higher. That gives the Fed room to take its focus off employment and put it on inflation. So I wouldn’t be surprised if Wednesday’s dots show the unemployment rate ticking down and the inflation projections moving up for this year and next.
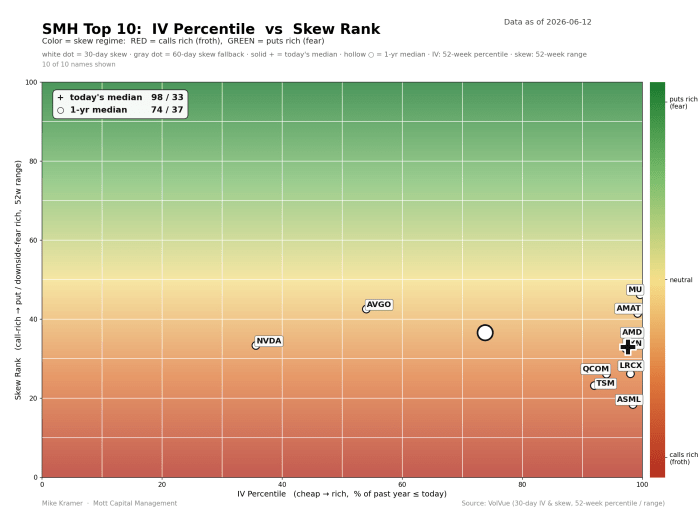
On the equity side, the semiconductor picture hasn’t really reset. Implied volatility on the group still sits at the high end of its one-year range, with options still leaning to the call side, and even with Broadcom (AVGO) and NVIDIA (NVDA) coming down after Broadcom’s results, names like Micron (MU) have held the volatility up. Dispersion (the gap between single-stock and index-level volatility) is still wide and implied correlations are still low — single-stock vol high, index vol low — and that hasn’t normalized even after the sharp decline of the past couple of weeks.

Comments
Log in or sign up to join the conversation.