

This week brings the ISM report, ADP employment report, and the BLS jobs report. Data releases like these used to matter a great deal, but for the moment the market is no longer trading on macro — it is trading on the gamma of seven stocks. Whether and when traditional data begins to matter again remains an open question.
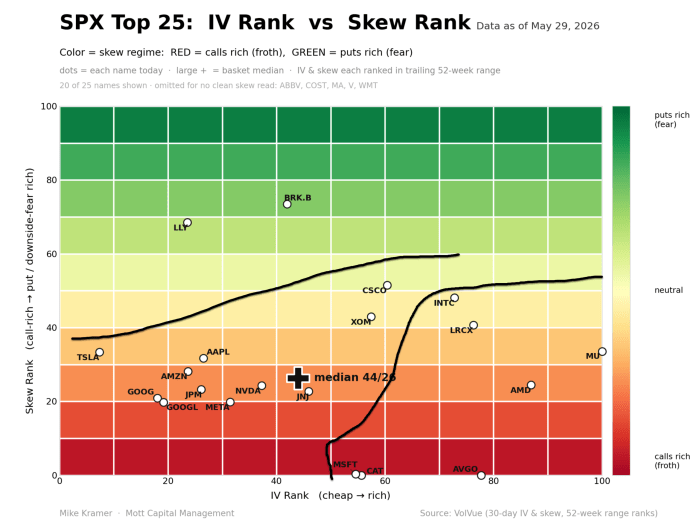
What stands out right now is that the options market appears to be the dominant force, particularly in technology and semiconductor stocks, which should come as no surprise. Oddly enough, Caterpillar (CAT) also falls into that grouping, having been pulled into the AI complex via the data-center power story, and given the stock’s performance over the past year, that is not especially surprising either.
Ultimately, one would think that if call pricing continues to rise through higher implied volatility, it will become increasingly difficult for these stocks to sustain their rallies. Based on the chart, many already appear to be at, or rapidly approaching, extreme levels. The biggest risk for many of these names is overheating.
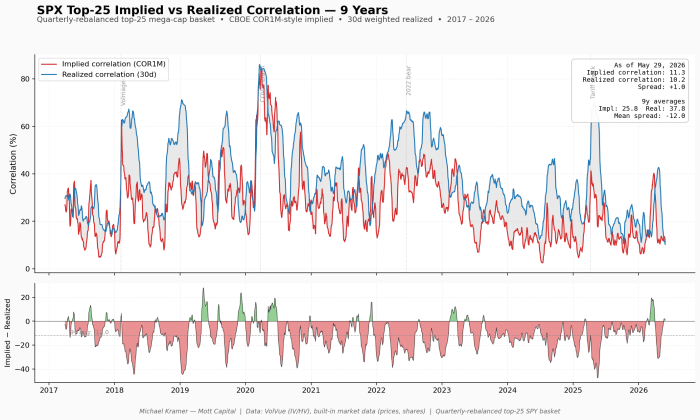
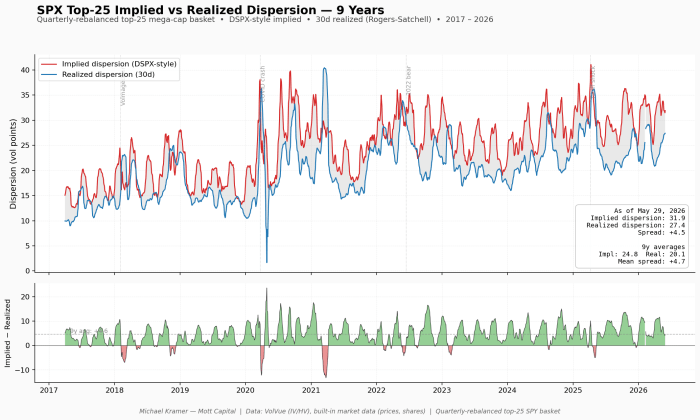
The deeper issue is that the trade that has driven the indexes higher since the end of March — short index vol, long single-name vol via the dispersion trade — is no longer paying. Implied correlations have reached their lower bound, implied dispersion has reached its upper bound, and, when comparing implied and realized measures, the advantage of the trade has collapsed.
Taking the top 25 stocks in the S&P 500 over the past nine years and rebalancing those holdings quarterly, we find that the average implied-to-realized correlation spread is -12, compared with roughly +1 today.
Meanwhile, the same is true on the dispersion side of the equation, where the average spread between implied and realized dispersion is +4.7 points, versus roughly +4.5 points today.
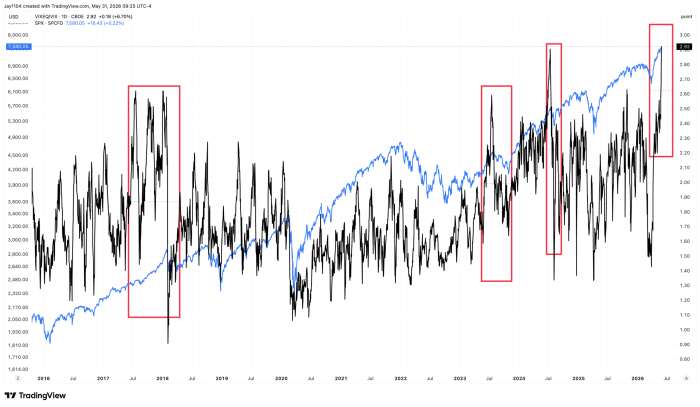
Both spreads are at extreme levels. That would mean traders are likely to begin flipping and move short single-stock volatility and long index-level volatility, and would be evident as the spread between measures such as VIXEQ and the VIX narrows. Right now, that spread is at an extreme, whether measured in absolute terms or relative terms.
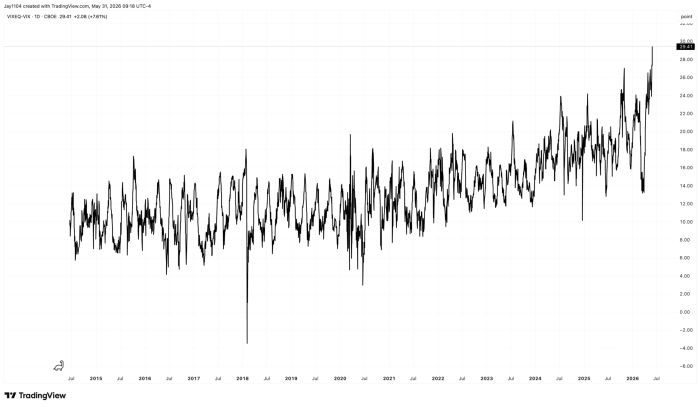
The ratio is also at an all-time high, but perhaps more interesting is that it highlights the most comparable periods more clearly: early 2018, mid-2024, and mid-2025. Each of those periods was followed by a pullback in the S&P 500 of roughly 8-10%. I may just need a catalyst to happen again.
When you look at the economic calendar this week, the upcoming slate of central bank meetings over the next two weeks, and the ongoing geopolitical developments, there appears to be no shortage of potential catalysts, any one of which could trigger an unwind. Given the positioning and technical levels in some of the market’s most important stocks, the opportunities for a trigger event seem more than ample.


Comments
Log in or sign up to join the conversation.