

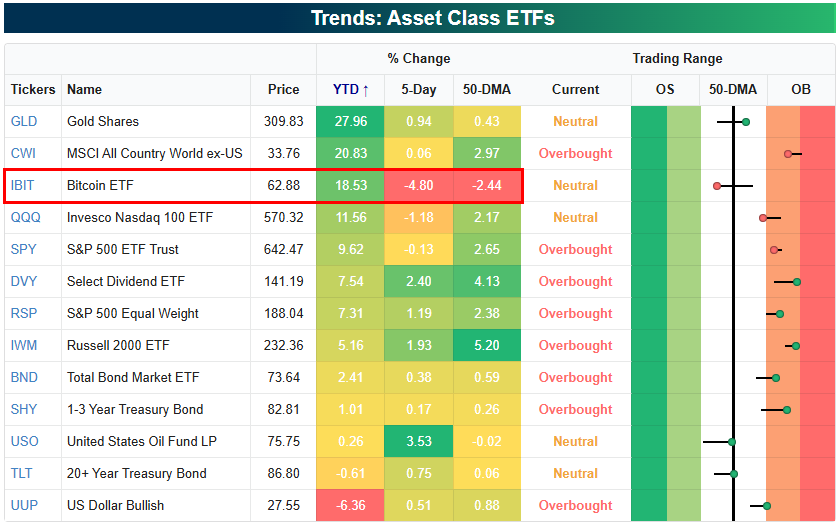
Equities have stalled out in the last half of August as a buyer's strike ahead of the seasonally weak month of September takes hold. Below is a look at where equity ETFs and other asset-class ETFs stand within their trading ranges using our Trend Analyzer tool. Notably, gold (GLD) is now solidly in the lead in terms of year-to-date percentage change after Bitcoin (IBIT) has fallen off dramatically in the last week. Of the various asset class ETFs shown, Bitcoin (IBIT) is easily down the most week-over-week with a drop of 4.8%. On the flip side, oil (USO) is up the most with a gain of 3.5%.
(Click on image to enlarge)
Looking at the mega-caps, the best performer over the last week has been Tesla (TSLA), which remains the worst performer of the group on a year-to-date basis. Alphabet (GOOGL) is the only other mega-cap in the green over the last week, while the rest of them are down 1%+. So far, Microsoft (MSFT) is the only one that has moved back below its 50-day moving average.

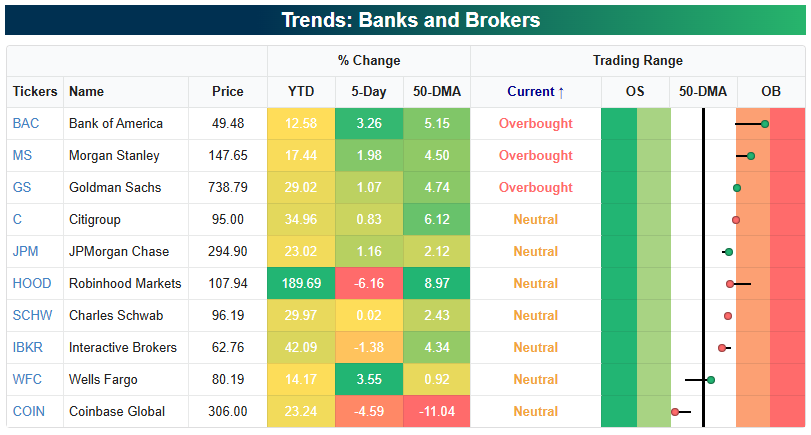
One other area of the market worth looking at is the banks and brokerage firms. While Bank of America (BAC) is up the least year-to-date of any of the stocks shown, it's up the most over the last week with a gain of 3.3%. BAC is also now the most overbought stock of the bunch as it trades nearly two standard deviations above its 50-day moving average. On the flipside, Coinbase's (COIN) 4.6% drop over the last week leaves it as the only name in the group that's below its 50-DMA.
(Click on image to enlarge)
More By This Author:
If Alphabet "Missed The AI Boat", What Does That Mean For Microsoft?
A Whipsaw Week
Nvidia and Microsoft: Broken Uptrends?



Comments
Log in or sign up to join the conversation.