
Home prices are still too unaffordable.

Existing home sales have had no traction since declining to this level in October of 2022.
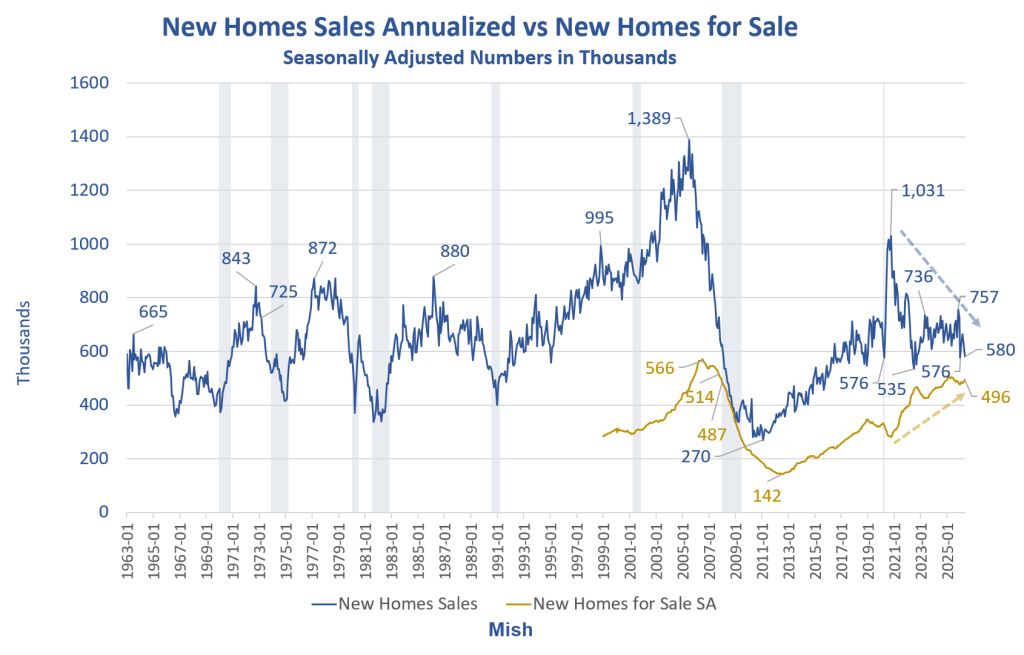
Mortgage rates peaked at 7.62 percent in October 2023 over two years ago.
The National Association or Realtors reports Existing-Home Sales Rise 1.7 Percent in February following a 5.9 percent decline in January.
Existing-home sales increased by 1.7% in February 2026. Month-over-month sales rose in the Midwest, South and West, but fell in the Northeast. Year-over-year sales rose in the South and declined in the Northeast, Midwest and West.
“Housing affordability is improving, and consumers are responding,” said NAR Chief Economist Dr. Lawrence Yun. “Still, there is a long way to go to return to pre-pandemic levels of transaction activity. There are more than 6 million more jobs than in 2019, yet home sales per year are down by one million. Despite the modest gain in home sales, actual housing demand remains muted relative to wage growth and job gains. Inventory is growing, but sluggishly.”
Existing-Home Sales Month-Over-Month

Key February 2026 Statistics
Sales Month-Over Month: 1.7% increase in existing-home sales—seasonally adjusted annual rate of 4.09 million in February
Inventory Units: 1.29 million units: Total housing inventory, up 2.4% from January and 4.9% from February 2025.
Inventory Supply: 3.8-month supply of unsold inventory, unchanged from last month and up from 3.6 months one year ago.
Sales Year-Over-Year: 1.4% decrease in existing-home sales
Median existing-home price: $398,000: Median existing-home price3 for all housing types, up 0.3% from one year ago ($396,800)—the 32nd consecutive month of year-over-year price increases.
Market Time: 47 days: Median time on market for properties, up from 46 days last month and 42 days in February 2025.
Existing-Home Sales Year-Over-Year

Existing Home Sales Supply

The NAR does not seasonally adjust much of its data as evidenced by the above chart.
Nonetheless, we can see rising supply. But rising supply has not helped sales either.
The only conclusion is home prices are still too damn high.
The labor market is also a concern.
February 2026 Nonfarm Payrolls Change by Sector in Thousands
Nonfarm Payrolls: -92
Manufacturing: -12
Construction: -11
Leisure and Hospitality: -27
Private Education and Health Care: -34
Professional and Business Services: -5
Information: -11
Financial: +10
Retail: +2
Wholesale: +6
Government: -6
For discussion, please see Nonfarm Payrolls Decline by 92,000 in February, Household Data Is Garbage
Given affordability concerns across the board, I fail to see why many people would want to buy homes now. And they aren’t.

Comments
Log in or sign up to join the conversation.