
The National Association of Realtors reports Existing-Home Sales Report Shows 0.2% Increase in April
“Despite mixed macroeconomic signals—including a record-high stock market and historically low consumer confidence—home sales were modestly boosted by the continued improvement in housing affordability,” said NAR Chief Economist Dr. Lawrence Yun. “Mortgage rates are lower from a year ago, and average income growth is outpacing home price gains.”
“Inventory still remains tight,” Yun added. “Multiple offers, though not as intense as a few years ago, are still occurring. At the same time, days on market are lengthening on average, implying that consumers are taking their time before making decisions.”
“The increase in second-home purchases reflects stronger finances among higher-income households, as well as the post-COVID rise in remote work and hybrid job schedules.”
All Noise
These fluctuations for over three years are all random noise.
Homes are not selling because there are not affordable.
Accumulated Wealth Myth
Last month, Yun was yapping about “accumulated wealth”.
No one has accumulated any wealth over this other than landlords who raised rent more than their expenses have gone up, and those who refinanced mortgages at a much lower rate.
Everyone else lost wealth due to rising property taxes, homeowner’s insurance, and HOA fees.
The wealth impact of rising home prices has been negative for many, if not most homeowners, especially those who purchased late in the game and did not refinance lower.
Existing-Home Sales Month-Over-Month
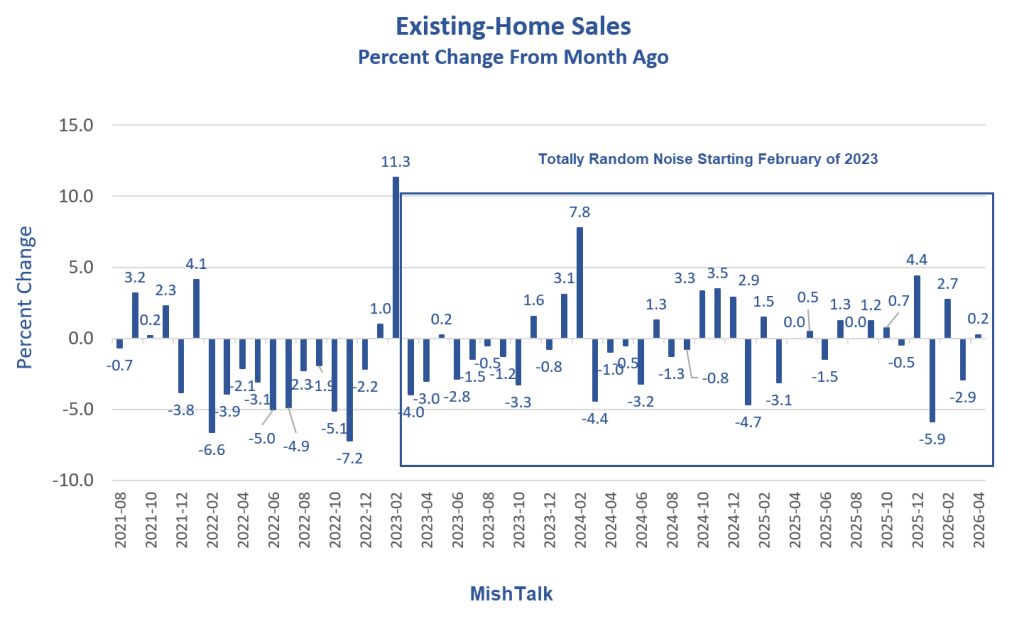
Since March 2023 I count 20 down months, 15 up months, and 2 unchanged months, all of which accumulates to a decline from 4.35 million to 4.02 million.
It’s ridiculous to attribute any meaning to these random month-over-month fluctuations. However, Yun does, every month.
Key March 2026 Statistics
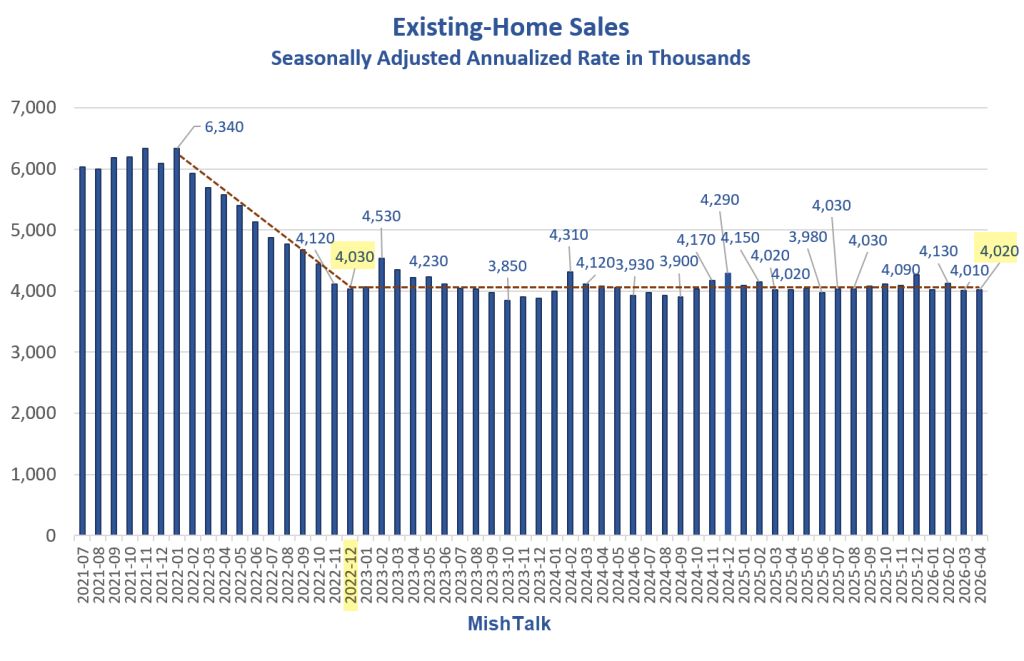
Sales Month-Over-Month: 0.2% increase in existing-home sales month-over-month to a seasonally adjusted annual rate of 4.02 million.
Sales Year-Over-Year: No change in sales year-over-year.
Inventory Units: 1.47 million units: Total housing inventory, up 5.8% from March and 1.4% from April 2025.
Inventory Supply: 4.4-month supply of unsold inventory, up from 4.2 months last month and up from 4.3 months one year ago.
Median existing-home price: $417,700 Median existing-home price for all housing types. 0.9% increase from one year ago ($414,000)—the 34th consecutive month of year-over-year price increases.
Market Time: 32 days: Median time on market for properties, down from 41 days last month, Up from 29 days in April 2025
Median Price
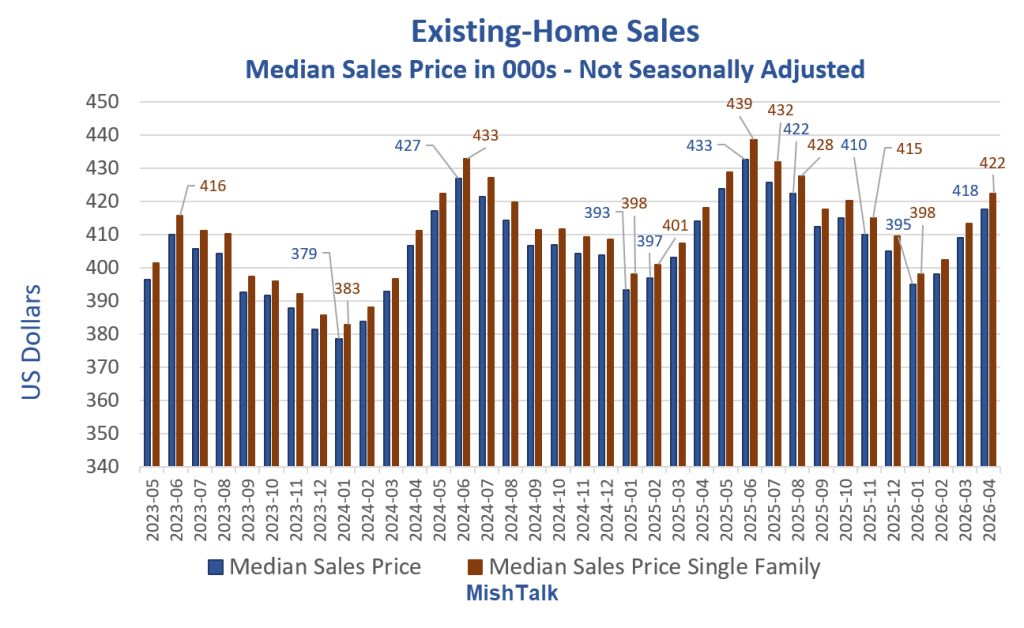
Prices have gone up 34 consecutive months year-over-year.
Existing-Home Sales Year-Over-Year
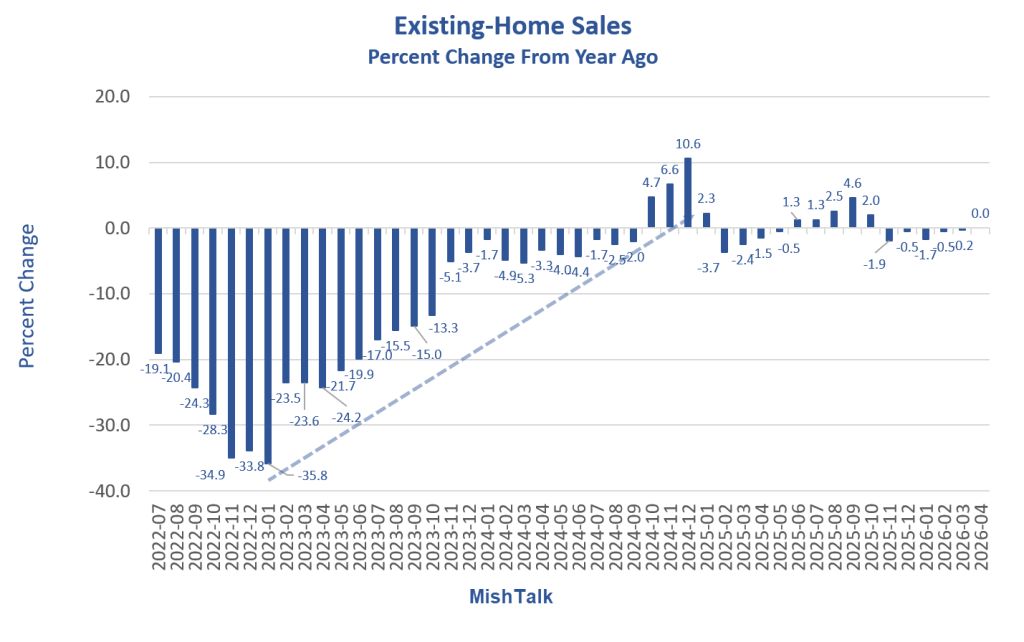
It took many years for year-over-year sales to turn positive.
Sales went negative again in 2025, and have now stabilized at a low rate near 4 million, seasonally adjusted, annualized.
Existing Home Sales Supply
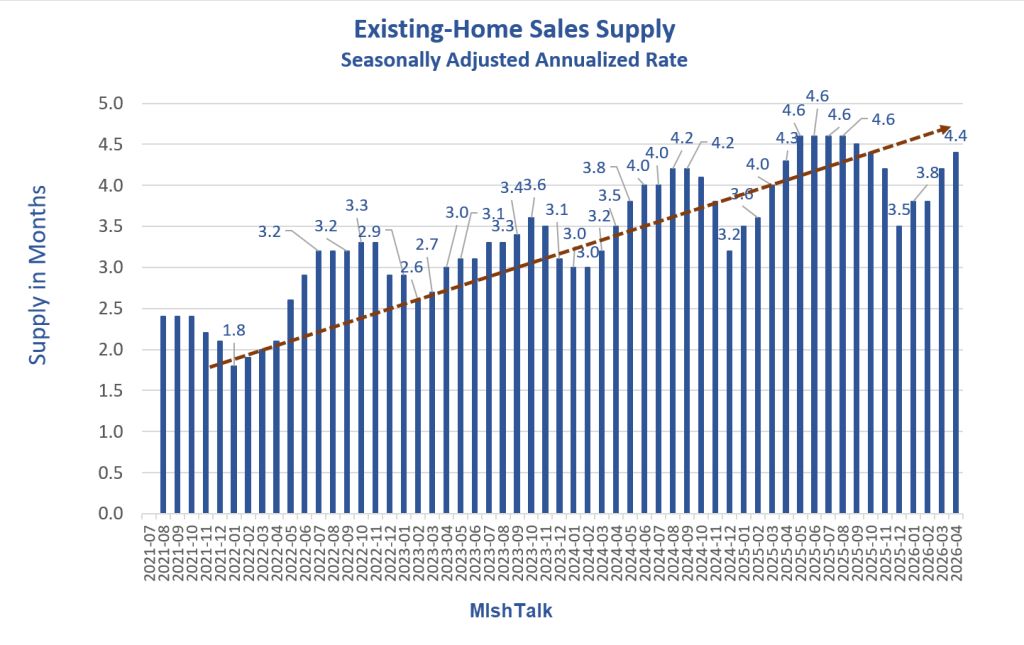
The NAR does not seasonally adjust much of its data.
Nonetheless, we can see rising supply over time. But rising supply has not helped sales.
Existing-Home Sales vs Mortgage Rates
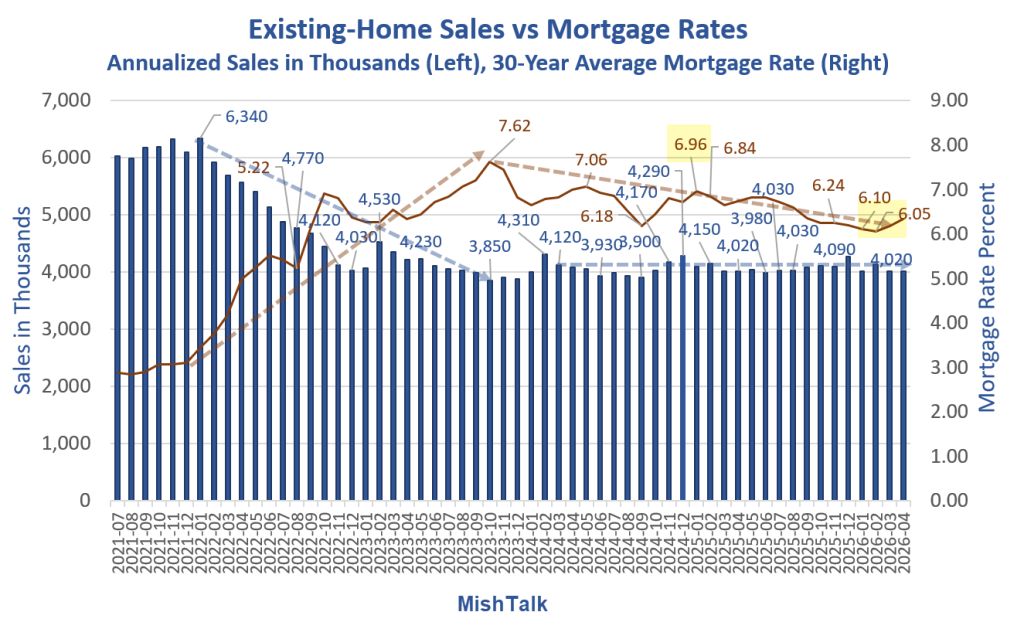
Rising mortgage rates from late 2021 until late 2023 led to rapidly falling sales.
Since then, ignoring minor fluctuations, sales have basically gone nowhere even as rates fell from 7.62 percent to 6.05 percent.
But rates have risen again. The current Mortgage News Daily rate is 6.33 percent.
MND is more accurate than the Freddie Mac data in my chart because it includes points and fees. I use Freddie Mac data because I have a download from the St. Louis Fed.
The only conclusion is home prices are still too high, mortgage rates are too high, or both.
Jobs and inflation from the war in Iran are also huge concerns.
Trump Says He “Wants to Drive Up Housing Prices”
Pleaser recall Dear Zoomers, Trump Says He “Wants to Drive Up Housing Prices”
Somehow, I doubt Gen Z will like this message.
Is it time to declare success? Demand a Nobel prize for economics? Build a housing statue?
Related Posts
April 9, 2026: Inflation Has Been Above the Fed’s Target for 5 Straight Years
The Fed’s preferred measure of inflation has been above 2 percent since March of 2021.
May 8, 2026: Consumer Sentiment Falls to a Record Low, Consumers Cite Gasoline and Tariffs
Consumers Inflation expectations and overall concerns remain elevated.
May 7, 2026: Whirlpool Sales Plunge, Warns of 4 Percent Price Hikes, Blames Inflation
Whirlpool eliminates its dividend and cut its forecast citing tariffs, inflation, and debt.
May 5, 2026: Manufacturing Is the Biggest Net Loser in Jobs, 5 Quarters Total
Here’s a breakdown of BLS Business Employment Dynamics (BED) by sector.


Comments
Log in or sign up to join the conversation.