

Real spending is up, real Income down from year ago.
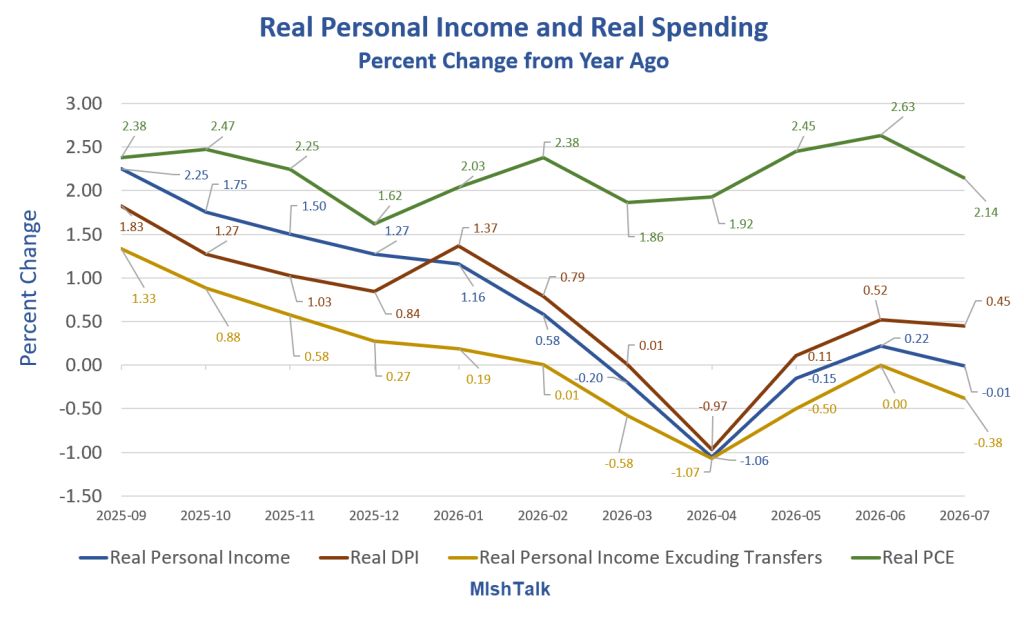
Real Income and Real Spending
Real Personal Income (all sources): -0.01 percent
Real DPI (after taxes): 0.45 percent
Real PI Excluding Transfers : -0.38 percent
Real PCE (Personal Consumption Expenditures): 2.14 percent
Transfer payments are government checks or deposits for which no current services were performed. Social Security, Medicare, Medicaid, and food stamps are examples.
The trend on real PI excluding transfers (yellow line) is not good.
The NBER, the official monitor of recessions, watches real PI excluding transfers. It’s a less than robust -0.38 percent from a year ago.
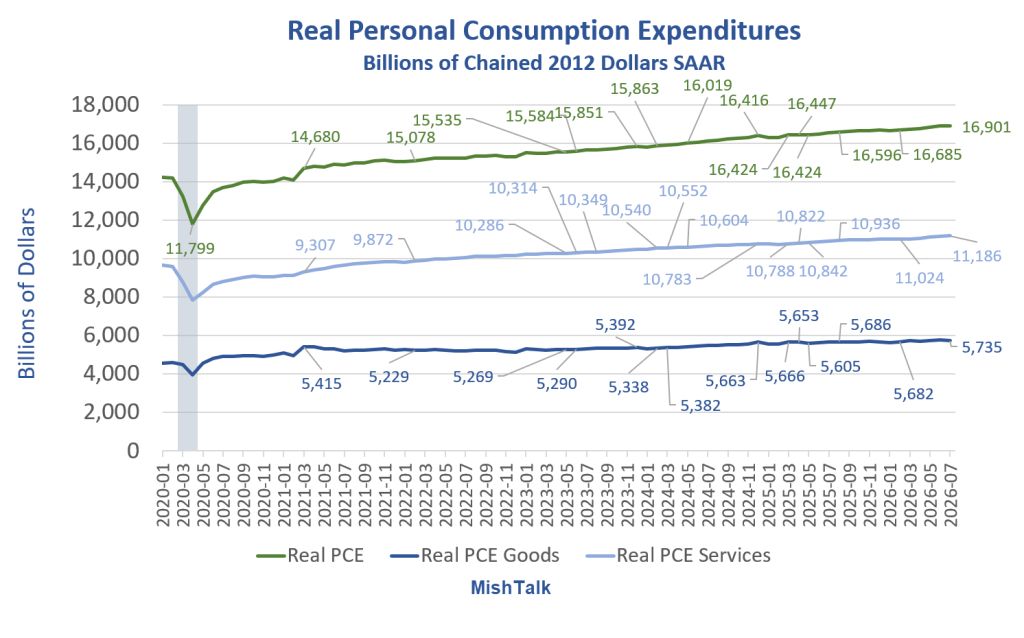
Real Personal Consumption Expenditures
Real Personal Income and Real Disposable Personal Income
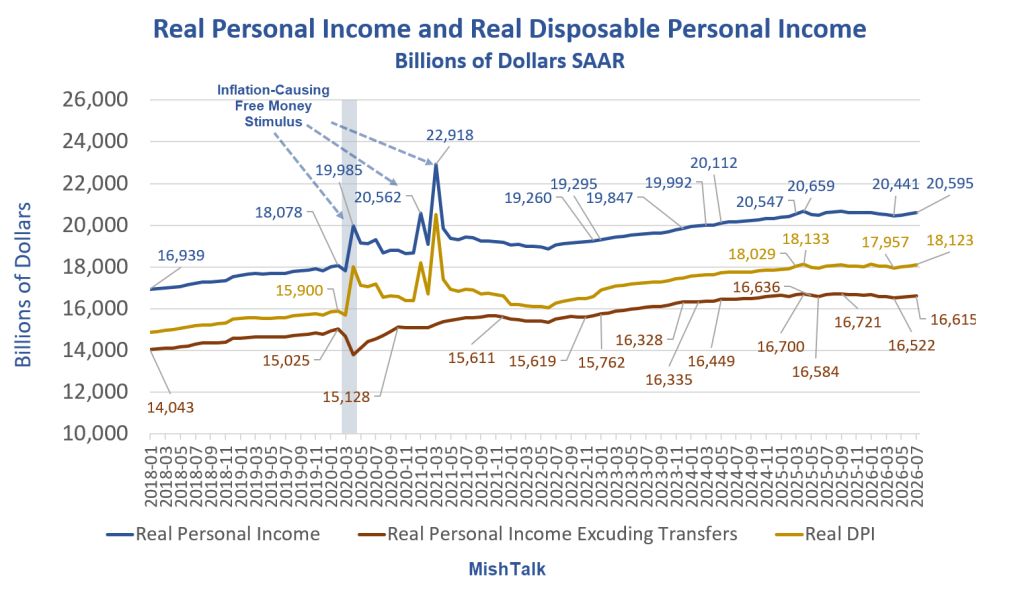
Real Personal Income and Real Disposable Personal Income
Inflation-Causing Stimulus
Three rounds of free money fiscal stimulus, two voted under Trump, and the third totally unwarranted round under Biden unleashed a lengthy bout of nasty inflation.
The Fed compounded the error by slashing interest rates to zero percent.
Mortgage rates dropped below three percent and everybody with a mortgage refinanced putting still more spending money in the pockets of everyone with a mortgage.
The Fed never admitted its role in this massive inflationary boom.
Personal Income and Real Personal Income
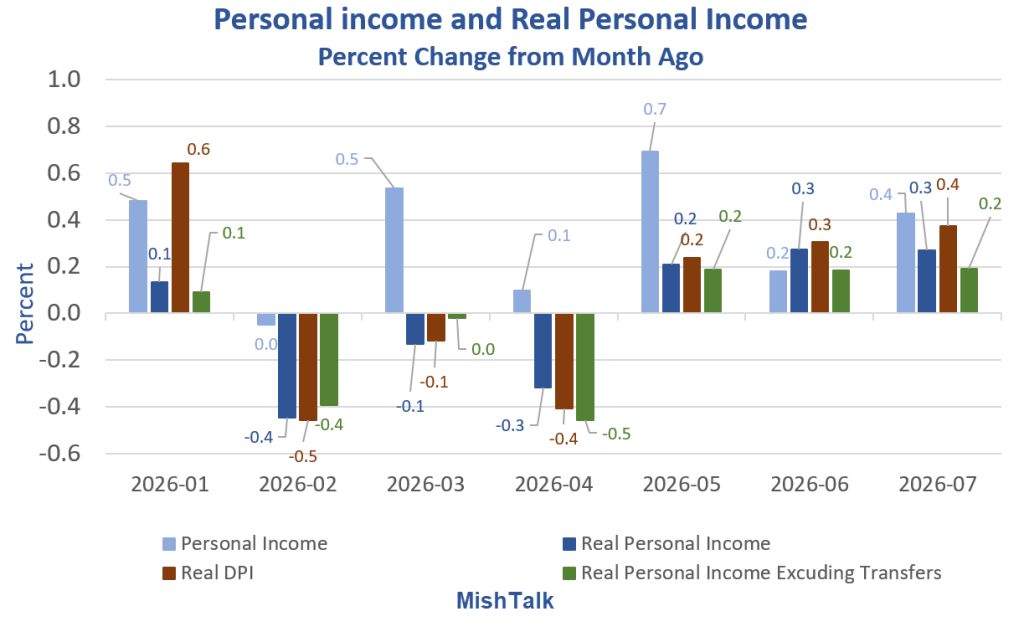
Personal Income and Real Personal Income Percent Change
Personal Income: 0.37 percent
Real Personal Income: 0.27 percent
Real Personal Income Excluding Transfers: 0.19 percent
Real DPI: 0.37 percent
Everything got rounded up a bit.
For the past three months, Transfer payments have has been a significant component of real personal income.
PCE Inflation on the Hot Side, Lack of Progress in Pictures
In case you missed it, please see PCE Inflation on the Hot Side, Lack of Progress in Pictures
PCE Year-Over-Year Inflation Details
PCE: 3.7 percent, bottomed at 2.3 percent in September 2024
PCE Goods: 3.7 percent, bottomed at -1.2 percent in September 2024
PCE Services: 3.7 percent, bottomed at 3.4 percent in October 2025
PCE Core: 3.3 percent, bottomed at 2.6 percent in April of 2025
Click above link for three charts and discussion.


Comments
Log in or sign up to join the conversation.