


Image Source: Pixabay
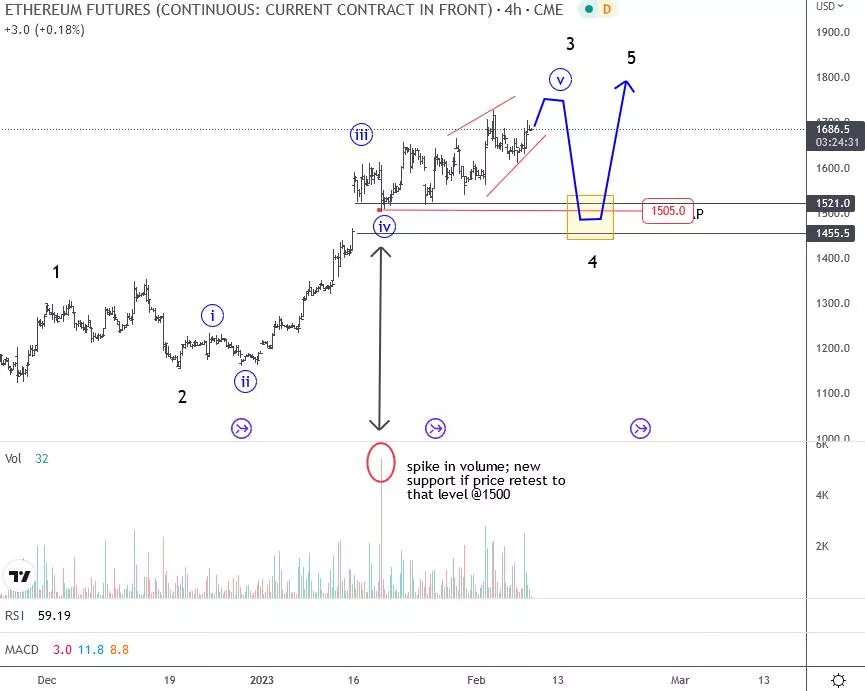
On February 8th, we spotted a completion of wave 3 in the Ethereum CME Futures chart and warned about a pullback into wave 4 before the uptrend for wave 5 resumes. We also mentioned and highlighted nice GAP support around the 1500 – 1450 zone.
Ethereum Futures 4H Chart From February 8
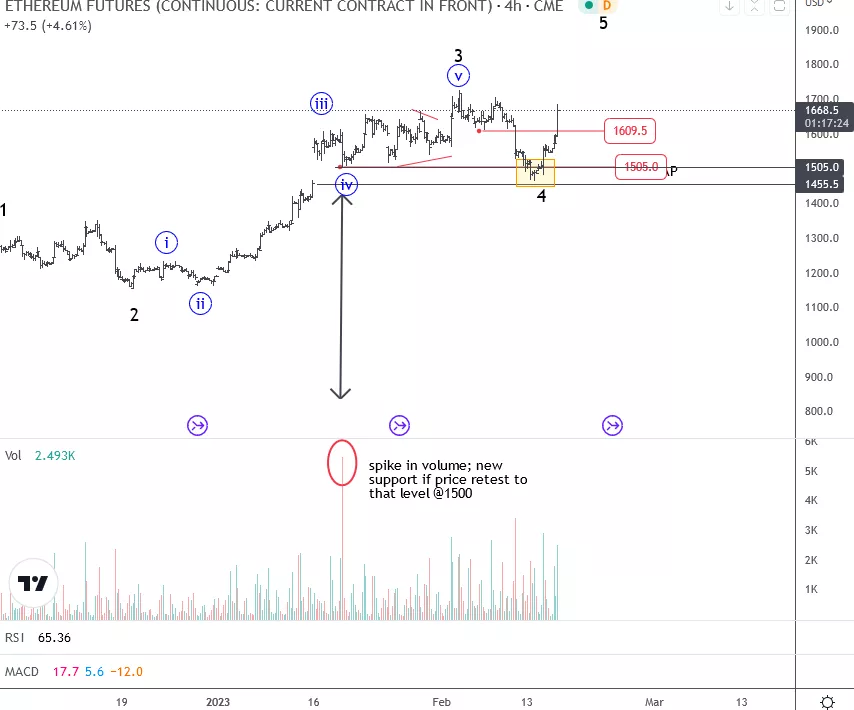
As you can see, on February 15th, Ethereum nicely slowed down into the projected support zone for wave 4, from where we have seen a sharp reversal and strong recovery that signals a continuation higher within wave 5.
Ethereum Futures 4H Chart From February 15
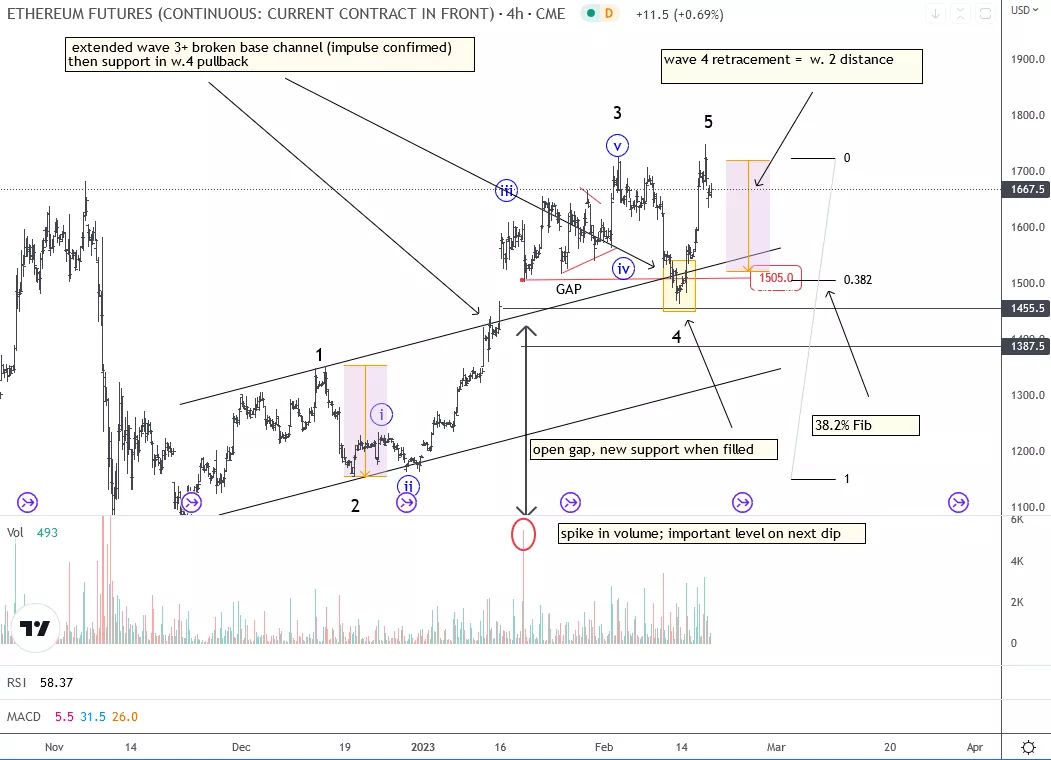
Of course, today February 17th, Ethereum is already at the highs for wave 5 as expected. However, in Elliott Wave theory after every five waves, we should be aware of a higher degree A-B-C correction before the uptrend resumes.
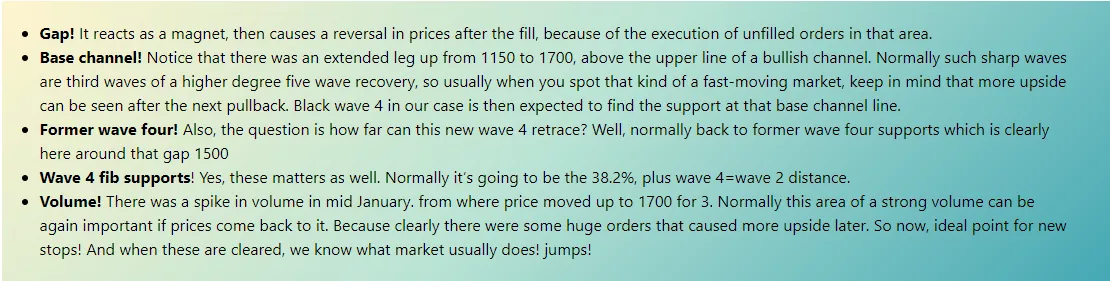
So what was the reason for that 1450-1500 important support? There were a few factors:



Comments
Log in or sign up to join the conversation.