

Image Source: Arturo Añez on Unsplash
The stock market continues to disappoint. However, there are some encouraging signs that a short-term rally may be brewing.
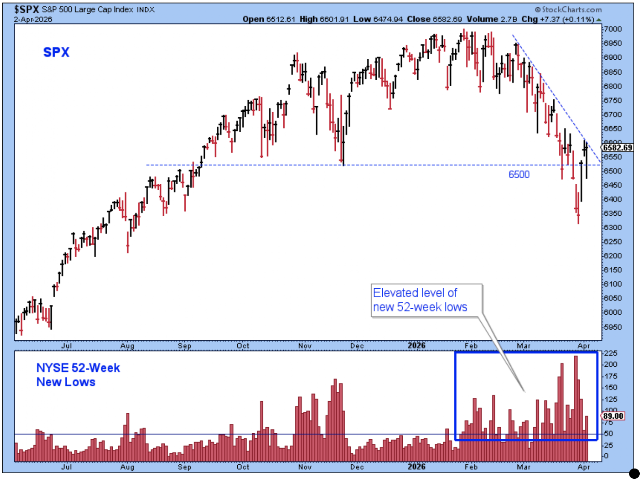
The market certainly looked shaky late last week, but the Tuesday, Wednesday, and Thursday sessions closed near their respective highs despite the continued strength in the price of oil.
Next week, we will be looking for the SPX to continue to close near the sessions highs, and to break the sharp downtrend line that dates back to mid-February. Also, equally important will be to see the number of NYSE new 52-week lows settle down below the 50-level.
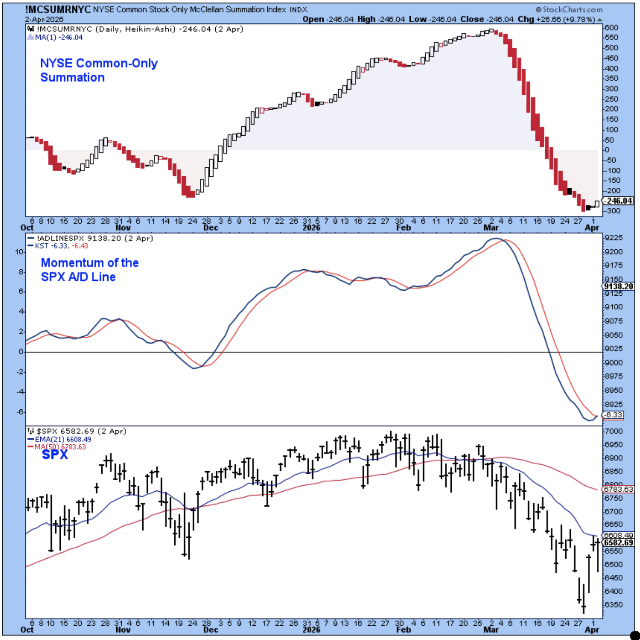
The next chart shows more evidence of strength appearing later in the week. The two momentum indicators seem to be starting to curl higher, and the SPX is testing its 21-day EMA.
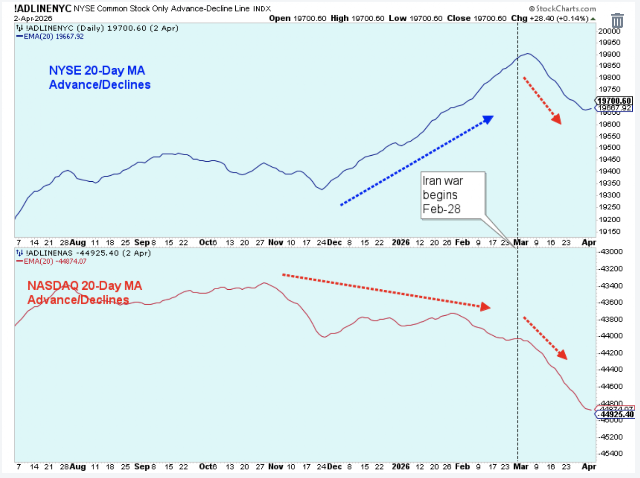
The NYSE advance/declines may be getting ready to move higher, although the Nasdaq isn't showing much yet.
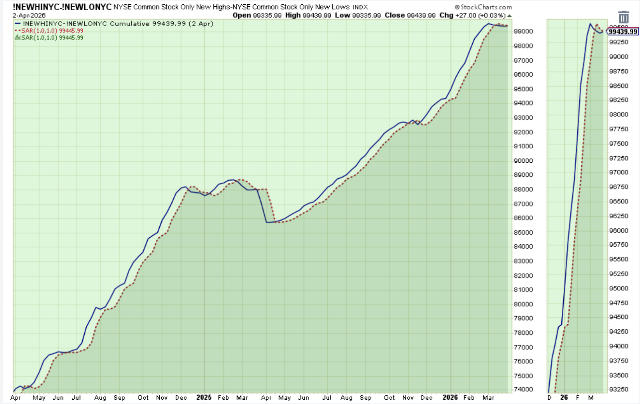
We are going through a real tough time in the market, yet this indicator is just barely negative. I think it means that, behind the scenes, the market internals aren't as bad as expected if you just watch the major indexes. I'm not at all sure about this, but the following chart definitely argues in favor of not being entirely out of the market.
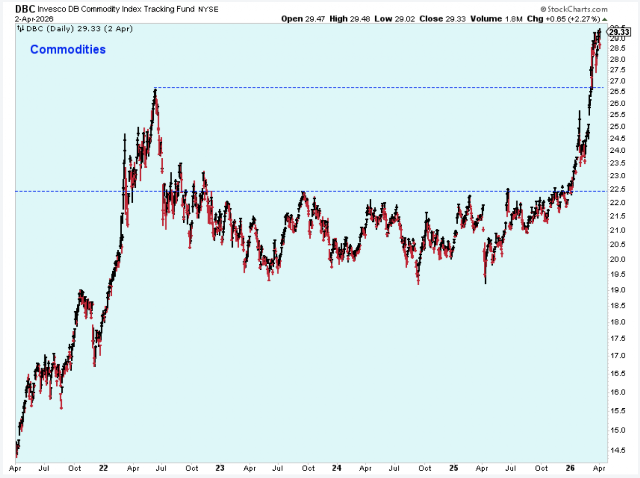
This commodity ETF started breaking higher late last year, and then it went straight up when oil prices joined the other commodities by moving to new price highs.
Obviously, this chart works against Fed rate cuts because it is inflationary, etc., but it favors the stocks that benefit from higher commodity prices -- and works against technology stocks.
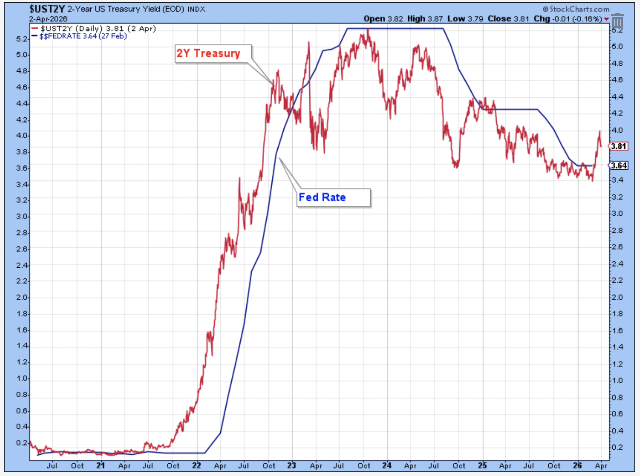
Meanwhile, higher commodity prices are helping to move Treasury yields higher. This chart shows that Fed Funds rates follow the direction of the 2-year Treasury yield.
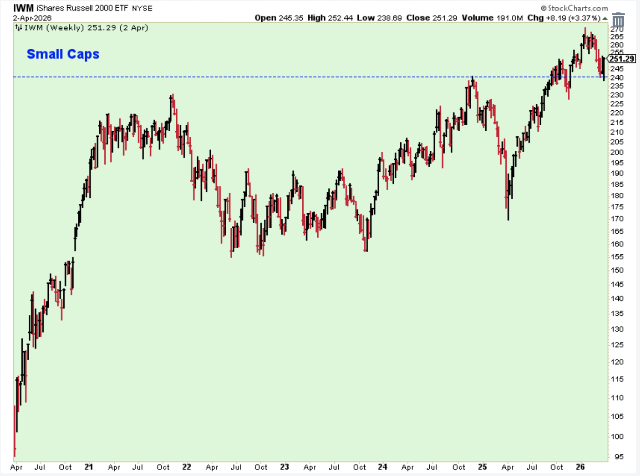
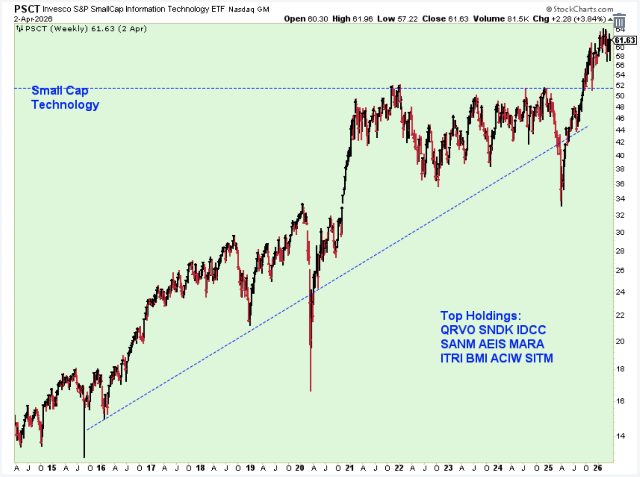
All sectors except the energy sector were hurt during March, but there have been some areas that weren't battered as much as expected, and if I were ready to buy stocks, these are the sectors I would be looking at.
The small-caps pulled back, but the pullback occurred after a very nice run higher, and prices only pulled back to the breakout level, which keeps the uptrend intact. This chart looks good to me.
This is a real surprise to me, but the small-cap technology ETF also looks really good. It's been volatile, but prices have been holding near the highs. This is a bullish indicator.
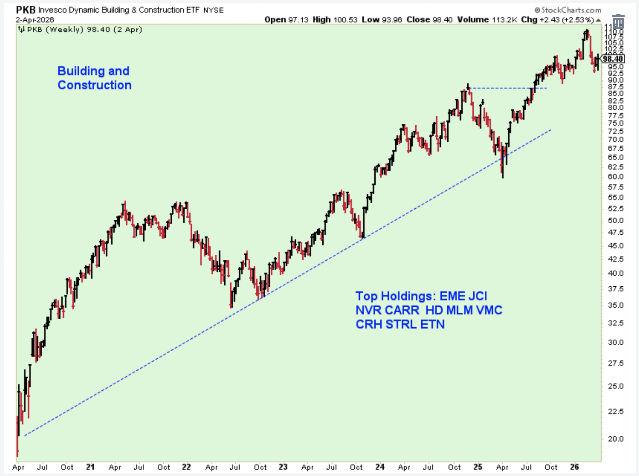
The building and construction industrials have held up decently as well. Initially, there was a sharp decline in the following ETF, but it held at support, and now the chart looks decent.
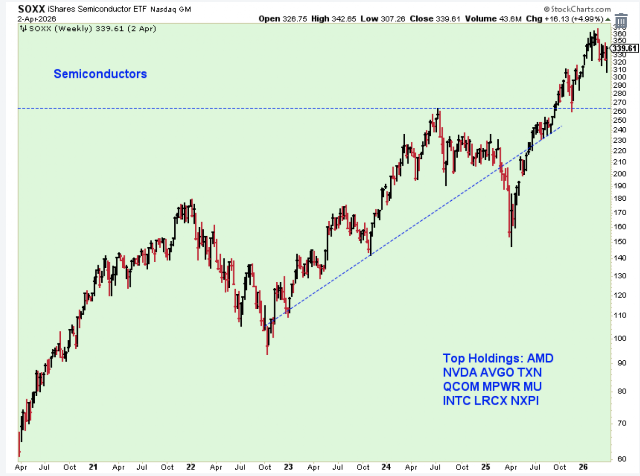
Semiconductors also look good, and they could easily resume their market leadership from this level.
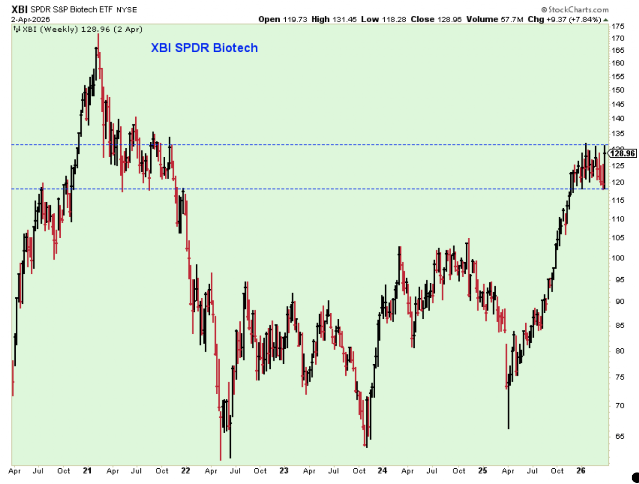
Biotech looks to be in the process of building a bullish flag pattern that could provide a healthy breakout.
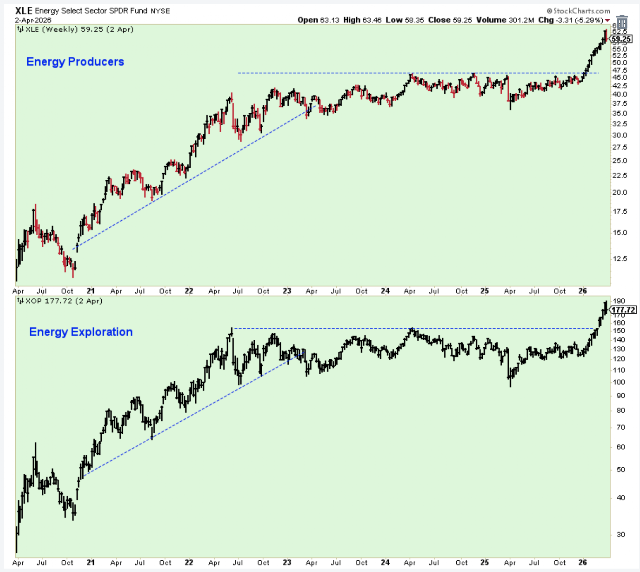
Energy stocks will likely pull back in April, but I think this next chart shows that, longer-term, energy stocks should be held. These are multi-year breakouts.
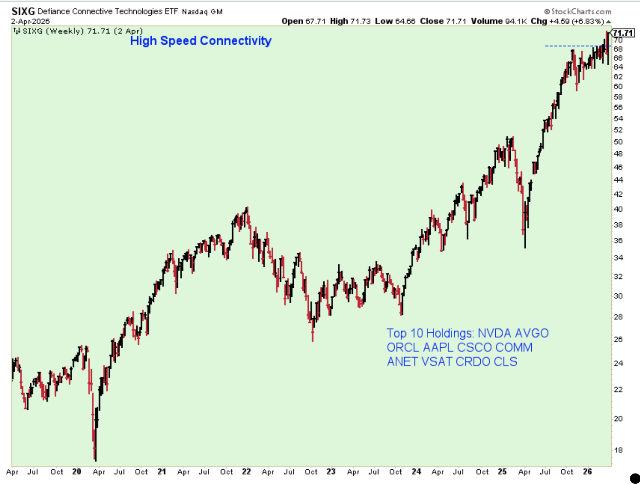
Meanwhile, this technology ETF is already breaking to new highs. This is another bullish indicator.
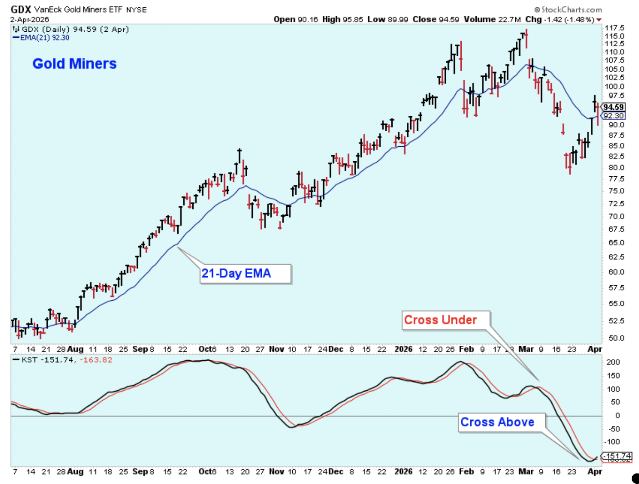
Gold stocks were hit hard late in March, but there could be a nice short-term move higher among these stocks.
Outlook Summary
The medium-term trend is neutral for Treasury bond prices.


Comments
Log in or sign up to join the conversation.