

OReilly Automotive Inc., Elliott Wave Technical Analysis

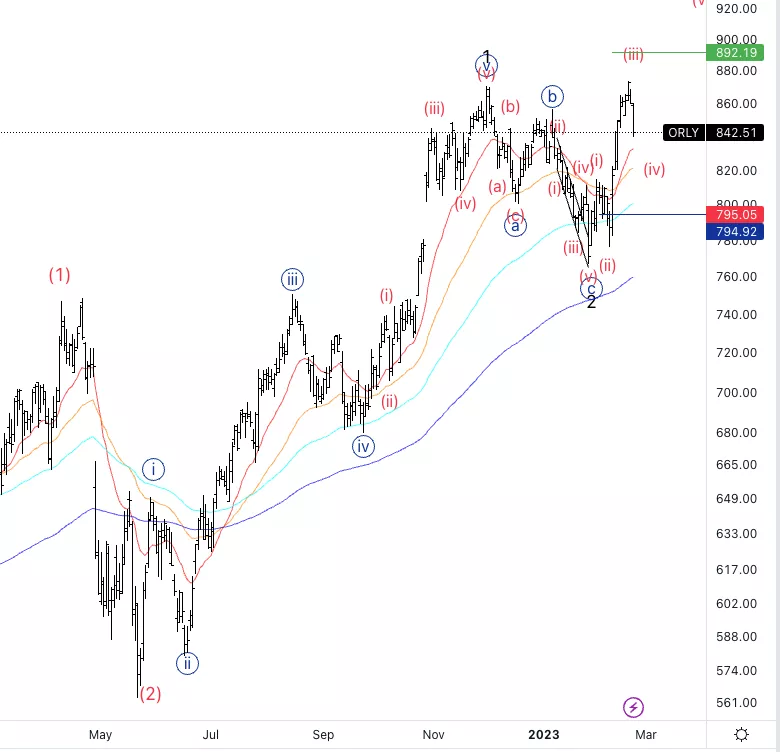
OReilly Automotive Inc., (ORLY): Daily Chart, February 23.
ORLY Stock Market Analysis: It seems we topped in wave (iii) after breaking the previous top of wave {b}, looking for further upside into wave (iv).
ORLY Elliott Wave Count: Wave (iv) of {i}.
ORLY Technical Indicators: Above all averages.
ORLY Trading Strategy: Looking for a bottom in wave (iv) to then potentially add longs.
TradingLounge Analyst: Alessio Barretta
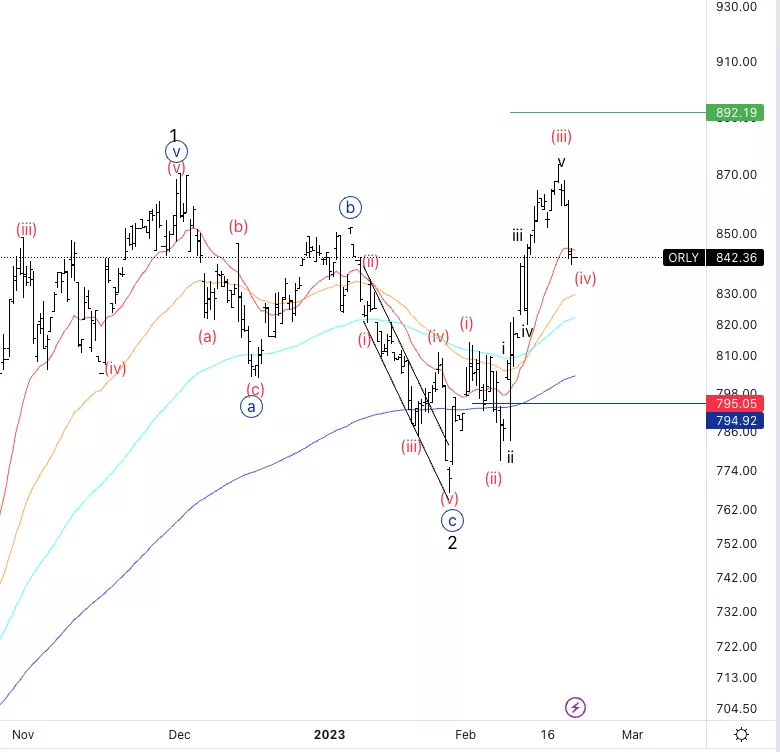
OReilly Automotive Inc., ORLY: 4-hour Chart, February 23.
OReilly Automotive Inc., Elliott Wave Technical Analysis
ORLY Stock Market Analysis: Looking for a wave (iv) to be sideways, therefore we could have just ended wave a and I would now like to see a sideways movement.
ORLY Elliott Wave count: Wave (iv) of {i}.
ORLY Technical Indicators: 20EMa as support.
ORLY Trading Strategy: Looking for a bottom in wave (iv) to then potentially add longs.
More By This Author:
Polkadot /U.S.dollar (DOTUSD) Elliott Wave Technical Analysis
Elliott Wave Technical Analysis: Zoom Video Communications Inc. - Wednesday, Feb. 22
Elliott Wave Technical Analysis: AAVE Token / U.S. Dollar



Comments
Log in or sign up to join the conversation.