Elliott Wave Technical Analysis: AAVE Token / U.S. Dollar

Image Source: Pixabay
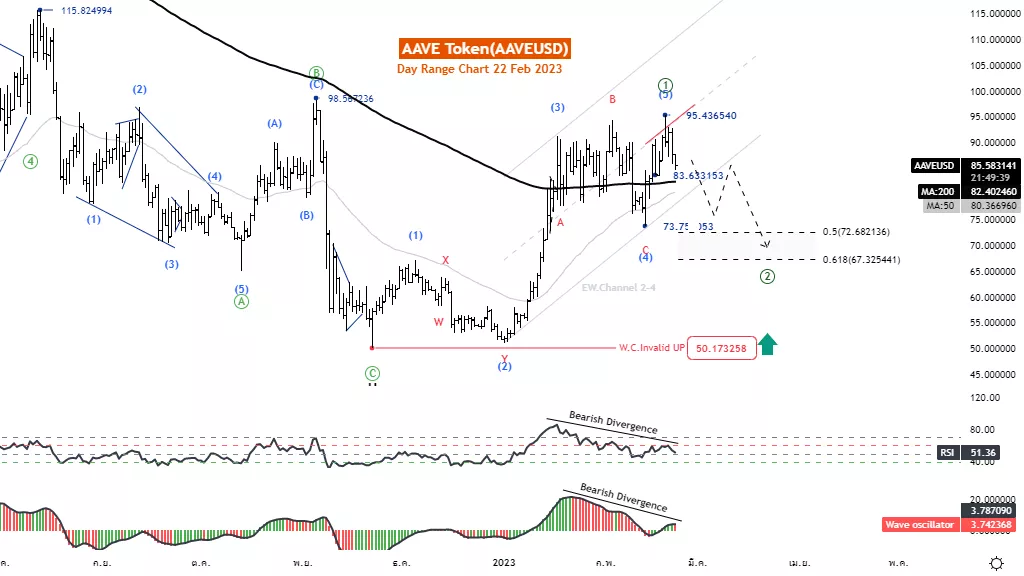
Elliott Wave Analysis TradingLounge Daily Chart, 22 February 2023.
AAVE Token / U.S. Dollar (AAVEUSD)
AAVEUSD Elliott Wave Technical Analysis
Function: Follow trend
Mode: Motive
Structure: Impulse
Position: Wave ((5))
Direction Next higher Degrees: Wave ((2)) of Motive
Details: Wave (5) tends to end. This idea will be confirmed when the price goes below 73.759.
Wave Cancel invalid Level: 50.173
AAVE Token / U.S. Dollar (AAVEUSD) Trading Strategy: AAVE Token tends to correct in wave((2)) after wave((1)) is likely to end at the level of 95.436 after the internal sub-wave of wave((1)) completes five more waves. Both the RSI and the Wave Oscillator signaling a bearish divergence support this idea. Watch out for reversals in waves ((2)).
AAVE Token / U.S. Dollar (AAVEUSD) Technical Indicators: The price is above the MA200 indicating an Uptrend. The wave oscillators above Zero-Line momentum are bullish.
TradingLounge Analyst: Kittiampon Somboonsod

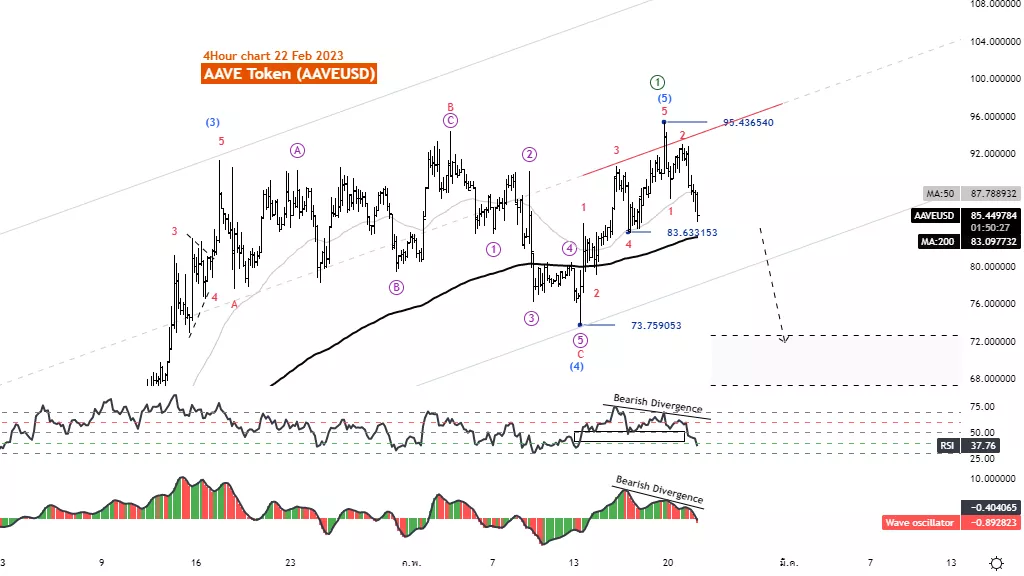
Elliott Wave Analysis TradingLounge 4H Chart, 22 February 2023.
AAVE Token / U.S. Dollar (AAVEUSD)
AAVEUSD Elliott Wave Technical Analysis
Function: Follow trend
Mode: Motive
Structure: Impulse
Position: Wave ((5))
Direction Next higher Degrees: Wave ((2)) of Motive
Details: Wave (5) tends to end. This idea will be confirmed when the price goes below 73.759.
Wave Cancel invalid Level: 95.43
AAVE Token / U.S. Dollar (AAVEUSD) Trading Strategy: AAVE Token tends to correct in wave((2)) after wave((1)) is likely to end at the level of 95.436 after the internal sub-wave of wave((1)) completes five more waves. Both the RSI and the Wave Oscillator signaling a bearish divergence support this idea. Watch out for reversals in waves ((2)).
AAVE Token / U.S. Dollar (AAVEUSD) Technical Indicators: The price is above the MA200 indicating an uptrend. The wave oscillators below Zero-Line momentum are Bearish.

More By This Author:
Technical Analysis: US Indices
Elliott Wave Technical Analysis: ASX200, CBA, Iron Ore, China, BHP, RIO, FMG,GOLD, NCM, GDX, DXY, AUDUSD
Elliott Wave Technical Analysis: Starbucks Inc.
Disclosure: As with any trading or investment opportunity there is a risk of making losses especially in day trading or investments that Trading Lounge expresses opinions on. Note: Historical ...
more


