

Photo by Wance Paleri on Unsplash
Zoom Video Communications Inc., Elliott Wave Technical Analysis
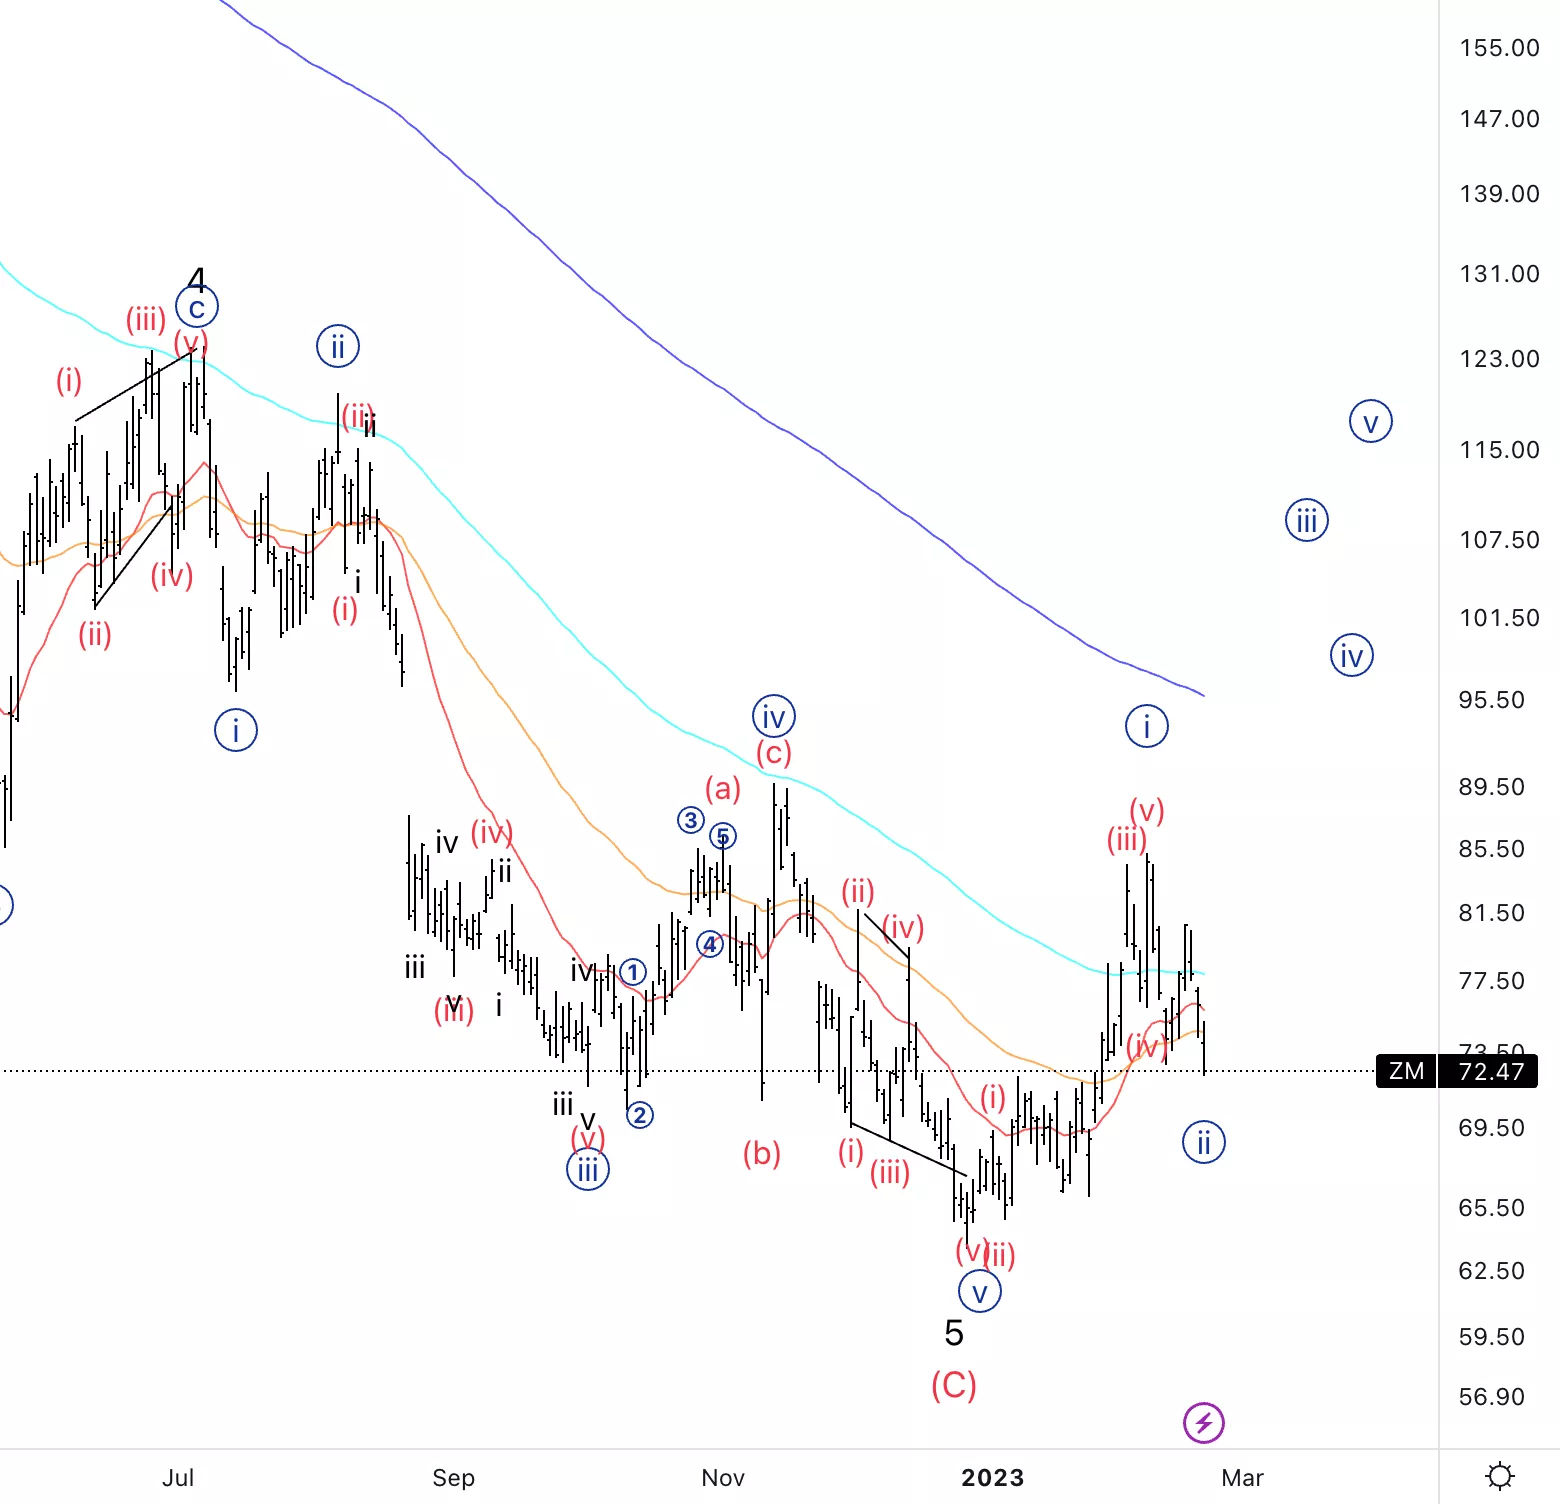
Zoom Video Communications Inc., (Nasdaq: ZM): Daily Chart, 20 February 2023.
ZM Stock Market Analysis: Looking for a potential {i}, {ii} in place to then look for a continuation higher. We come off a five wave move to the downside so this up move could just be corrective in nature, however, there is room for a deep retracement.
ZM Elliott Wave Count: Wave {ii} of A.
ZM Technical Indicators: Below all averages.
ZM Trading Strategy: Looking for a bottom in wave {ii} to then look for longs.
TradingLounge Analyst: Alessio Barretta
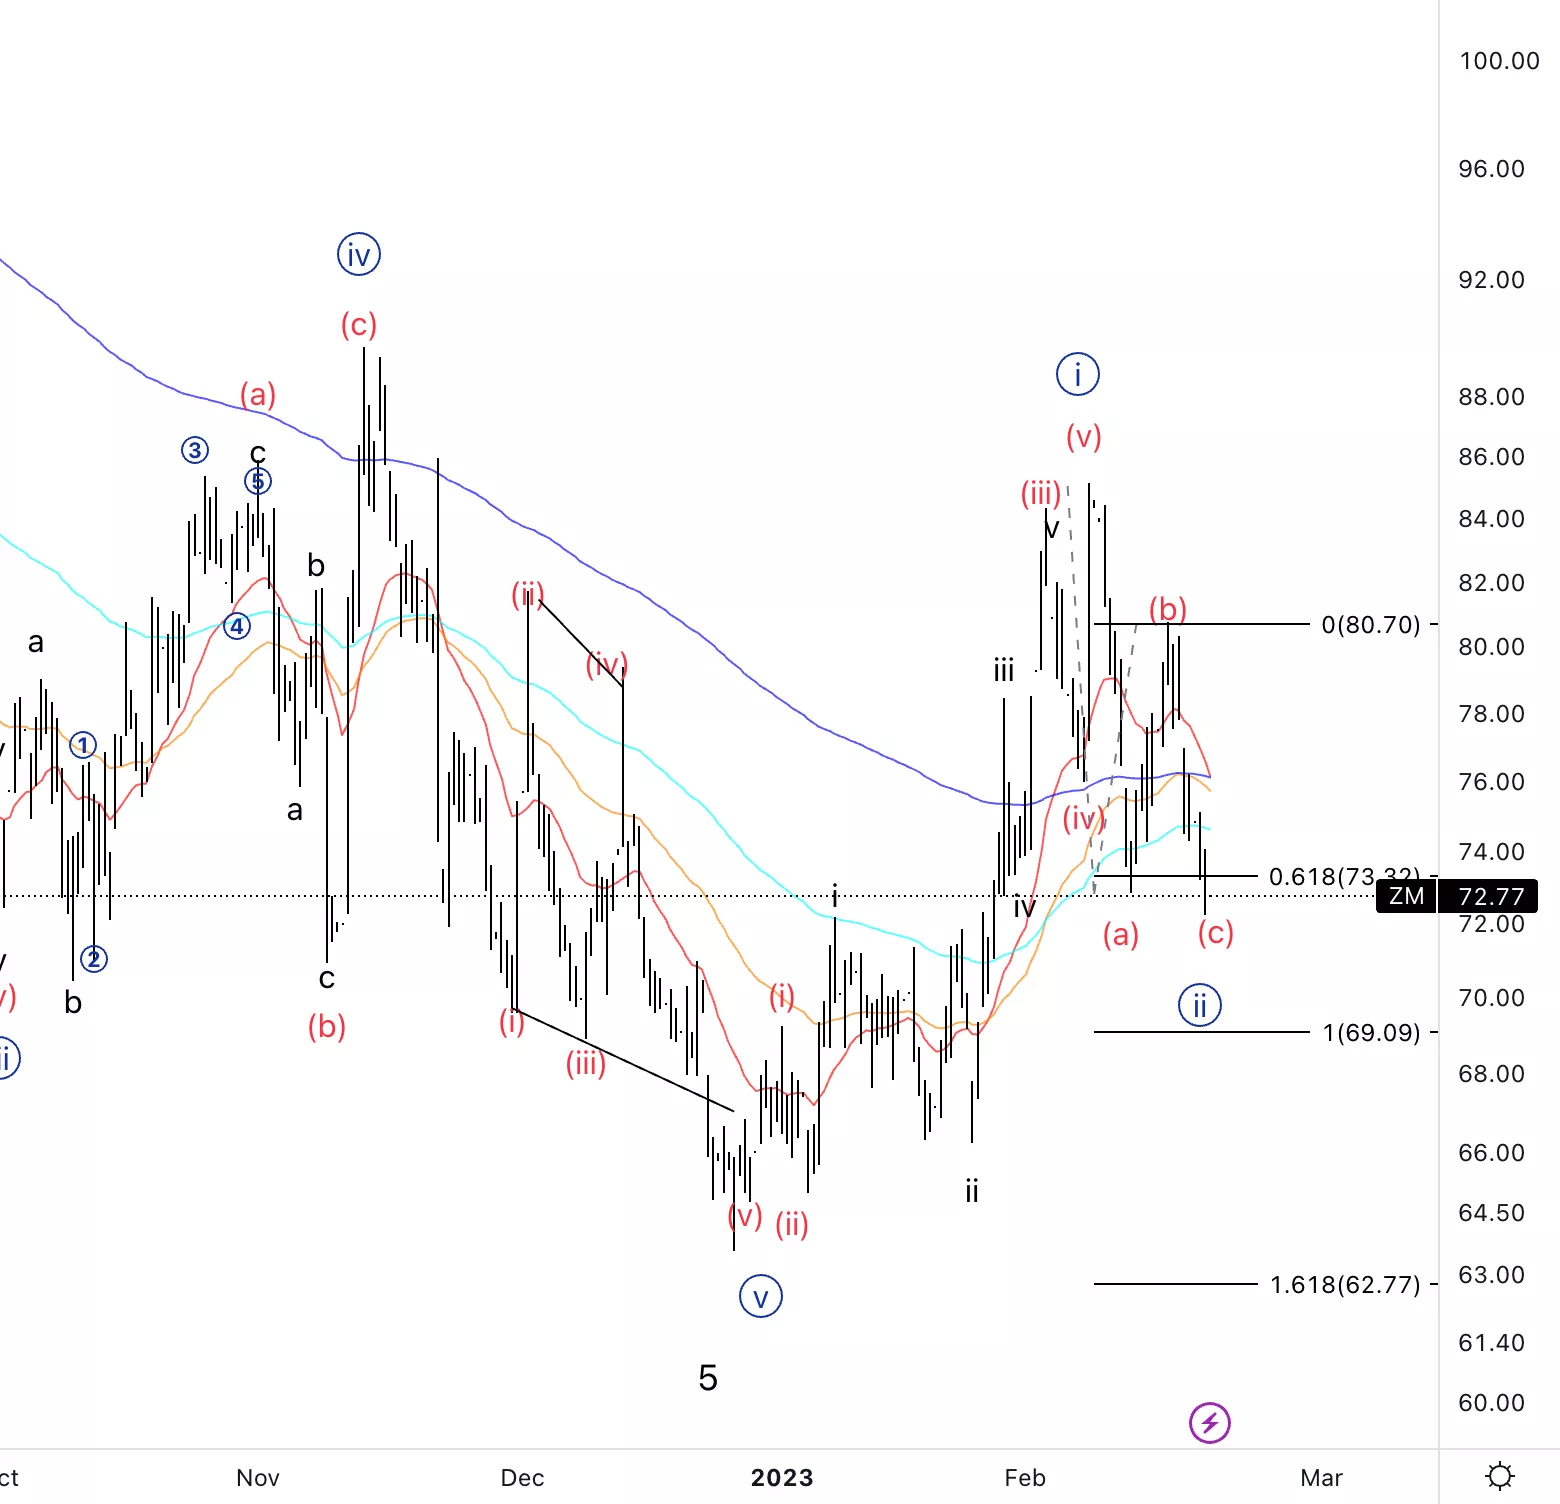
Zoom Video Communications Inc., ZM: 4-hour Chart, 20 February 2023.
Zoom Video Communications Inc., Elliott Wave Technical Analysis
ZM Stock Market Analysis: We could continue lower into wave (c) as we just approached 0.618 (c) vs (a) and we could reach equality.
ZM Elliott Wave count: Wave (c) of {ii}.
ZM Technical Indicators: 20 and 200EMA crossing which is often time a sign of reversal.
ZM Trading Strategy: Looking for a bottom in wave {ii} to then look for longs.
More By This Author:
Elliott Wave Technical Analysis: AAVE Token / U.S. Dollar
Technical Analysis: US Indices
Elliott Wave Technical Analysis: ASX200, CBA, Iron Ore, China, BHP, RIO, FMG,GOLD, NCM, GDX, DXY, AUDUSD


Comments
Log in or sign up to join the conversation.