
NEO (NEOUSD)

NEOUSD Elliott Wave Technical Analysis
Function: Follow trend
Mode: Motive
Structure: Impulse
Position: Wave (2)
Direction Next higher Degrees: Wave ((1)) of Motive
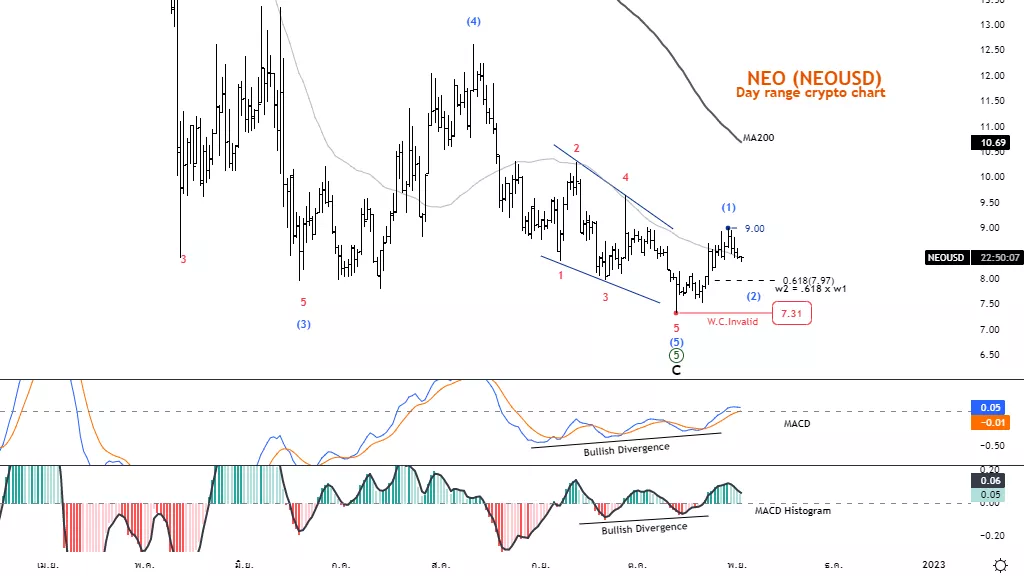
Details: The decrease of the sub-second wave in wave ((1)) is usually .618 x the length of the first wave.
Wave Cancel invalid Level: 7.31
NEO (NEOUSD) Trading Strategy: The previous downtrend had an opportunity to end as wave C ended, and the price rose above the MA50 line with an impulse pattern in wave 1 and reversing in wave 2 as an opportunity to join another uptrend in time.
NEO (NEOUSD) Technical Indicators: MACD and MACD Histogram has a bullish divergence. The price has a chance to turn into an Uptrend.
Tradinglounge analyst : Kittiampon Somboonsod
Source : Tradinglounge.com Get Trial Here!
NEO (NEOUSD)
NEOUSD Elliott Wave Technical Analysis
Function: Follow trend
Mode: Motive
Structure: Impulse
Position: Wave (2)
Direction Next higher Degrees: Wave ((1)) of Motive
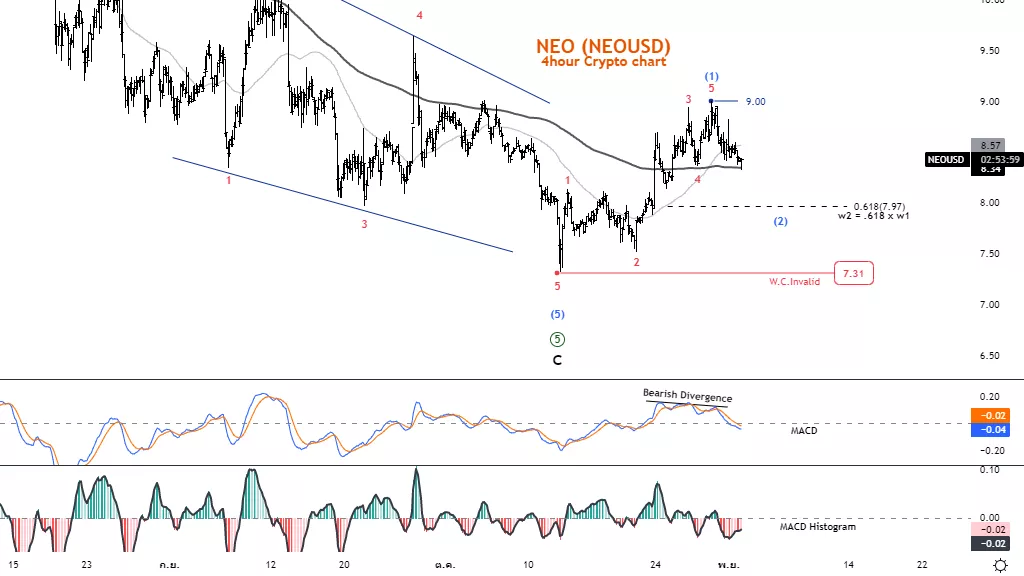
Details: The decrease of the sub-second wave in wave ((1)) is usually .618 x the length of the first wave.
Wave Cancel invalid Level: 7.31
NEO (NEOUSD)) Trading Strategy: A short retracement in wave 2 is usually .618 x the length of wave 1. Upon completion, the price will rise again in an uptrend as an opportunity to open a long position, but the price must not reverse below 7.31.
NEO (NEOUSD) Technical Indicators: MACD bearish divergence a short-term the price trend. Throwback.
More By This Author:
Elliott Wave Technical Analysis: Analog Devices Inc.
Elliott Wave Technical Analysis: Bitcoin, Nov. 1
Elliott Wave Technical Analysis: Honeywell International Inc., Oct. 31


Comments
Log in or sign up to join the conversation.