
CostCo Wholesale Corp., Elliott Wave Technical Analysis

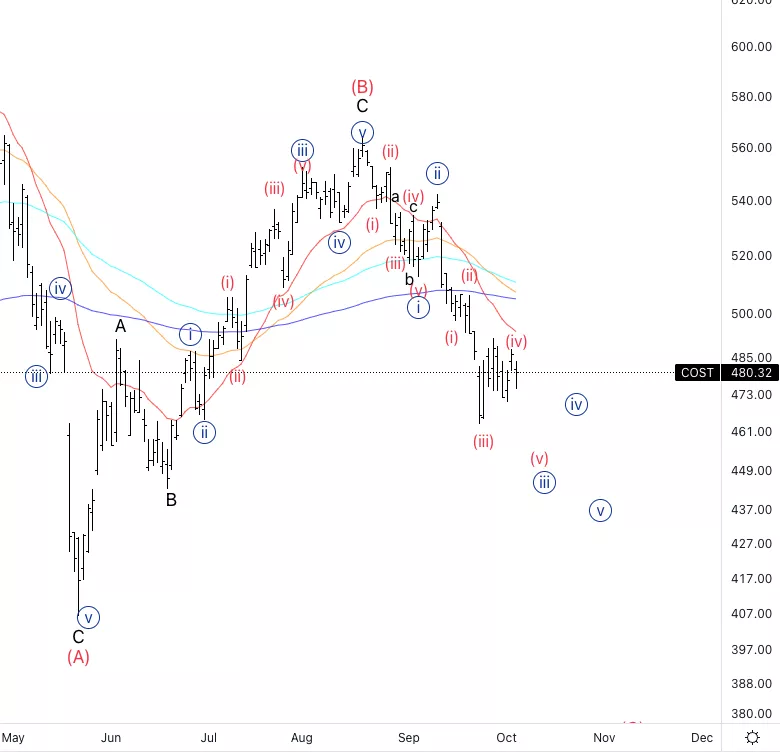
Costco Wholesale Corp., (COST): Daily Chart, October 6 2022,
COST Stock Market Analysis: Moving lower as expected, looking for further downside as next support level is represented by wave B on the left.
COST Elliott Wave count: (iv) of {iii}
COST Technical Indicators: We are below all averages
COST Trading Strategy: Looking to short on wave (iv) knowing the downside is limited and with a stop on invalidation level above wave (i).
TradingLounge Analyst: Alessio Barretta
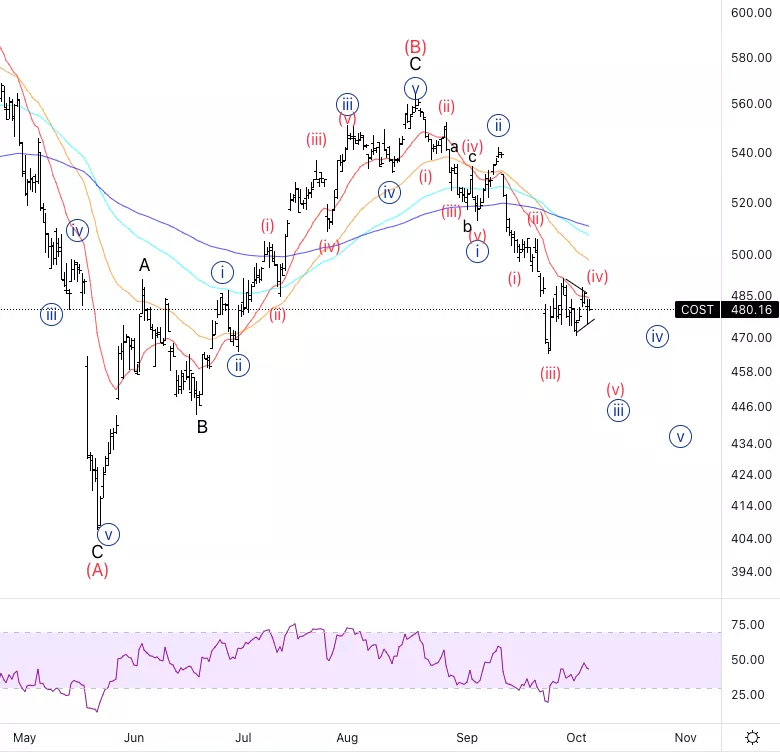
Costco Wholesale Corp., COST: 4-hour Chart, October 6 2022
Costco Wholesale Corp., Elliott Wave Technical Analysis
COST Stock Market Analysis: Potential triangle in wave (iv) as we look for further downside with RSI bullish divergence which could explode after wave (v).
COST Elliott Wave count: (iv)
COST Technical Indicators: We are using the 20EMA as resistance as well we are starting to form RSI divergence.
COST Trading Strategy: : Looking to short on wave (iv) knowing the downside is limited and with a stop on invalidation level above wave (i).
More By This Author:
Elliott Wave Technical Analysis: Uniswap, Oct. 6
S&P 500 Elliott Wave Technical Analysis
CSX Corporation, Elliott Wave Technical Analysis October 5 2022


Comments
Log in or sign up to join the conversation.