

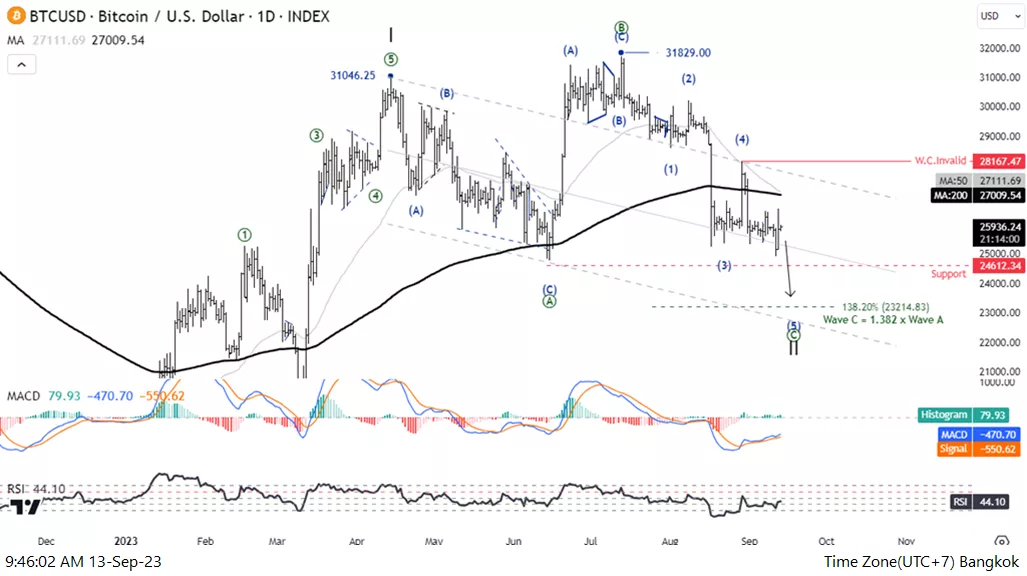
Elliott Wave Analysis TradingLounge Daily Chart, 13 September 2023.
Bitcoin/U.S. Dollar(BTCUSD)
BTCUSD Elliott Wave Technical Analysis
Function: Counter Trend
Mode: Corrective
Structure: Flat
Position: Wave((C))
Direction Next higher Degrees: Wave II of Motive
Wave Cancel invalid level: 28167.47
Details: Five-wave extension of wave C is likely to be below 24612
Bitcoin/U.S. Dollar(BTCUSD) Trading Strategy: Bitcoin overview is still in a downtrend, as the price is below MA200 and wave C is not complete The price has a trend move to 23214.83 which is a 138.2% level of wave A
Bitcoin/U.S. Dollar(BTCUSD) Technical Indicators: The price is below the MA200 indicating a downtrend. MACD and RSI have a bearish momentum.
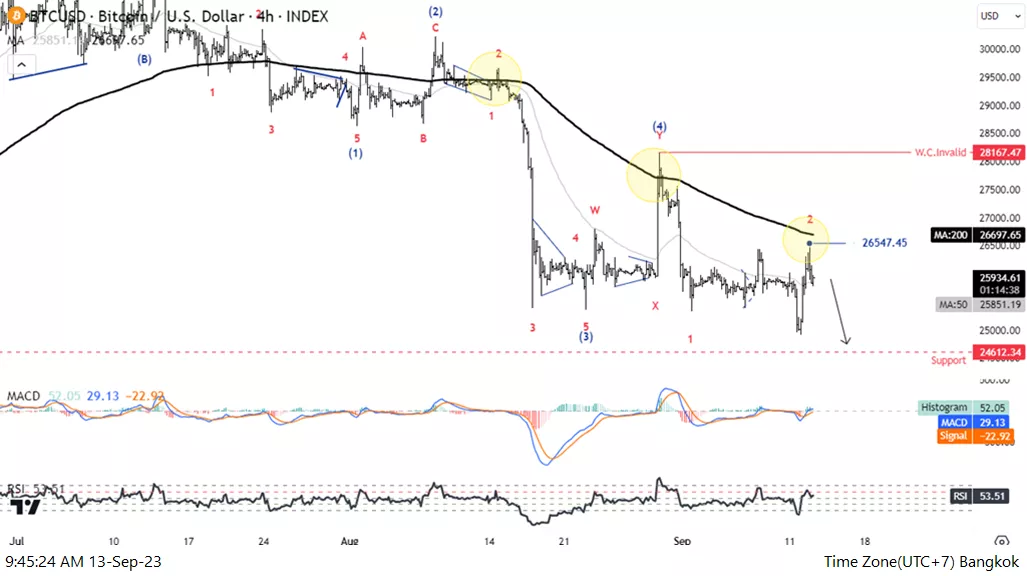
Elliott Wave Analysis TradingLounge 4H Chart, 13 September 2023.
Bitcoin/U.S. Dollar(BTCUSD)
BTCUSD Elliott Wave Technical Analysis
Function: Counter Trend
Mode: Corrective
Structure: Flat
Position: Wave((C))
Direction Next higher Degrees: wave II of Motive
Wave Cancel invalid level: 28167.47
Details: Five-wave extension of wave C is likely to be below 24612
Bitcoin/U.S. Dollar(BTCUSD) Trading Strategy: The retest is at MA200 and the price make is a higher low, indicating that the Buyer is weak, so we looking for a turn down below 24612
Bitcoin/U.S. Dollar(BTCUSD) Technical Indicators: The price is below the MA200 indicating a downtrend. MACD and RSI have a bullish momentum.
More By This Author:
Elliott Wave Technical Analysis: Okta Inc. - Tuesday, Sept. 12
Elliott Wave Technical Analysis EUR/USD Hour Chart - Tuesday, September 12
Elliott Wave Technical Analysis: Tron/U.S. Dollar - Tuesday, Sept. 12



Comments
Log in or sign up to join the conversation.