


“Earnings drive market outcomes. In 151 years, every single 20% market decline was accompanied by a double-digit earnings decline, with zero exceptions.”
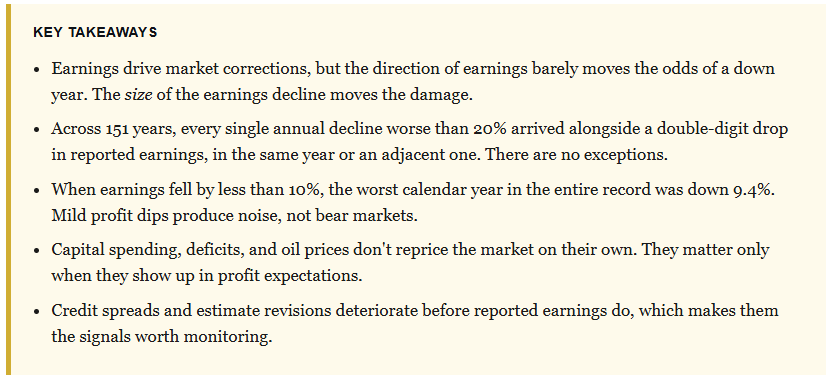
Every few months, a new reason to sell arrives. Capital spending is too high. The deficit is unsustainable. Oil just broke out. The conclusion attached to each is always the same: investors are about to lose half their money. I’ve watched that warning recycle for three decades, and it’s a smoke detector that goes off every time somebody makes toast. What actually matters is far less exciting. Earnings drive market corrections, and the historical record on that is close to airtight.
A probability tree from BCA Research has been circulating that makes the point simply. It shows the S&P 500 rising 84% of the time overall, and only 64% of the time in years when earnings fall. The framing is right. The specific numbers, when I rebuilt them from scratch, turned out to be a good deal more interesting than the chart suggested.
The Bear Case That Keeps Not Working
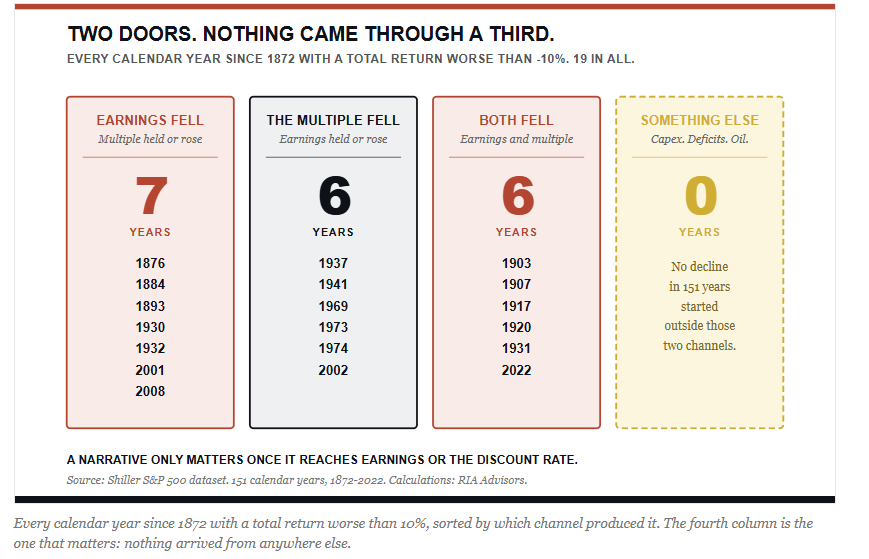
Start with why the popular scare stories fail as timing tools. Capital spending, government deficits, and energy prices are all real economic variables. None of them repriced the market on their own. If earnings drive market corrections, then every one of these stories has to travel through profits before it can do any damage, and most of them never complete the trip.
The reason is mechanical. A stock is a claim on future cash flows, and its price is that claim divided by a discount rate. So there are exactly two ways to knock the market down hard. Either the expected cash flows fall or the discount rate rises. That’s the whole list. Capex, deficits, and oil only matter to the extent they eventually show up inside one of those two variables, and most of the time they don’t show up in either with enough force to matter.
Consider what that means in practice. Hyperscaler capital spending can run at what looks like a reckless pace for years without producing a bear market, because the spending itself is a transfer from cash flow to depreciation schedules rather than a destruction of earning power, and the market will happily fund that trade for as long as revenue keeps validating it. The spending isn’t the risk. The risk is that the moment revenue stops validating it, it becomes an earnings problem wearing a capex costume. I made a version of this argument in AI Capex Depreciation Risk Is The Catch To Record Earnings, where the concern isn’t the capex line but the impact deferred costs have on reported profits later.
Deficits work the same way, of course. They can widen for a decade, and the only reliable transmission into equity prices runs through interest rates, which is the discount-rate channel rather than the earnings channel. Oil, in contrast, is the most direct of the three, because energy is an input cost that compresses margins. Even there, the market doesn’t fall when oil rises. It falls when the margin compression shows up in guidance.
How Earnings Drive Market Corrections Over 151 Years
Rather than take anyone’s chart on faith, I rebuilt the analysis from Robert Shiller’s monthly S&P 500 dataset, which carries index price, dividends, and trailing reported earnings per share back to the nineteenth century. That yields 151 complete calendar years, from 1872 through 2022, where both an annual total return and a year-over-year change in reported earnings can be computed. Reported earnings, not operating earnings, and certainly not forward estimates. Actual bottom-line profits.
Here’s what the conditional probabilities look like.
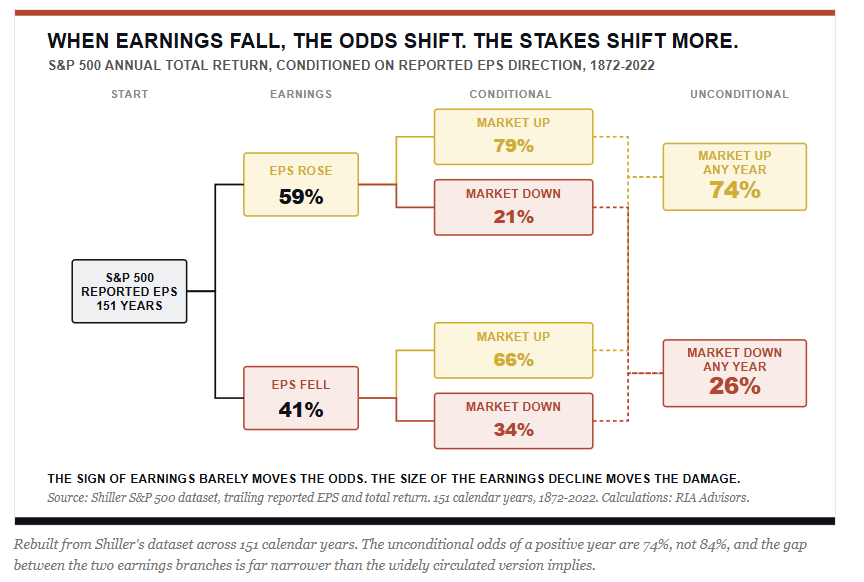
Two things stand out. The unconditional hit rate is 74%, not 84%. That figure cross-checks cleanly against Aswath Damodaran’s independent dataset at NYU Stern, which records 71 positive years out of 97 from 1928 through 2024, or roughly 73%.1 The 84% figure only appears if you start the sample in the mid-1980s, which conveniently excludes the Depression, the 1970s, and both world wars.
The second finding is the one that should give a strategist pause. In years when earnings fell, the market still rose 66% of the time, which is close to BCA’s 64%. But in years when earnings rose, the market rose only 79% of the time, not 92%. Widen the sample and the gap between the two branches collapses from 28 percentage points to 13. Over the 1928 to 2022 subsample it shrinks to roughly three points.
So does that kill the thesis? No. It relocates it.
Earnings Drive Market Corrections By Severity, Not Direction
Up or down is the wrong question. A tree that sorts years into two buckets throws away the only variable an investor actually cares about, because a year finishing 2% lower lands in the same box as a year finishing 38% lower, which is how you end up holding a chart that looks decisive while telling you nothing whatsoever about risk. Sort the same 151 years by the magnitude of the earnings change instead. The relationship of the binary version buried comes into focus immediately.
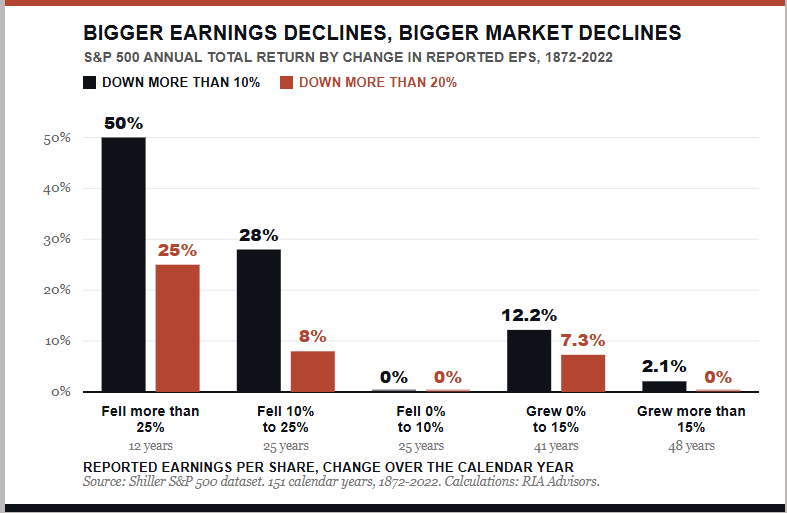
Read the middle column first. When reported earnings fell by less than 10%, not a single one of those 25 years saw a decline worse than 10%. Zero. The worst outcome in that entire bucket was a year that finished down 9.4%. A mild earnings dip is a nothing-burger for the index, which is exactly why the market shrugs off the soft patches that dominate financial television.
Now read the left edge. When earnings fell by more than 25%, half of those years saw declines of more than 10%, and a quarter saw declines of more than 20%. The average outcome in that bucket is negative. That’s the only bucket in the entire 151-year record where the average annual return is below zero.

Ultimately, that is the sentence to carry out of this article. Earnings drive market corrections through severity, not through direction. Whether the market finishes a given year up or down is close to a coin weighted by sentiment, liquidity, and valuation. Whether the market takes a 20% beating is an earnings question, and the historical record answers it without a single exception.
Every Major Decline, And The Earnings Behind It
In fact, only eight calendar years in the entire sample have a total return worse than-20%. That’s a small enough list to examine one at a time, which is the appropriate level of humility when you’re drawing conclusions from tail events.
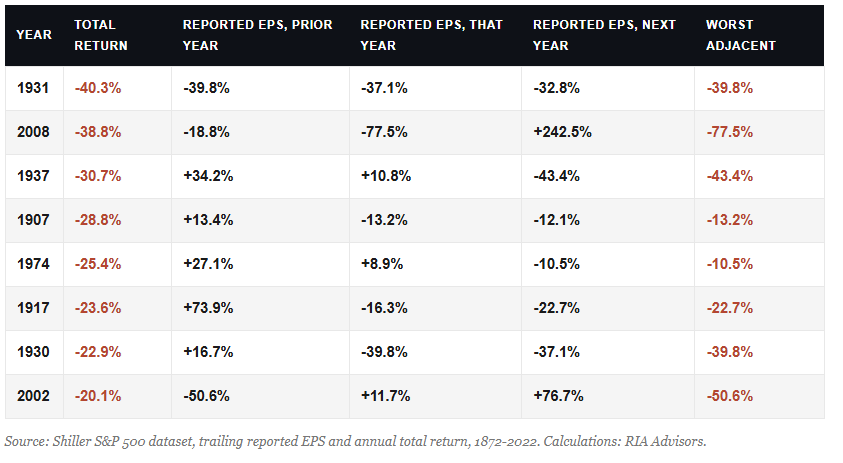
Look at the last column. Every one of the eight is accompanied by a double-digit earnings decline. Three of them, 1937, 1974, and 2002, had earnings still growing in the year the market fell apart, which is why a naive year-by-year test would file them as counterexamples and move straight on. They aren’t. The 1937 crash preceded a 43.4% earnings collapse in 1938. Same pattern in 1974, which preceded a 10.5% drop the year after. And 2002 had the sequence reversed, arriving after the 50.6% collapse of 2001 and the valuation reset that followed.
“In each apparent exception, the market didn’t ignore earnings. It got there first.”
That is the mechanism, stated properly. As a result, the market prices expected earnings, so it turns before reported earnings turn. Which means anyone waiting for the profit decline to appear in the data before reducing risk is reading a rear-view mirror and calling it a windshield.
The Strongest Objection, And What It Costs The Thesis
There is a real argument on the other side that we should examine.
“But Lance, 2022 was a 25% bear market, and earnings never fell. That was rates, full stop.”
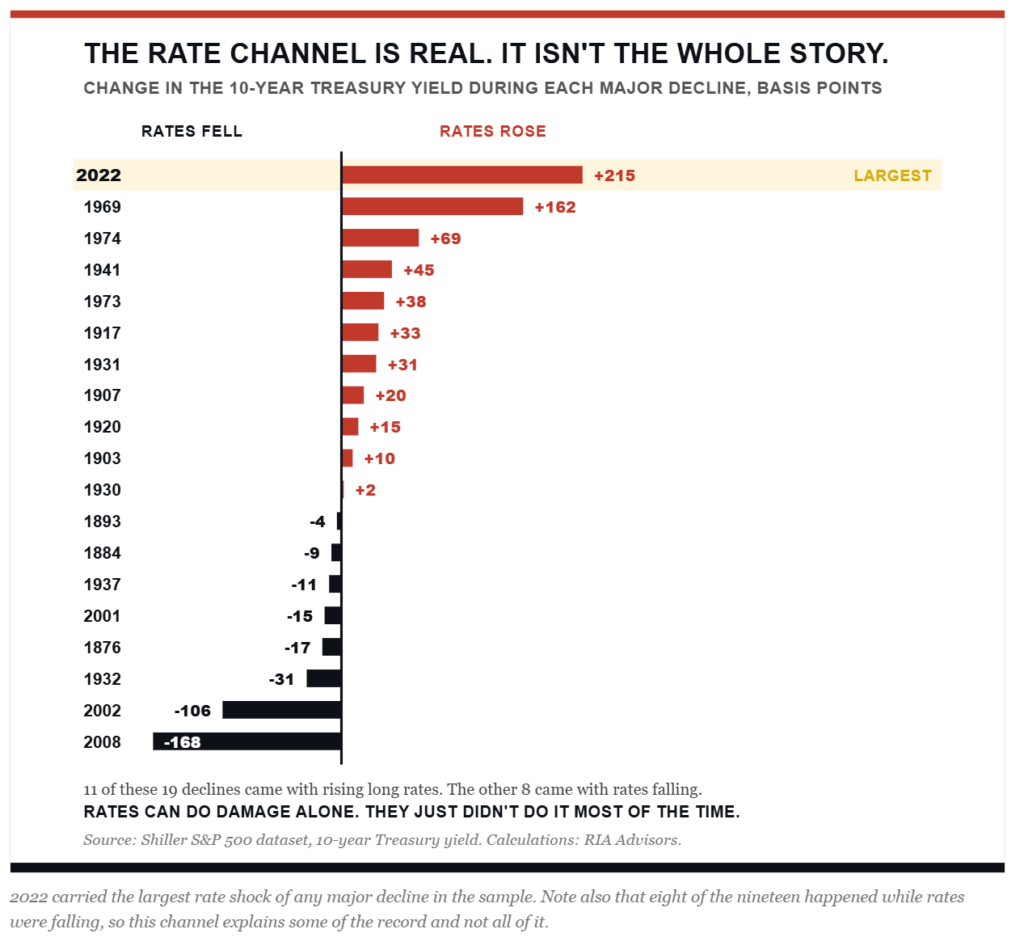
It’s the best objection available, and it’s half right. On forward operating estimates, 2022 is a clean multiple-compression event. Estimates actually rose through much of the decline, and the forward multiple did nearly all of the work as it compressed from the low twenties into the mid-teens. No earnings recession required.
Here’s the wrinkle. On trailing reported earnings, the measure this entire study is built on, 2022 shows a 12.7% decline. Both statements are true at once, and the gap between them is the point. Operating earnings exclude what companies would rather you ignore. GAAP earnings don’t. When those two series diverge sharply, you’re looking at a quality-of-earnings problem, and I’ve written about that divergence in Shiller’s CAPE: Is It Really Just B.S. more than once.
Still, the objection lands a genuine hit, and I’d rather concede it than dress it up. Rates are an independent channel. A discount-rate shock can produce a serious decline on its own, and 1937, 1974, and 2002 all carried heavy multiple-compression components alongside their earnings problems. So the honest formulation isn’t that earnings are the only thing that matters. It’s that earnings are the variable that separates a routine 10% air pocket from a portfolio-altering event, while rates determine how much valuation cushion you have when the earnings news arrives. Watch both. Weight earnings more heavily.
What about the other direction?
There’s a mirror-image error that costs investors more money than the one this article is mostly about. Earnings collapsed by more than 25% in 12 separate years, and in half of those years the market went UP. For example:
1921: earnings fell 63.8%, yet the market still returned 14.1%.
1938: down 43.4% on earnings, up 19.8% on price. In In
2020, earnings were off 32.5%, and the index was up 18.2%.
Why? Because by the time the earnings collapse is measurable, the market has moved on to pricing the recovery. Markets bottom before earnings bottom, without exception in the record above. Selling into a confirmed earnings recession is frequently the worst available trade.
Watch The Estimates, Not The Reports
If earnings drive market corrections and the market front-runs reported earnings, then the practical question becomes which earnings number carries information. The answer isn’t the one company’s report. It’s the one analysts are revising.
That would be more comforting if analysts were good at it. They aren’t. A McKinsey study spanning 25 years found Wall Street pegging earnings growth at 10% to 12% annually, while actual growth came in at around 6%, roughly the economy’s nominal growth rate, which is why forecasts drift so reliably above outcomes.2
Every year, since 1994, when operating earnings became the convention, initial quarterly forecasts have been skewed optimistically by something close to 30%. I’ve covered the machinery behind that bias in Earnings Season and The Truth About Wall Street Analysis, and the arithmetic of overpaying for those estimates in Estimates By Analysts Have Gone Parabolic.
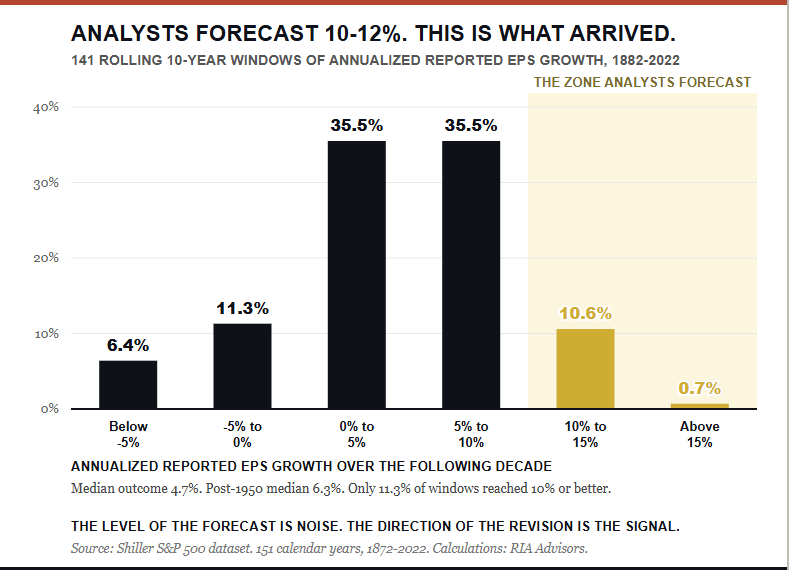
Of course, the bias doesn’t make estimates useless. It makes the level useless and the direction valuable. Nobody should care that the consensus is too high, because the consensus is always too high. What matters is the second derivative, meaning the rate and breadth at which estimates are being cut. As Bob Farrell’s Rule #9 puts it, when all the experts and forecasts agree, something else is going to happen. The tell isn’t the agreement. It’s the moment the agreement starts quietly dissolving, which typically shows up first in the number of companies being revised down rather than in the index-level figure.
In addition, the breadth of revisions matters more than the magnitude, and index-level estimates hide it. When a handful of very large companies carry the aggregate, the index number can climb while the median company deteriorates. That’s the setup I flagged in Earnings Estimate Revisions Are Very Optimistic, and it’s the single most common way a deteriorating profit cycle stays invisible for a couple of quarters longer than it should.
Investor Tactics When Earnings Drive Market Corrections
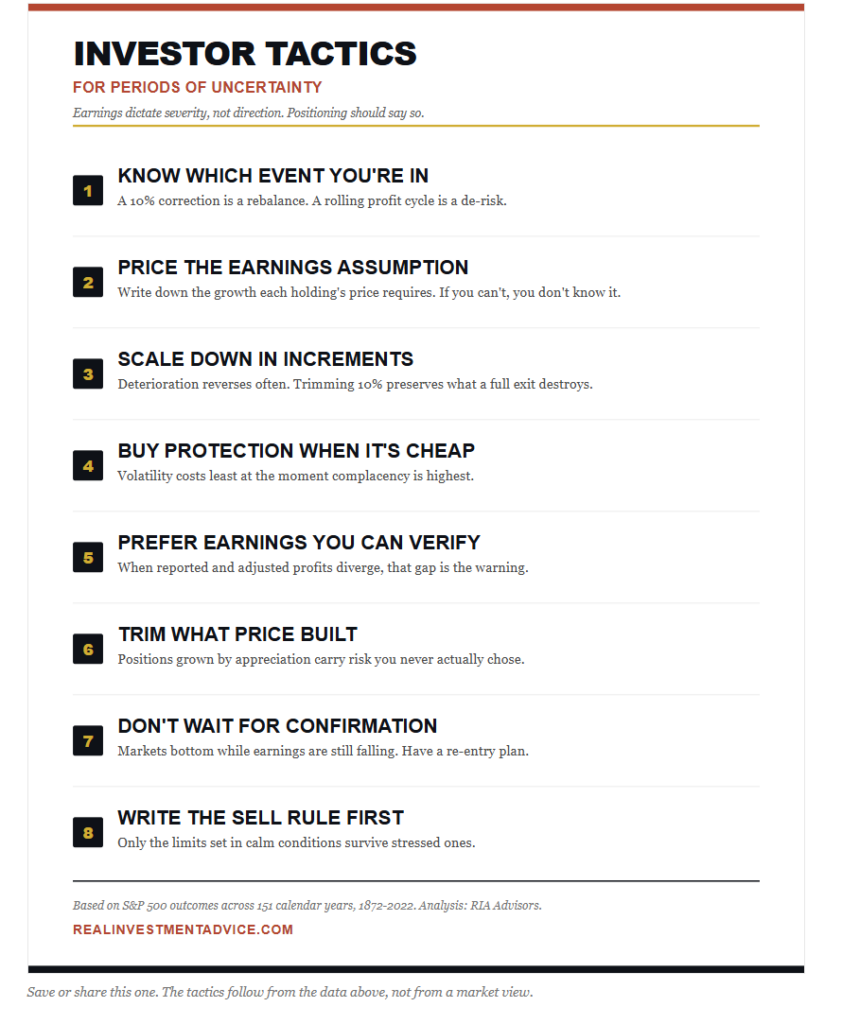
None of this matters without a process. Howard Marks has made the point for years that you can’t predict, but you can prepare, and preparation here means deciding well in advance which signals change your positioning and by exactly how much, so that the decision isn’t being made while you’re staring at red numbers and feeling something about them.
Warning Signals Worth Monitoring
Credit markets whisper what equities later shout. Bondholders get paid to worry about whether a company survives at all, so they reprice deteriorating fundamentals well ahead of equity holders, who spend their days pricing growth and tend to read the balance sheet last. Gilchrist and Zakrajšek demonstrated this formally in their NBER work, building a credit spread measure that predicted declines in economic activity and equity prices considerably better than standard default-risk indicators.3 I’ve walked through the practical version in Credit Spreads: The Market’s Early Warning Indicators.
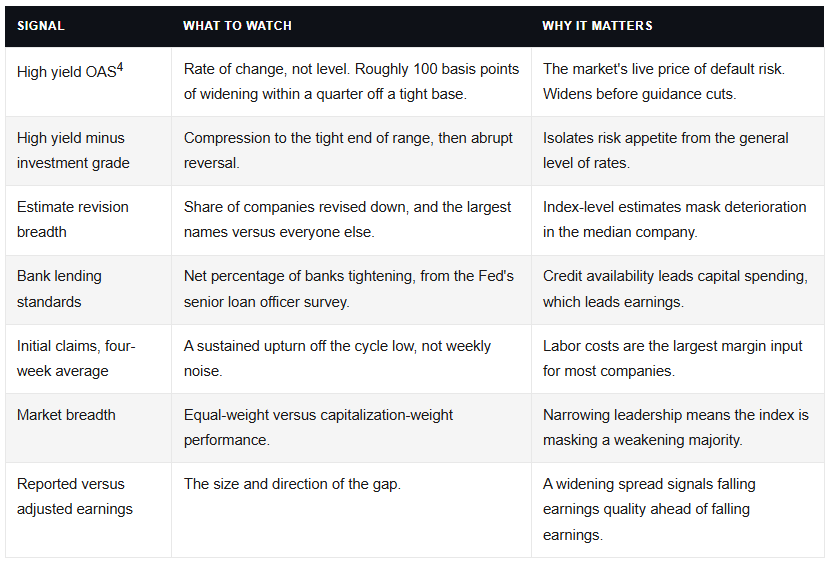
A caution on all of it. Earnings drive market corrections, but these are monitoring tools, not triggers. Spreads spent long stretches at complacent levels while equities compounded, and investors who de-risked the moment spreads looked tight gave up substantial returns for the privilege of being early. The rate of change matters more than the level; confirmation across several signals matters more than any single one; and the correct response to a deteriorating dashboard is usually a smaller position rather than no position.
Frequently Asked Questions
Do earnings declines always cause market corrections?
No, and that’s the most misunderstood part. Across 151 years, the market rose in 66% of the years when reported earnings fell. Small earnings declines are routine, and the index absorbs them easily. The data show that large earnings declines are a precondition for large market declines.
If earnings drive bear markets, how large does an earnings decline have to be to matter?
From the data, an earnings decline of roughly 10% appears to be the threshold. When reported earnings fell less than 10%, no year in the sample produced a decline worse than 10%. Once earnings fell more than 25%, half of those years produced a double-digit decline, and a quarter exceeded 20%.
Why did the market fall in 2022 if earnings didn’t decline?
It depends on which earnings series you use. For example, forward operating estimates rose, making 2022 look like a pure valuation reset driven by rates. Trailing reported GAAP earnings fell 12.7%. The divergence between operating and reported earnings is itself the story.
Should I sell when earnings start falling?
Usually, the opposite is true if the decline is already visible in reported data. Indeed, markets bottom before earnings bottom. In 1921, 1938, and 2020, earnings fell more than 25% while the market delivered double-digit gains. The useful signal is estimated revisions and credit spreads, both of which move earlier.
Are capital spending and deficits irrelevant to market risk?
Not irrelevant, but indirect. However, they affect equity prices only by working through expected cash flows or through the discount rate. Watching them without considering earnings and rates means watching the symptom rather than the disease.
What This Means Going Forward
Earnings drive market corrections. That’s the finding, and the next serious decline won’t arrive with a headline about capital spending or the deficit but will begin exactly where all eight of the others began, in the profit cycle, surfacing in credit spreads and revision breadth well before it reaches any earnings report you can actually read. The investors who get hurt won’t be the ones who missed the story. They’ll be the ones watching a different story entirely, waiting on confirmation that always arrives late.
Notes and Sources
Aswath Damodaran, Historical Returns on Stocks, Bonds, and Bills, NYU Stern. Reports 71 positive years of 97 from 1928 through 2024, best year 1954 at +52.56%, worst 1931 at -43.84%.
McKinsey & Company research on analyst forecast accuracy, covering approximately 25 years of consensus estimates versus realized S&P 500 earnings growth.
Simon Gilchrist and Egon Zakrajšek, Credit Spreads and Business Cycle Fluctuations, NBER Working Paper 17021.
ICE BofA US High Yield Index Option-Adjusted Spread, FRED series BAMLH0A0HYM2, Federal Reserve Bank of St. Louis. Note that FRED restricts the ICE BofA series to a rolling window, so longer histories require the index provider directly.
Primary dataset: Robert J. Shiller, monthly S&P 500 price, dividend, and trailing reported earnings series. 151 complete calendar years, 1872 through 2022. All conditional probabilities, severity buckets, and adjacent-year earnings figures were calculated by RIA Advisors.
Probability tree framing adapted from a chart published by BCA Research, sourced from FactSet and BCA calculations. Figures in this article are independently recalculated and differ from those in the chart.



Comments
Log in or sign up to join the conversation.