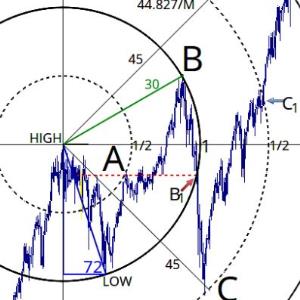

The Dow Jones Industrial Average (DJI) has been continuing its almost vertical climb since the 2016 presidential election. It successfully broke through the 25,000 resistance level mentioned in our Weekly Report Volume 6 from January 7, 2018.
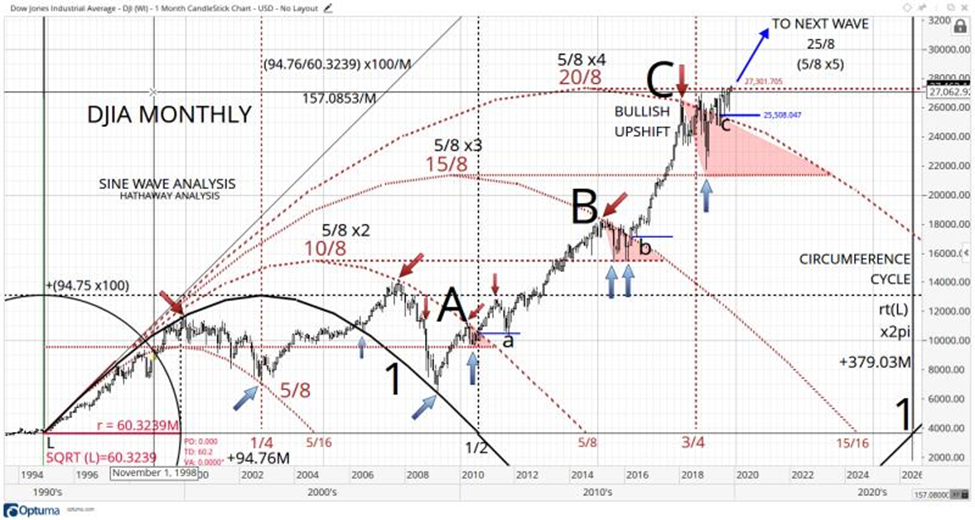
At 26,200, the Dow is roughly halfway to its long-term geometric target price of 27,500. Here is an updated chart:
(Click on image to enlarge)

- At point B, the market broke through 25,000 on January 5, 2018 and has not turned back, at least so far.
- If a repeat of the activity at point A plays out (red and blue arrows), then at least a temporary top at 27,500 is expected.
- If the Dow does turn down from the 27,500 price zone, then next watch for support from around 25,000 and down to 24,800.
- On the other hand, if the Dow breaks out above the 27,500 target, next watch for a major resistance/target price around 33,400.
Comments
Log in or sign up to join the conversation.