

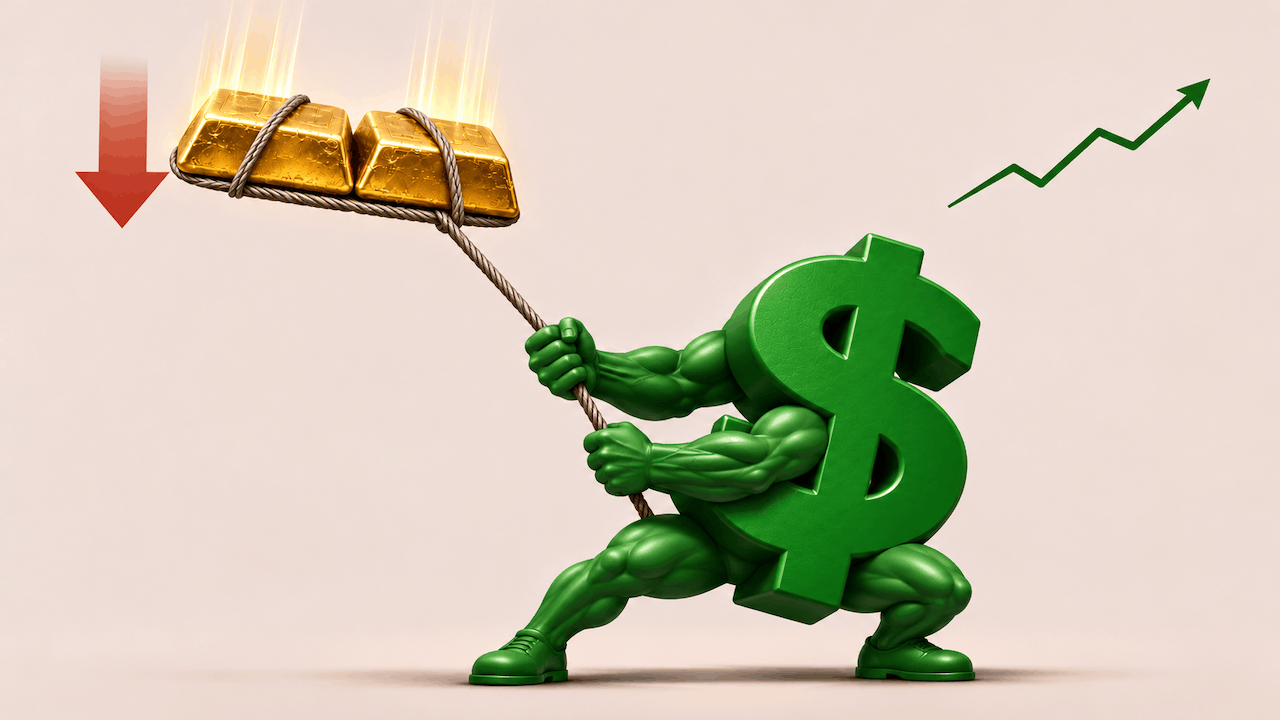
Dollar strength is driving gold lower. This is a typical short-term pattern. However, the inverse correlation between gold prices and dollar strength tends to break down over the longer term.
Gold has plummeted more than 33 percent since its January high of over $5,500. Over that same period, the dollar index (DXY) rose from 96.3 to 103.2. Meanwhile, the U.S. 10-year inflation-protected real yield has climbed from 1.89 percent to 2.83 percent.
Analysts at Heraeus call the dollar “one of gold’s most consistent price drivers” over shorter time horizons.
“Since 1990, the correlation between daily percentage changes in the gold price and DXY has been -0.31, and -0.43 this year. Put simply, dollar-up days have tended to be gold-down days. A 1 percent rise in DXY this year has typically coincided with a little more than a 2 percent fall in gold.”
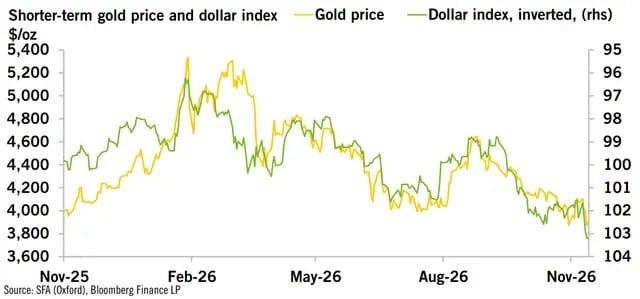
However, Heraeus analysts say the DXY explains “much less” about the gold price.
“Gold is almost ten times higher than in 1990, while DXY, which measures the strength of the dollar against other major currencies, is only around 10 percent higher.”
This makes sense when you think it through. The dollar index measures dollar strength against other fiat currencies. And while the greenback might be the cleanest dirty shirt in the laundry, it is still being constantly devalued, along with every other fiat currency. The DXY simply shows the U.S. is inflating its currency a little more slowly than other countries. It's not that the dollar is "strong." It's just stronger than the other weaklings in the room.
In other words, a falling tide drops all ships. Over the longer term, gold prices reflect this persistent inflationary pressure. That’s why many investors hold gold as a long-term inflation hedge.
Heraeus analysts noted that adjusting those gold price gains since the 90s against the DXY leaves that long-term upward trend intact, “suggesting it reflects the erosion of major fiat currencies generally, along with real gains in gold, rather than simply a weaker dollar.”
Heraeus researchers say real yields determine whether that long-term trend can dominate.
So, what is the real interest rate, exactly?
Simply put, the real interest rate is the interest you will earn or must pay adjusted for inflation.
By factoring out inflation effects, the real interest rate reflects the “real” cost of borrowing money and the real gain in lending.
It’s a simple calculation.
The real interest rate equals the nominal rate (the numbers quoted on the news) minus CPI.
For example, consider our 10-year Treasury bond that’s yielding 5 percent. If the CPI is 2 percent, the real interest rate is only 3 percent (5-2=3).
When the CPI is high, real rates can turn negative. That means you’re losing purchasing power even though you’re earning interest. For example, let’s say our 10-year Treasury bond has a 3 percent yield, and the CPI is 5 percent. Your real interest rate is -2 percent (3-5=-2).
That might sound crazy, but real rates often went negative in the decade preceding the 2008 Financial Crisis.
Heraeus analysts noted that before 2022, periods of high or rising 10-year real yields closely correlated with lower and falling gold prices.
“That relationship weakened during the 2022- 2025 price rally, when central-bank buying and other drivers outweighed the rates headwind but has reasserted itself this year. The 10-year real yield has risen from around 1.7 percent in February to above 2.8 percent, close to its highest since 2008 and sharply increasing gold’s opportunity cost.”
Here’s what some investors miss.
In a high-inflation environment, nominal interest rates can rise even as real yields fall. This occurs when inflation outpaces rising interest rates. Rising nominal yields create the impression that rates are rising even as real rates decline.
Heraeus analysts summed it up this way.
“Inflation supports gold over the long run only when policy lets real rates fall; for now, each ‘hot print’ is a headwind.”
Analysts say there are signs this sudden surge in dollar strength may prove short-lived. Heraeus researchers noted that speculators have swung from a $20.5 billion net short-dollar position to a $10.7 billion net long since February. It’s the largest shift from shorts to longs since 2016.
“Similar positioning extremes have often preceded dollar weakness, although the sample is small and positioning is a poor timing signal.”
Until the Fed signals an end to this tightening cycle, gold will likely face continued price pressure. At this point, most people seem to believe the Fed can hike rates at will until it reins in inflation. However, that might be easier said than done. When inflation keeps running hot (as it has for 68 straight months), and the Fed can't raise rates because of the debt black hole and a collapsing economy, the lid will come off the gold market. You can expect the bull market to resume in earnest.


Comments
Log in or sign up to join the conversation.