


I’ve been traveling for a week, reading and talking to a lot of readers and friends. It seems to me there is a great deal of angst in the media and newsletters and podcasts. And the more bearish you are, the greater your audience and clicks. There are so many analysts taking one or two data points and projecting a dismal outcome. Yes, there are a few that are more bullish, but they don’t get the publicity.
Today we're going to look at the underlying data and find that while the world is not ending anytime soon, there are actually good reasons for the disparity in forecasts. So, it’s okay if you’re confused. The stock market just hit an all-time high, energy is volatile and will be a negative on global growth, to say the least. GDP growth is much lower than we would like, the geopolitical issues are problematic (to say the least), plus a dozen other data points. Let’s see if I can help you understand how to deal with all this.
In the 26 years of writing this letter, two themes stand out. The first is that in the early 2000’s I said that the decade ending in 2010 would be a Muddle Through Economy. You must understand that US GDP had grown by over 3% for decades. There were three decades in a row last century where growth averaged almost 5%, so talking about a 2% decade was decidedly not consensus. I was constantly told that I was too negative and bearish.
We were coming off the 2002 low, but when I looked at how we were accumulating debt and organizing our country, I said that the US economy would only grow at 2% for the decade ending in 2010. That was what the research and economic data suggested to me. As it turns out, I was slightly optimistic - the economy grew 1.9%.
At the beginning of the last decade, I said essentially the same thing: we are in for another decade of a Muddle Through Economy. All the dreams of returning to a 3% GDP growth (which for an economy our size is incredibly strong) was not going to happen. And sure enough, GDP growth 2010-19 was 2.4%. Which, given the challenges, was pretty solid.
GDP seems to be slowing down again, and I think for the rest of this decade we will be lucky to see 2% overall growth. That is not bad. There are a lot of opportunities out there. But it is my belief that the opportunities are not going to be where they were in the past decades, where you can simply find an index and just ride the wave. I think this will be a very rifle shot, long-term investor market. You (or your advisor) are going to have to do homework rather than just simply choosing an index.
The second theme is that I believe we are going to see a crisis, a Great Reset or Great Restart, towards the end of the decade that will be quite disruptive. But it is also something that will pass, so the key is to make sure your portfolio and your life are anti-fragile enough that while the world may be disrupted, you are not.
Divergent Data
For most of the last century, economic data was pretty much evenly distributed across a normal bell curve. The chart below is a simple illustration of normal distribution, which I think represents the last century, and the “fat tails” distribution which has been the norm for the last 25 years and I think is going to be increasingly what we are looking at.
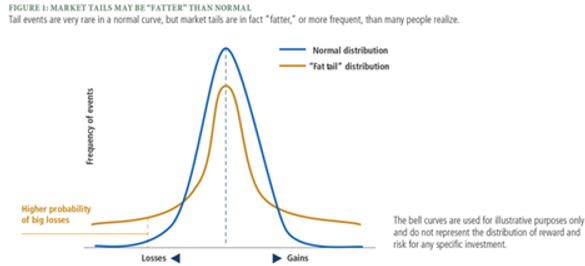
Source: Drawing Capital Research
The distribution of economic data is more divergent, both good and bad, and that gives the opportunity for analysts to make far more divergent claims. These become click bait. And in our world today the negative ones get far more attention. It is good to pay attention to potential negative problems, but you need to balance that with the upside views.
Below, we are going to look at the projections for first quarter GDP. They are not robust. A lot of analysts take that one data point and make some pretty distressing predictions. But there are other equally compelling data points suggesting the opposite is happening. The goal is to find balance. So let’s jump into some of the data.
GDP Growth Seems to Be Slowing
Projections for first quarter 2026 GDP are generally uniformly lower, some are more optimistic than others. The Atlanta Fed GDPNow says that the first quarter GDP growth will be 1.3%. This would be coming off of a 0.5% fourth quarter of 2025. To be balanced by a very robust 4.4% third quarter of 2025. For the entire year 2025 was up 2.2%, so a very Muddle Through year.
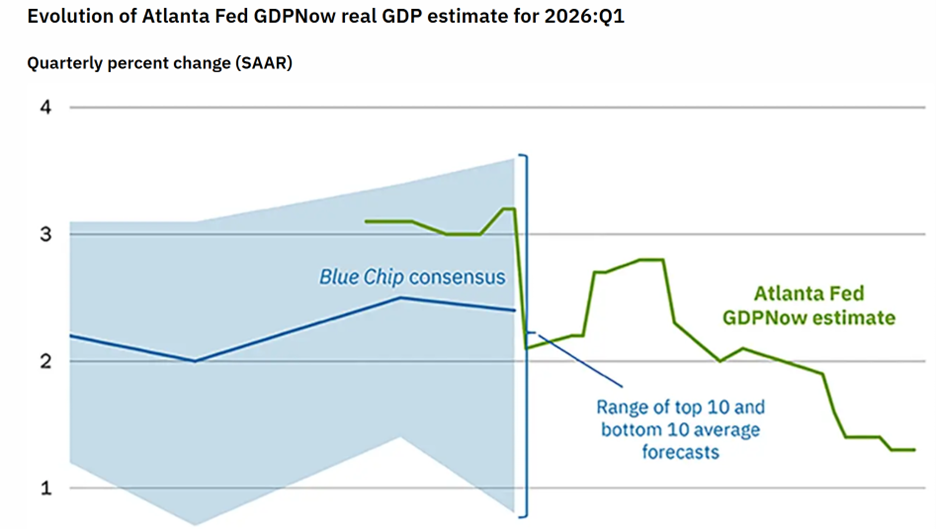
Source: Federal Reserve Bank of Atlanta
Projections for 2026 are generally higher for the year. The IMF projects 2.1% for the US. The Fed is at 2.4%. J.P. Morgan projects real GDP growth of 2% year-over-year by the fourth quarter of 2026. They come to this number where growth is expected to start at 1% in the first quarter, increase to 3% in the middle quarters, and then slow down again to 1% in the fourth quarter.
I should point out that obviously 2% GDP growth on average is not an end of the world moment. That has basically been our average GDP growth since the beginning of the millennium. Yes, there were some serious negative episodes, but they passed. They always do. And the stock market hit an all-time high this week.
To give us historical perspective, let’s look at this table from Crestmont Research (run by my good friend Ed Easterling). Take some time to look through these numbers. And in particular notice the numbers on the far right of the table. This is the growth in GDP per capita. Even though GDP has grown 2.2% since 2000, on a per capita basis it has only grown 1.4%.
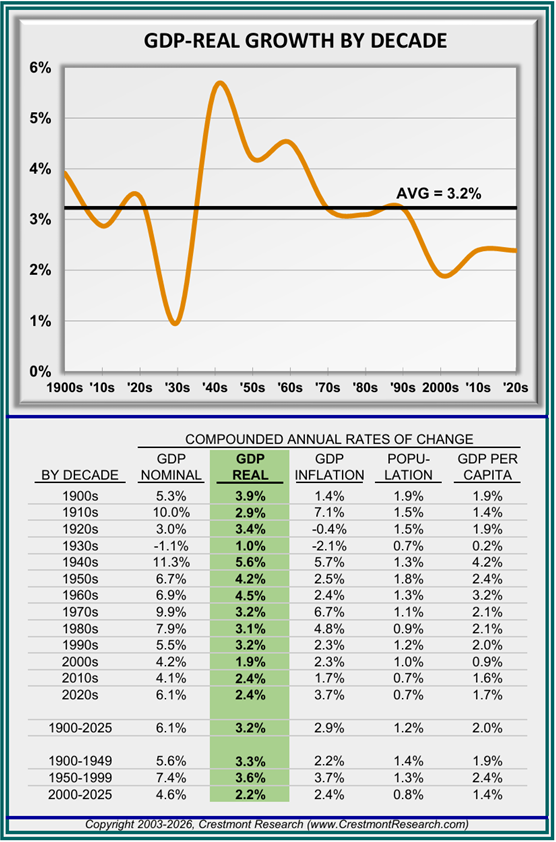
Source: Crestmont Research
GDP is essentially the number of workers times their level of productivity. Because the US has seen a number of workers increase, largely due to immigration, we have more workers and the capital we employ make those workers more productive.
Therefore, by definition GDP per capita will always be less than national GDP. While 1.4% per capita GDP growth doesn’t sound like much, and historically it isn’t, it has increased the well-being of our nation. The distribution may not be even, and that is another real problem, but the entire country as a whole is improving. And that sets the foundation for continued growth.
What’s Driving the Stock Market?
There is a quote attributed to Benjamin Graham but has been repeated by Warren Buffett. “In the short run, the market is a voting machine. But in the long run, the market is a weighing machine.”
What Graham was trying to tell us is that emotions drive stock prices in the short term. And just like voters in any political election can change from month to month or week to week, so can prices in the stock market.
But in the long run, stock prices are a reflection of their earnings. Earnings are the weight, if you will. And earnings have been unusually strong for the last 6 quarters.
The earnings projections from Standard & Poor's for the S&P 500 for the first quarter of 2026 and for the whole year are as follows:
They expect year-over-year earnings growth rate in the first quarter to be 13.2%. This growth rate is expected to mark the six-story quarter of double-digit year-over-year earnings growth reported by the index. That is just spectacular.
Looking at the actual figures, they project earnings of $308.52 per share.
You can find numerous projections, but almost all are robust. J.P. Morgan projects that the S&P 500 will see earnings growth of between 13% and 15% over the next two years, with a year-end price target for 2026 initially set at 7,500 but later revised down to 7,200 due to market volatility and external risks.

Comments
Log in or sign up to join the conversation.