

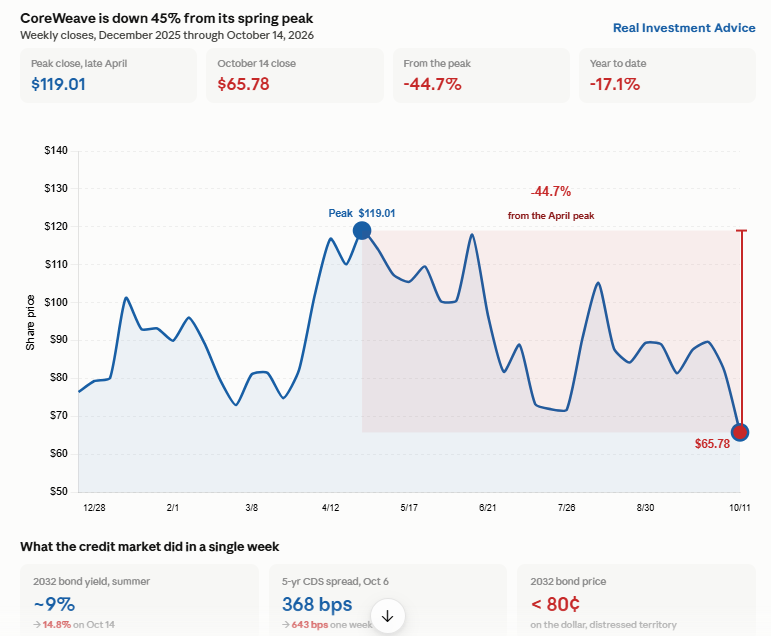
CoreWeave shares have fallen by nearly 50% since April, including a 15% decline on Wednesday. More concerning, its 9.625% notes maturing in 2032 traded for less than 80 cents on the dollar. That equates to a yield of nearly 15%. For context, the yield was below 10% earlier this week. Its five-year credit default swap spreads nearly doubled in a week, from 368 basis points on October 6 to 643. Based on its CDS spread, the market implies an approximate 35% chance the company defaults within five years.
The timing of the sharp increase in its funding costs is very problematic. CoreWeave carried roughly $35 billion in debt and $5.5 billion in cash at the end of June, with combined debt and lease obligations near $52 billion. It has $4.4 billion of debt maturing through this year, and $6.2 billion in 2027. Refinancing at 15% is likely not economically feasible. Issuing new shares is also problematic given its recent downward trend.
CEO Mike Intrator recently told his employees the company is “confident in our backlog which more than supports all of our debt obligations,” pointing to $104.2 billion of contracted revenue. Its order backlog is a strong source of revenue, but it probably isn’t immediate enough to fund its current needs.
Gartner, an IT advisory firm, drove recent concern with its claim that more than 80% of neocloud providers, including Coreweave, will cease independent operations by 2030. Will a white knight like Nvidia come to Coreweave’s rescue?
What To Watch Today
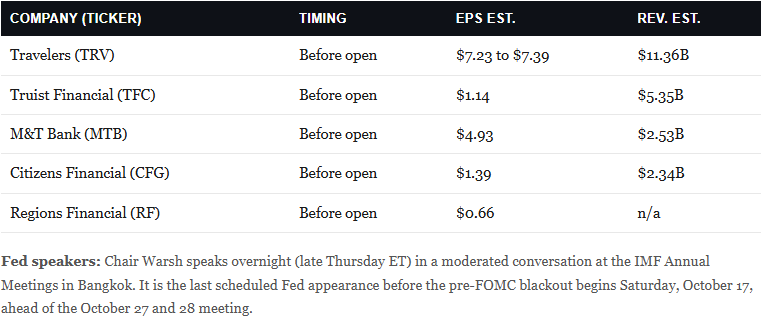
Earnings
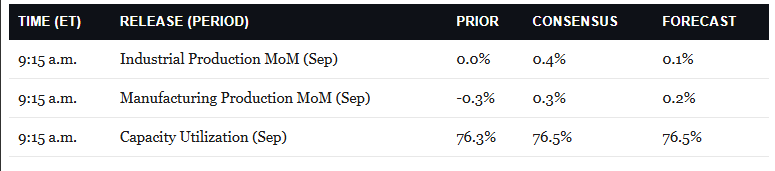
Economy
Market Trading Update
Yesterday, we discussed the split in bank earnings between trading desks and lenders. We also noted that narrow leadership had left equal weight near a three-year relative low. Today, let’s ask whether fundamentals can carry the equal-weight rotation that started last week. Citadel’s Scott Rubner tackled that question in his October update, “Fundamentals in Focus,” and his answer cuts both ways.
Start with the good news. Consensus expects roughly 27% S&P 500 earnings growth for Q3, the third-highest bar entering a reporting season since 2010. Companies have beaten pre-season estimates in 19 of the last 20 quarters. Estimates rose 1.6% into the season. The buyback window is also about to reopen. Only 24% of index weight sits outside blackout today. That climbs to 55% by month-end and 85% by November 9.
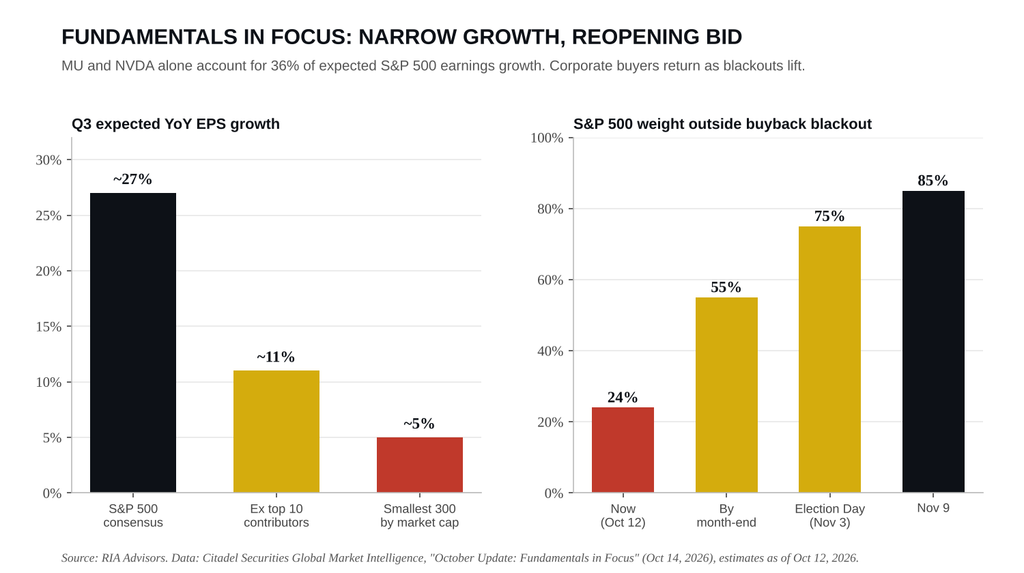
BUT look at who carries that growth. Micron and Nvidia alone account for 36% of expected earnings growth, and the top ten contributors make up about two-thirds. Strip those ten out, and growth drops to roughly 11%. The smallest 300 companies in the index are expected to grow earnings about 5%. That’s the fundamental reason equal weight spent two months getting run over.
So the turn matters. The RSP/QQQ ratio slid about 11.5% from late August to its October 7 low. Citadel puts the index version at its lowest level since April 2000. It has since bounced 4.7%, and RSI has climbed from below 30 to 54. However, the ratio still sits 2.2% below its 50-day moving average and 5.4% below its 200-day. Such is the difference between a bounce and a trend change.
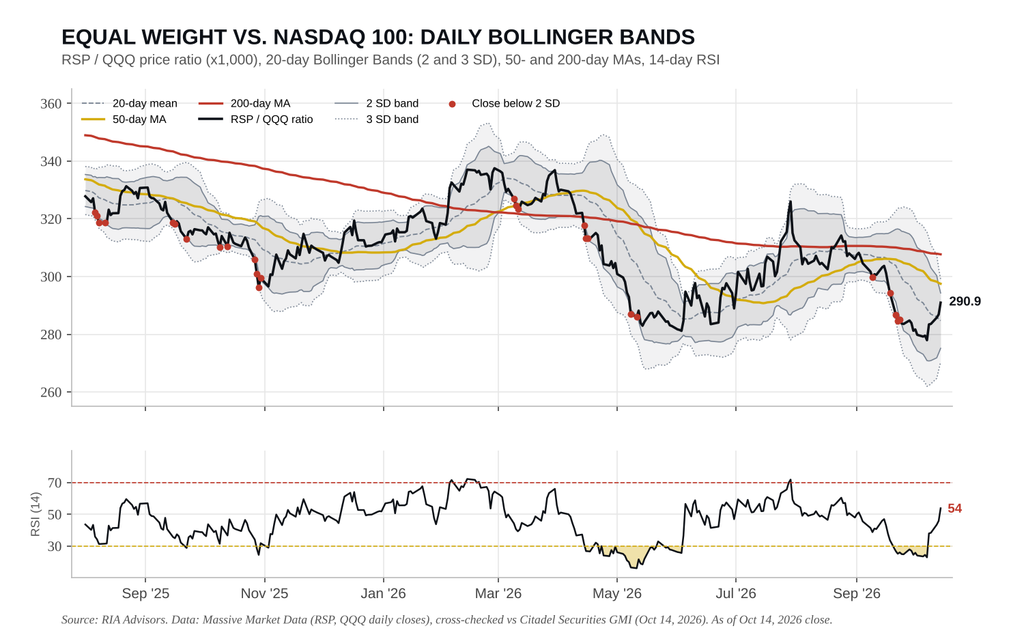
Wednesday added a wrinkle. A hotter September CPI print knocked the S&P 500 down 1.08% to 7,721 and the Nasdaq 100 down 2.02%. That ended a run of more than 50 sessions without a 1% decline, a streak Rubner flagged only two days earlier. Meanwhile, retail investors bought $2.6 billion of semiconductors last week, a 96th-percentile reading. When retail piles into the few names carrying the earnings math, any stumble there hits the index and the crowd at once.
Bob Farrell’s Rule #7 says markets are strongest when broad and weakest when narrow. Rubner adds a caution of his own. Fewer than half of similar rebounds from extreme relative lows kept going over the following month.
Here’s how we’re handling it. As noted yesterday, we’ve been steering trimmed mega-cap gains toward lagging groups. We also added to financials in the Equity Aggressive Growth model ahead of earnings. We’re sticking with that process, but we aren’t chasing the bounce. If you’re overweight semiconductors, trim to target weight before October 28 to November 3, when nearly half of the index weight reports. Add equal-weight exposure on pullbacks toward the 20-day mean, not on up days. If the ratio breaks back below the October 7 low, the “rotation” failed, and we’ll treat it that way.
Narrow markets rarely announce when they break. They just break.
The Other Side Of The CoreWeave AI Trade
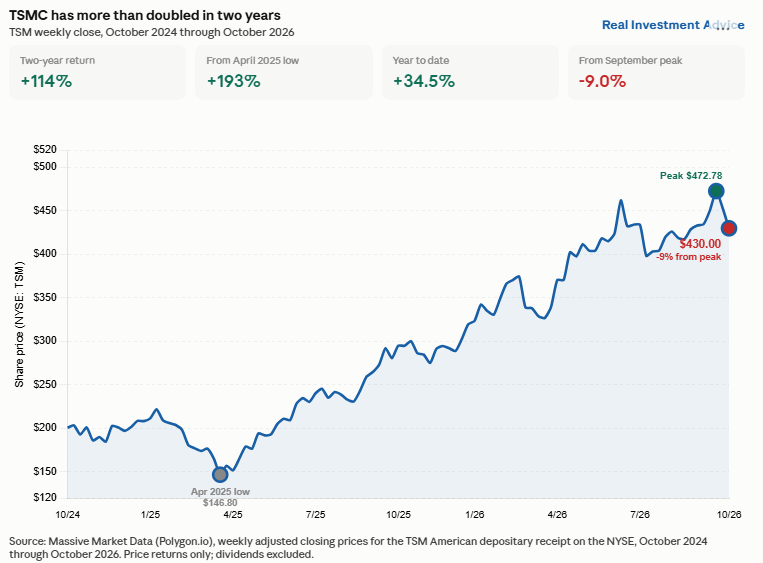
If CoreWeave’s stocks and bonds are the bear case for the AI industry, Taiwan Semiconductor Manufacturing Company (TSMC) earnings report is the bull case. TSMC is the world’s largest contract chipmaker, producing the advanced processors designed by Nvidia, Apple, and AMD. Its shares primarily trade on the Taiwan Stock Exchange (2330), with American Depositary Receipts (ADR) on the NYSE under TSM.
TSMC reported third-quarter revenue of $46.72 billion compared to estimates of $45.7 billion, up 41.1% from a year ago. Its gross margin was 66.4% and net income rose 68.7%. Fourth-quarter earnings guidance of $52.3 to $54.3 billion easily topped consensus.
Even with TSMC’s strong results, chip stocks fell, still reeling from the CoreWeave story and its implications for chip makers and producers, like TSMC. Despite TSMC’s strong earnings, South Korea’s Kospi dropped 8%, and trading was halted. Japan’s Nikkei fell nearly 5%. Taiwan’s Taiex lost 3%, and TSMC itself fell 2%.
We think the takeaway from the CoreWeave and TSMC stories is that demand for chips remains incredibly strong. However, the market is not repricing demand; it is repricing the financing behind the AI buildout and its beneficiaries.
PPI And Retail Sales Support Another Rate Hike
September headline PPI rose 1.3% more than double the 0.5% consensus, lifting the annual rate to 6.3% from 5.6%. That is the largest yearly gain since 2022 and the highest since May. Energy drove a sizable share, with diesel prices up more than 70% year over year. Strip out food, energy, and trade services, and PPI still rose 0.5% monthly and 5.0% annually. Core PPI was 0.7% against a 0.2% estimate. It’s worth noting that PPI tends to be more volatile than CPI and PCE and harder to estimate.
Retail sales rose 0.8%, beating the 0.4% expected. Unfortunately, nearly all of it was gasoline. Excluding autos and gas, sales rose just 0.2%. The control group, which feeds the GDP calculation, rose 0.1%. Both figures were below the inflation rate, meaning real spending on everything outside energy was negative in September.
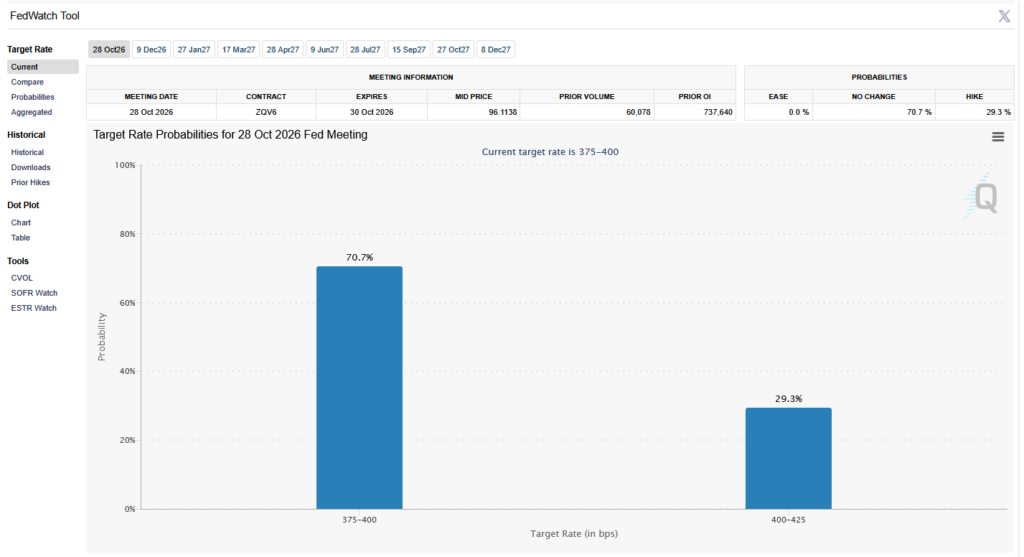
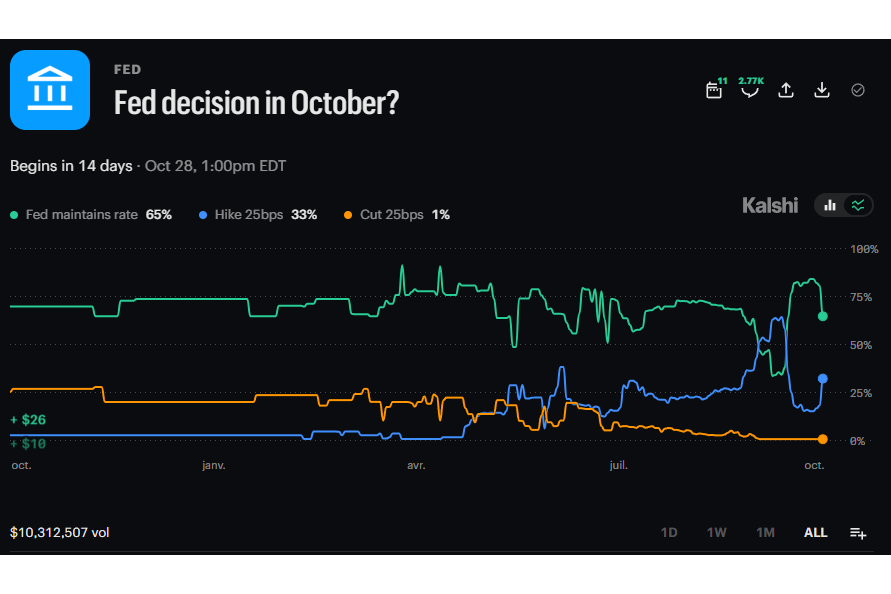
For the October 28 FOMC meeting, this week delivered hot CPI, hot PPI, and a consumer showing resilience but solely on the back of rising gas prices. Given this week’s data, it’s hard to see how the Fed doesn’t hike in two weeks, yet Fed Funds futures only assign a 30% chance of a hike.


Comments
Log in or sign up to join the conversation.