


On Monday, Oracle filed to sell $10 billion of common stock and $10 billion of debt. The stock fell roughly 8% after disclosing it would offer the new shares at an 11% discount to the current price.
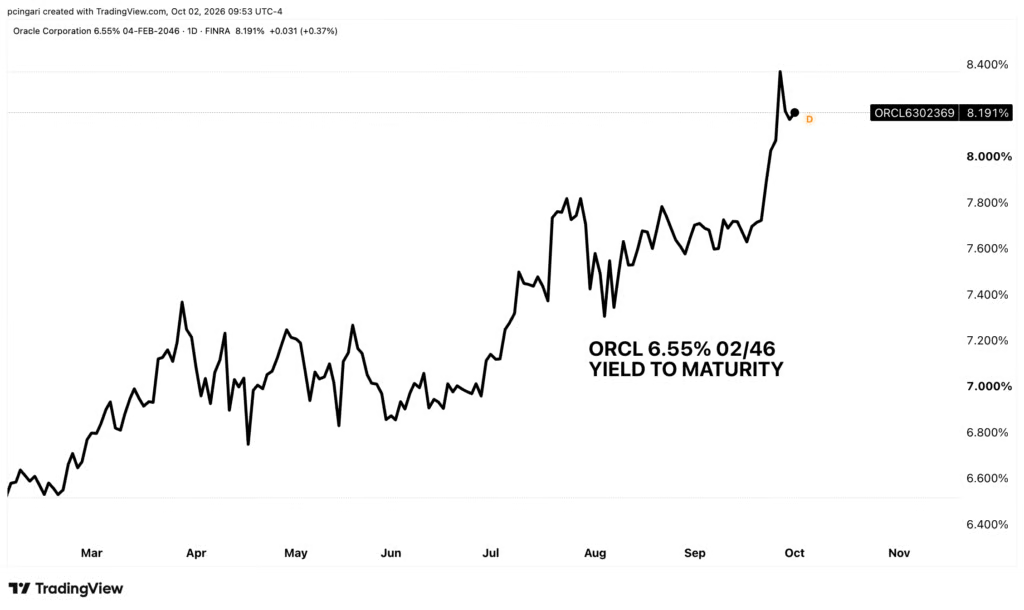
Oracle’s free cash flow was negative $23.7 billion in fiscal 2026, so it must fund AI data center construction from outside the company. Its choice to fill the cash gap with debt and equity suggests its debt options are limited. Oracle’s total debt, including leases, reached $169.1 billion in August, up from $84.5 billion in August 2021. S&P cut Oracle to BBB- in July, one notch above junk, and its debt, as shown below, trades at junk-bond levels. Borrowing the full $20 billion would have possibly resulted in a downgrade to junk status and higher yields.
Because of the rating implications and lofty yields, Oracle must issue shares. The equity issuance comes at roughly 15 times forward earnings versus a five-year average near 21, meaning it is selling stock while it is cheap. That is when companies should buy back shares, not issue them.
We wrote last month in Meta Splits: The Buyback Machine Shifts To Reverse that for a growing list of hyperscalers, existing revenues can no longer fully fund the AI buildout. We also noted in The Market’s Biggest Buyer Is Stepping Back that S&P 500 companies “have been the marginal buyer of US stocks for a decade,” contributing roughly 1.8% a year to S&P 500 returns due to shrinking share counts.
Key takeaway: negative free cash flow forces a company into the capital markets. High rates and a stretched balance sheet push it toward equity over debt. Together, those two conditions halt buybacks, turning some of the last decade’s biggest buyers into sellers.
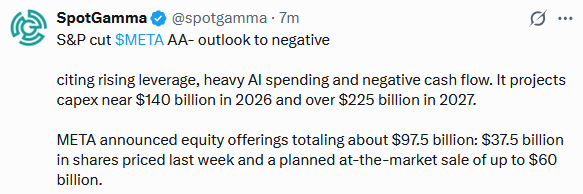
Please see the Tweet of the Day below for breaking news on how rising debt levels affect Meta’s capital structure.
What To Watch Today
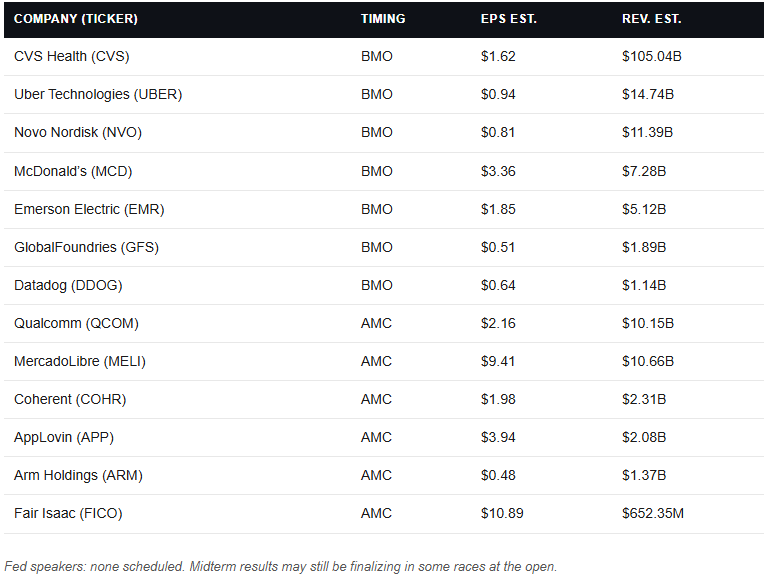
Earnings
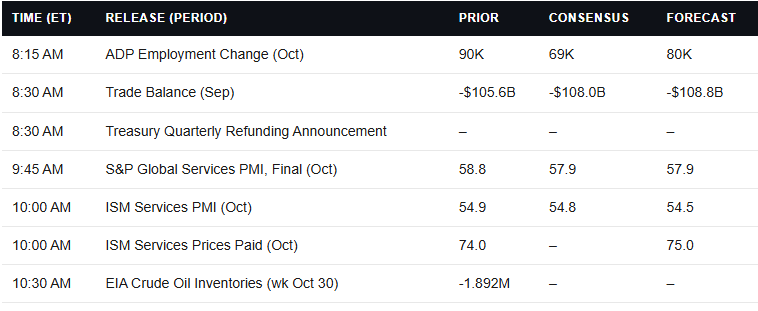
Economy
Market Trading Update
Yesterday, we looked at the market’s track record after midterm elections in Liquidity Weighed On Gold Trumping Real Yields. Today, the question is narrower. Is the midterm technology sell-off a warning, or a setup?
Let’s start with the damage. The Nasdaq Composite closed Monday at 25,164, down 8.8% from its October 6 record of 27,600. The Technology Select Sector SPDR (XLK) fared worse, falling 13.8% from $202.00 to $174.22. The worry is “regulation.” If control of Congress shifts, investors fear new rules on AI, antitrust, and chip exports. That fear may prove right. History suggests it rarely stays the market’s problem for long.
Notice in the chart below what happens around midterms. Since 1950, the S&P 500 has been higher six and twelve months after all 19 midterm elections. The Nasdaq, with data back to 1974, was higher six months later in all 13 cycles and twelve months later in 12 of 13.
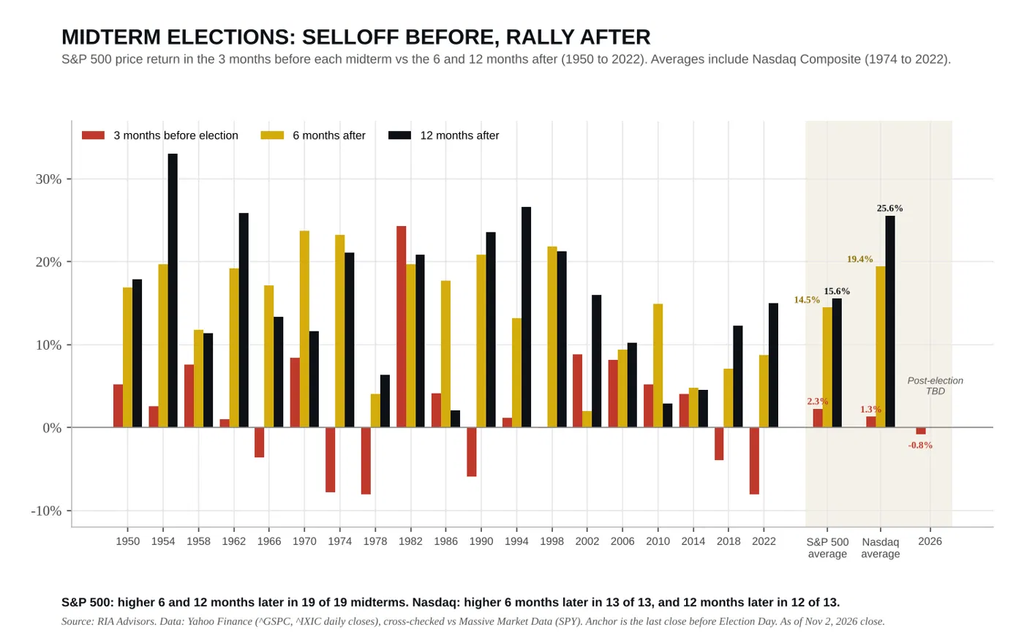
Here’s the part that matters for technology. In seven of those 13 cycles, the Nasdaq fell during the three months before the vote, including drops of 14.8% in 1990 and 16.5% in 2022.
However, after those seven pre-election declines, the Nasdaq averaged a 23.8% gain over the next six months and 27.6% over the next year. That beat the cycles that came into Election Day strong. Such is the nature of an uncertainty discount. Investors price it in before the vote and unwind it after.
So, is this selloff unprecedented? It’s NOT even close. So far, it’s milder than 1990 or 2022.
Here is the current fear. “The AI trade is crowded, and the rules could change.” That is true, but it is not a certainty, and as Bob Farrell’s Rule #9 reminds us, “when everyone agrees, something else tends to happen.”
Four weeks ago, XLK’s 14-day RSI was above 70. On Monday, it closed at 32, with the price below its lower 2-standard-deviation Bollinger Band. The fund sits 8% below its 50-day moving average near $189.50, yet still 2.7% above its rising 200-day average near $169.70.
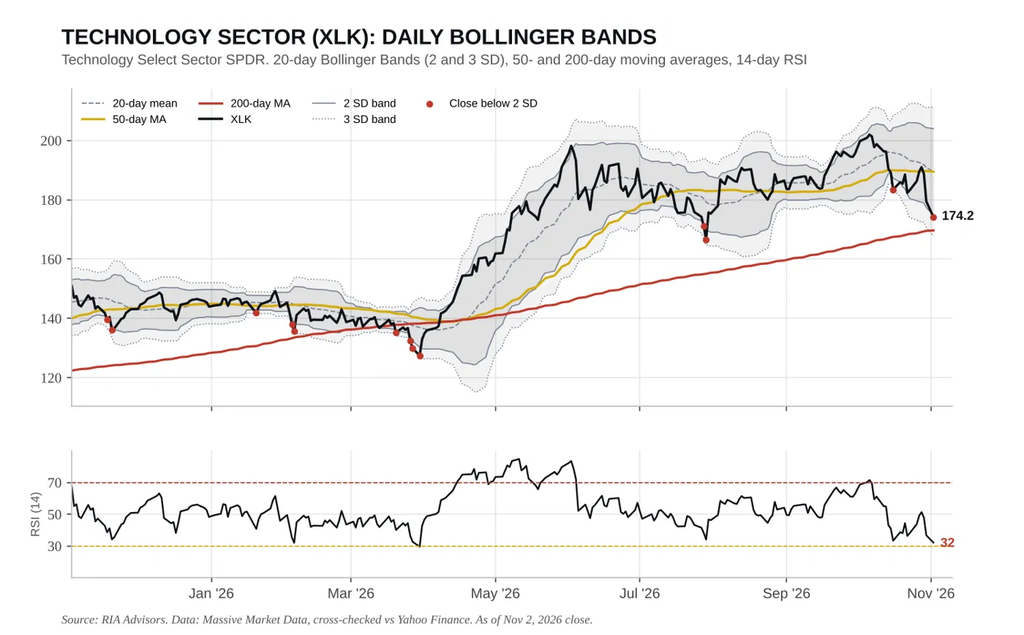
As long as the 200-day holds, this is a correction inside an uptrend. A break below it, however, does change the math, and is critical to pay attention to.
So, what are we doing? In the Factor Rotation model, we used overbought conditions in value to rebalance toward oversold conditions in growth. We are also planning to add technology exposure in tranches on weakness rather than all at once. Position sizes stay at target weights. If XLK closes decisively below roughly $169, we step aside and wait for the trend to repair. If it holds, history says patience gets paid.
Seasonality and history tilt the odds. They don’t remove the risk. Buy the dip with a plan, or the dip will happily buy you.
Is The Tech Sell-off Worse Than The Dotcom Bust?
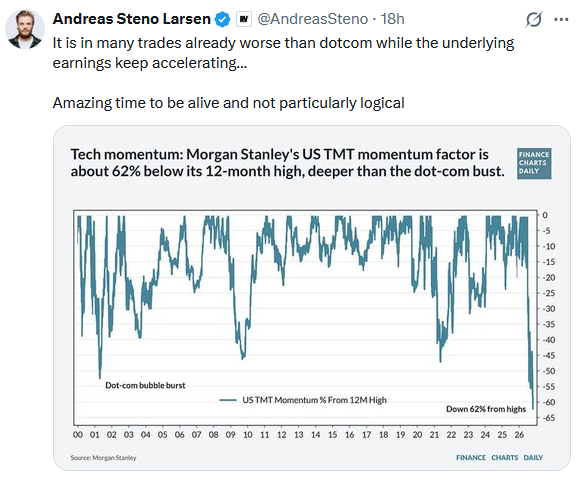
As we share below, Andreas Steno Larsen flagged a startling chart this week. It shows that Morgan Stanley’s US TMT momentum factor sits about 62% below its 12-month high, a deeper drawdown than the dot-com bust. He said this is happening “while the underlying earnings keep accelerating.”
A momentum factor is not an index of technology share prices. It is a long/short model that buys recent winners and sells recent losers. It profits when winners keep trending higher. So the 62% decline doesn’t mean tech and other recent market-leading stocks fell 62%. It means the strategy of owning what had already worked and selling laggards stopped working.
That understanding helps explain the paradox in his comment about the momentum factor failing amid rising earnings. Roughly 80% of companies have beaten earnings expectations this quarter, with S&P 500 earnings growth tracking near 27%.
Morgan Stanley’s Nick Savone says the selling “stems more from the concentrated unwinding of crowded positions than from a turn in fundamentals.” Goldman has called it structural rather than fundamental. Goldman’s distinction matters when comparing recent activity to the dotcom bust.
In 2000, the momentum longs were companies without earnings. The factor collapsed because the fundamentals underneath it failed. To wit, the promised revenue never arrived, and many of the stocks leading the momentum charge became worthless. Today, the momentum longs are among the most profitable companies. The momentum factor fell while fundamentals improved, the opposite configuration.
The factor fell 40% from its peak in 17 trading days, against a historical median pullback of 22% over 33 days. That timeframe suggests significant leverage and crowding unwinding is at fault, not a business model failing.
Note: Morgan Stanley does not publish the exact definition of this particular factor, so we described the general model rather than their specific rebalance rules, lookback window, or screening techniques.
Tweet of the Day


Comments
Log in or sign up to join the conversation.