


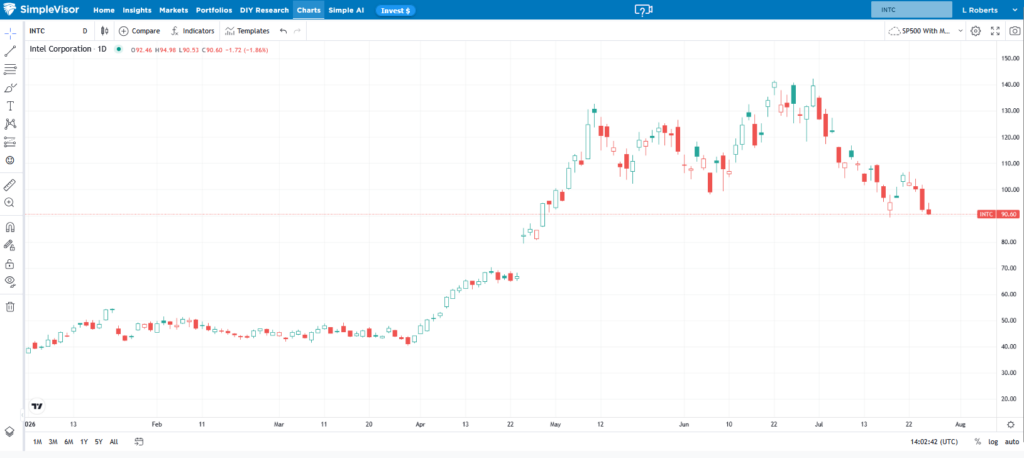
Last week, chip maker Intel (INTC) delivered its seventh consecutive quarterly earnings beat with revenue growing 25% year over year, its fastest growth since 2011. Its non-GAAP EPS of $0.42 doubled the $0.21 consensus. Data Center and AI revenue surged 59%, and 18A foundry output exceeded internal targets by roughly 25%. Intel shares initially jumped as much as 13% after hours, but despite the outstanding earnings report, the shares gave up much of their gains. Furthermore, fellow chip makers Broadcom (AVGO), AMD, and Micron (MU) were lower as well.
The lackluster price movement is a market tell. In late June, Intel was up over 250% year to date. Since then the stock has given up 30% from its high point. We saw a similar earnings reaction a day earlier with Alphabet (GOOGL). Their strong earnings were overshadowed entirely by spending concerns. The emerging thread in the technology and chip sectors is that market is no longer solely focused on potential growth, and appears to be questioning capex.
The recent history is not a chip sector rout. Fundamentals across AI infrastructure remain intact, and Intel’s own numbers prove real demand exists. But the momentum trade, buy any earnings beat, worry about capex later, appears to be fading. Investors are now pricing execution risk into stocks that spent the first half of the year getting a pass on it. This is a narrative shift worth watching as earnings season continues.
What To Watch Today
Earnings
Economy
Market Trading Update
In our weekend report, we discussed the AI capex bill coming due. This week’s hyperscaler prints tell us who can pay for it. Today, I want to read the part of the tape nobody is watching. The message underneath the index is very different from the one on the screen.
Start with the headline. The S&P 500 closed Friday at 7,411.98, roughly 0.8% below its 50-day moving average. That is its first decisive break of that line in months. Now here is what the headline hides. Through Friday, the equal-weight S&P 500 was up 11.5% for the year. The cap-weighted SPY was up just 8.4%. The average stock is beating the index by three full percentage points. Schwab (SCHW) notes that the percentage of index members above their 200-day moving average is at its highest level since December 2024. Nasdaq breadth, meanwhile, contracted.
Read that again. Breadth is EXPANDING while the index falls. We show this more visually in the next section.
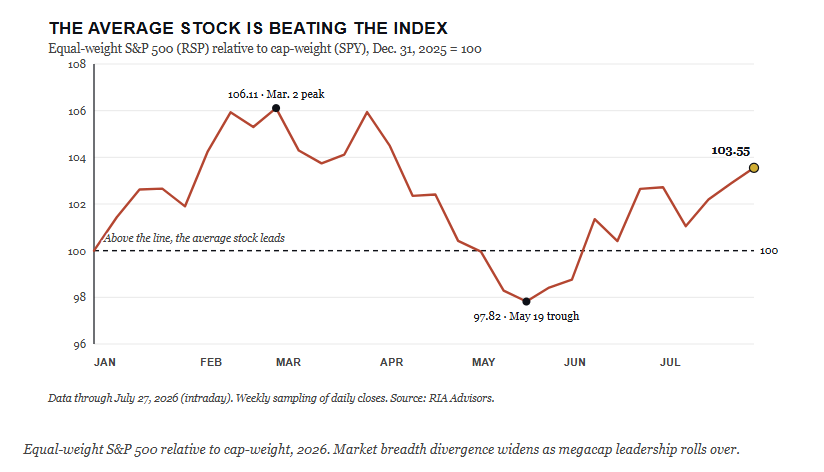
Notice in the chart above that the equal-weight line bottomed on May 19 and has climbed since. It is not a fresh high for the year; March was better, but the direction is unmistakable. Money isn’t leaving the market. It is leaving the top of it.
Last week’s cohort returns make the point more bluntly.
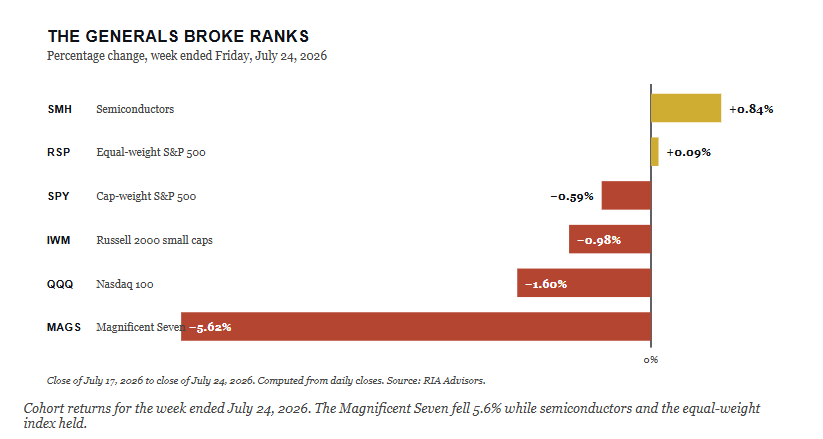
The Magnificent Seven fell 5.6% in five sessions. Semiconductors finished higher. The equal-weight index held a small gain while the cap-weighted index lost 0.6%. That is not broad risk-off. That is a leadership problem, and a narrow one. That is more uncomfortable than it sounds. A cap-weighted benchmark cannot rally on the average stock alone, and a handful of names still decide the print.
That is the entire risk in front of us. Broadening participation is healthy for the market and painful for the benchmark, and, unfortunately, most investors only track the benchmark.
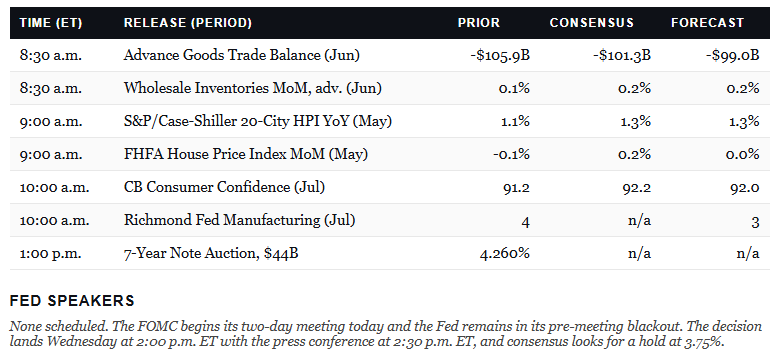
So what are we doing about it? Very little, and that is deliberate. SPY still sits 5.8% above its 200-DMA. This is a pullback inside an uptrend, not a break of one. We are holding the AI complex at the target weight while the consolidation/correction process erases current concerns over capex spending and depreciation. We are not adding ahead of this week’s Megacap earnings or tomorrow’s Fed decision. Buying risk into two binary events isn’t analysis, it’s hope.
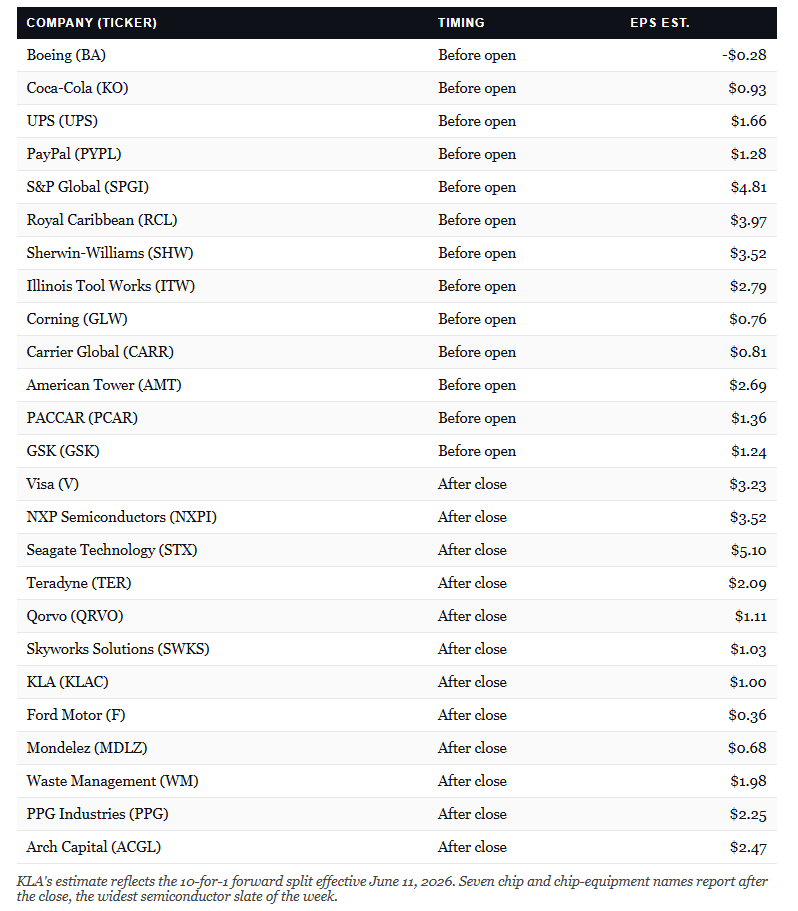
Seven chip names report after today’s close. They now trade on their own fundamentals rather than as a hyperscaler derivative, and that is worth watching closely. Where we are willing to lean is the side the money is already moving toward. We keep equal-weight and broad-market exposure at full weight rather than trimming it to chase the generals back.
Until then, manage risk at the line, keep the dry powder, and let the reports come to you. Capital preservation first. Trade accordingly.
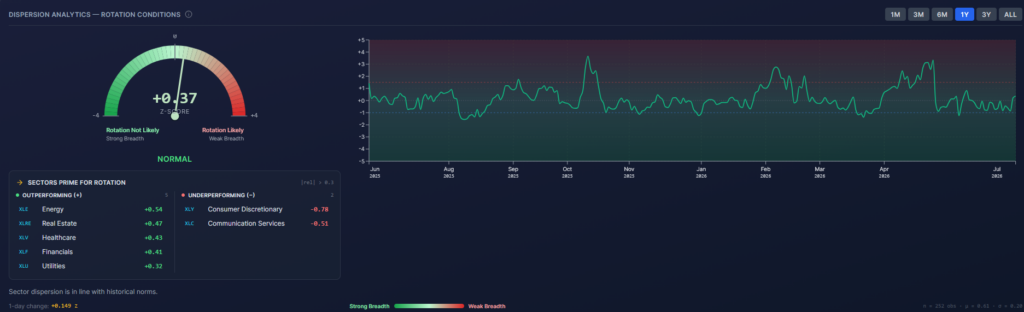
Market Breadth Weakens But Not In The ‘Usual’ Way
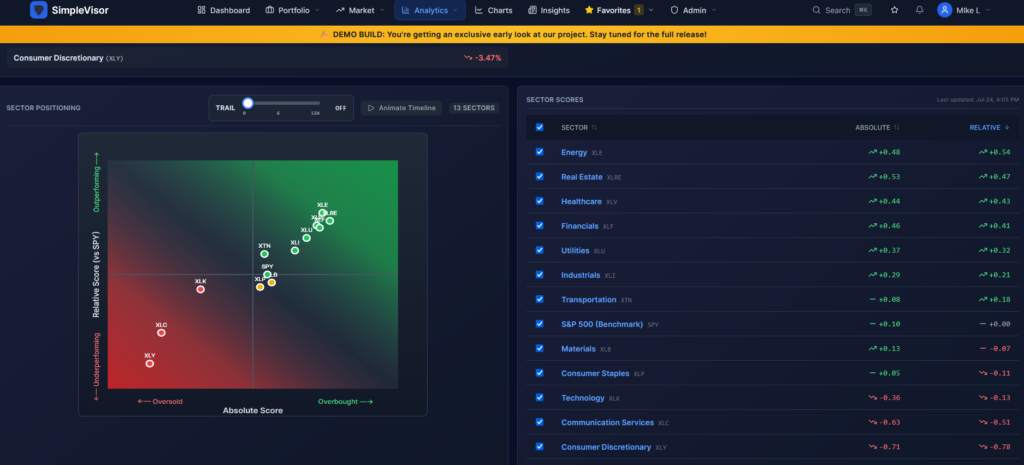
The graphics below are from our new coming-soon version of SimpleVisor. We are now in the beta-testing phase and hope to roll it out to all users shortly. Stay Tuned!
It seems that poor market breadth recently was the result of technology, communications, and, at times, discretionary sectors being overbought and outperforming while safer, more value-oriented sectors were underperforming. Today’s instance of weakening breadth is the opposite. The scatter plot on the left side of the first graphic below shows the dots have spread out over the last few weeks, favoring the more value-oriented, higher-dividend sectors, while yesterday’s leaders are the most oversold.
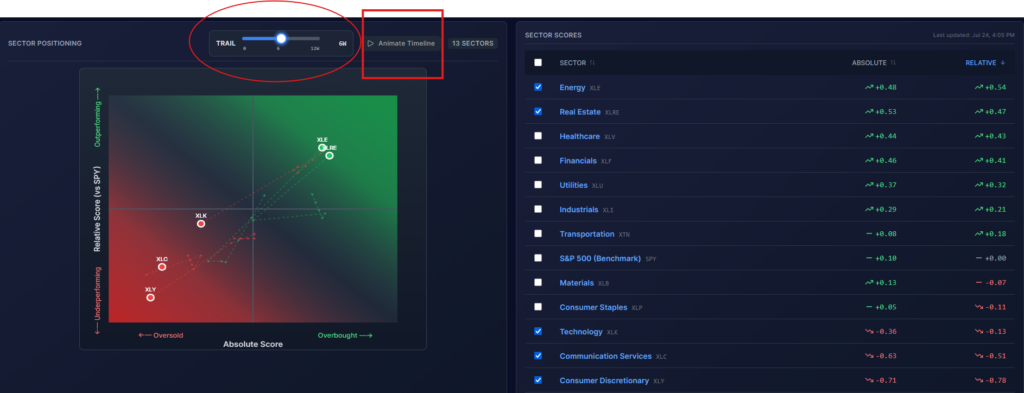
For those not closely following the absolute and relative scores on a daily or even weekly basis, you may not appreciate whether breadth is improving or worsening. SimpleVisor allows you to put “tails” on the score. As we circle in the second graph below, we highlighted five sectors to show how they have rotated over the last six weeks. This ability is in the current SimpleVisor, but as we highlight with the red box, the new version will allow users to animate the movements over various time periods. This feature allows you to watch up to 12 weeks of rotations for all or selected sectors, factors, portfolios, and custom-made lists. The tool will help you better appreciate relationships and guide you in determining if there is a rotation in progress or one likely to occur.
Are US Treasuries Still A Safe Asset?
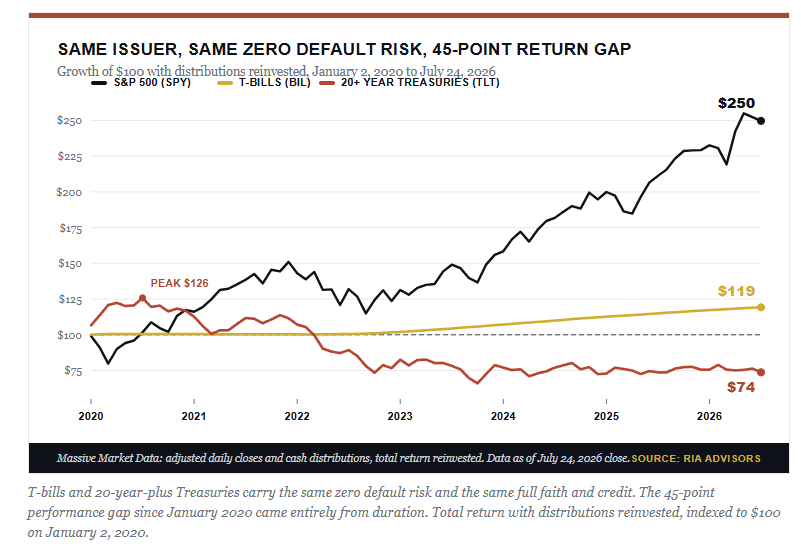
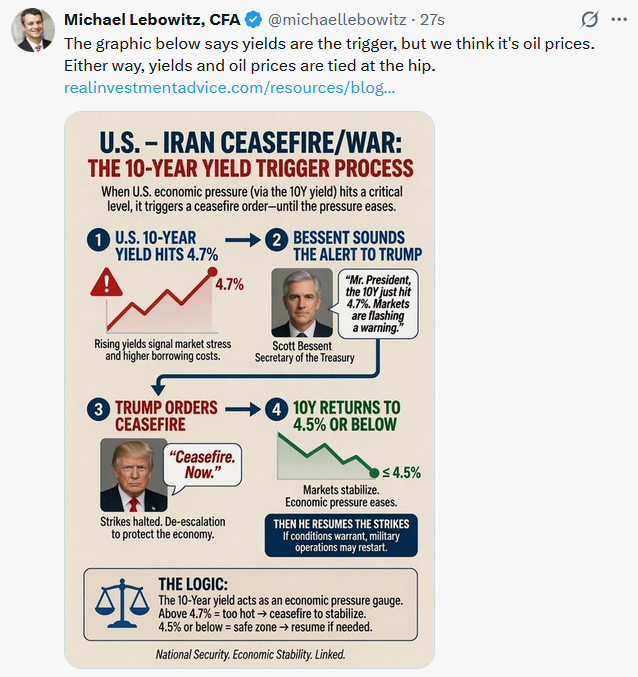
The 30-year Treasury bond closed last Thursday at 5.17%. Meanwhile, the 10-year touched 4.71%, its highest print since January 2025, while Brent crude pushed above $100 as the Iran conflict escalated. Add a Fed meeting this week, and right on schedule, the Treasury safe asset debate reopened. A careful new paper from Hanno Lustig and three coauthors is now getting cited as proof that the world’s reserve asset is finished. I’ve read the paper, and it is good work. It also doesn’t say what most of the people quoting it think it says.
Between June 26 and July 23, the long bond repriced up 30 basis points (bps). The five-year moved 34 bps, and the 10-year moved 33 bps. And the one-month bill? 12 bps. That distribution is the entire story, and almost nobody writing about this week’s yield spike bothered to look at it.
Here’s why it matters. If markets were genuinely repricing the odds that Washington fails to pay, the front end would move hardest. Default risk applies to the payment due in four weeks just as much as to the one due in 2056, and short paper carries no term premium to cushion the blow. Instead, the bill barely budged. Bond investors weren’t questioning whether they would get paid. They were demanding more compensation for inflation and duration, which is a completely different trade. Treasury safe asset status was never in question; only the price of duration was.
Tweet of the Day


Comments
Log in or sign up to join the conversation.