

China’s exports and imports surged to the highest levels since the pandemic-skewed 2021, as the tech boom supports growth on both fronts. Oil imports, meanwhile, continued to slide sharply in June, as any potential buying amid the drop in crude prices hasn't yet shown up in the data.
Source: Shutterstock
Exports and imports have both grown well beyond expectations in 1H26
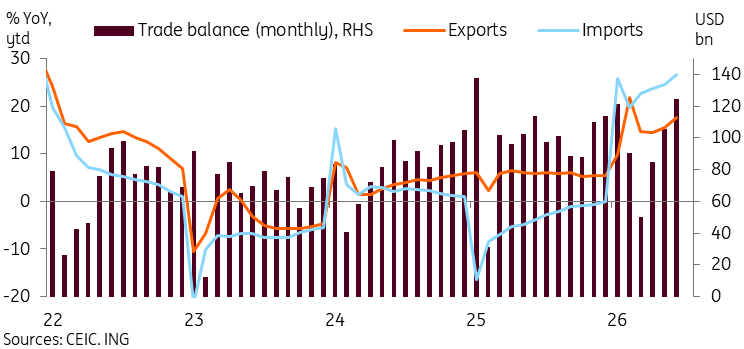
Exports surged to a 53-month high amid hi-tech export outperformance
China’s exports surged to 27.0% year-on-year in June, up from 19.4% in May, comfortably beating all of the market forecasts (market: 19.0%, ING: 17.4%). Through the first half of the year, exports rose 17.6% YoY to $1.55tr.
The mechanical and electrical product category was a primary driver of export strength, growing 34.2% YoY in June. Within this category, semiconductor (121.9%), auto (69.6%), and ship (42.3%) exports all accelerated. Overall, hi-tech product exports continued to fare well, growing 52.2% YoY, raising the first-half export growth to 38.5%. Through the first half of the year, China's fastest-growing export categories include semiconductors (96.1%), rare earths (61.1%, albeit on a small scale), autos (53.9%), and ships (29.4%). Laggards include toys (-11.3%), footwear (-8.6%), steel (-5.4%), and furniture (2.6%).
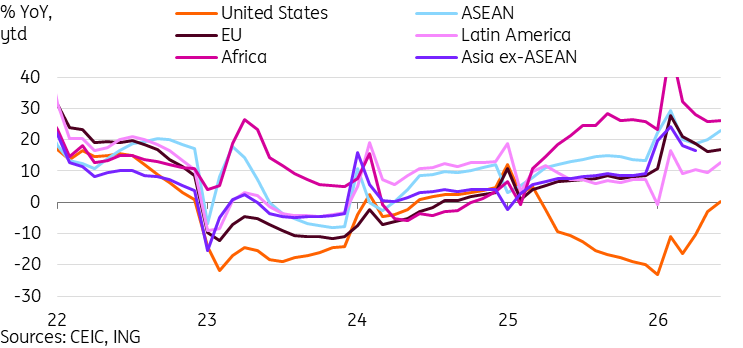
By destination, we saw trajectories diverge in June. Exports to ASEAN (34.5%), EU (18.5%), and Korea (42.6%) accelerated, while exports to the US (13.9%) and Japan (6.9%) slowed. Through the first half of the year, we can see that the semiconductor trade is the strongest-growing segment. Exports to Taiwan (32.9%) and Korea (31.0%) were among the fastest growth rates. Other areas seeing strong year-to-date growth include China's largest trading partner, ASEAN (22.9%), Africa (26.2%), Russia (28.4%), and the EU (16.8%). After June's data, exports to the US are now marginally positive in YoY terms at 0.2%.
Exports have been one of China's primary growth engines in recent years, and this year's acceleration continues to beat expectations. Exports over the first half of the year already nearly match the levels seen through the first 7 months of 2025. The base case is for solid export growth to continue.
However, two risks we're watching closely are the Russia sanctions bill by late US Senator Lindsey Graham, which proposes secondary sanctions of up to 500% on buyers of Russian oil and gas, and the potential tariff hikes coming from the EU. These factors could potentially throw a wrench in the excellent export performance so far.
Exports to the US have returned to positive territory in 1H26
Imports reached the highest level since June 2021
Imports grew by 36.0% YoY in June, up from 27.4% in May, and well above forecasts (market: 26.1%, ING: 24.0%). This marks a 60-month high for import growth.
By product, similar to the export picture, the broad mechanical and electrical product category was also a major contributor to import strength, growing 47.5% YoY in June. Within this category, imports of Automatic Data Processing Machines and parts (156.7%) and semiconductors (72.3%) grew particularly strongly. Hi-tech imports also continued to surge, rising 57.8% YoY to a record high of $106.7bn in June. Coal also saw a 60.7% YoY surge in imports in June.
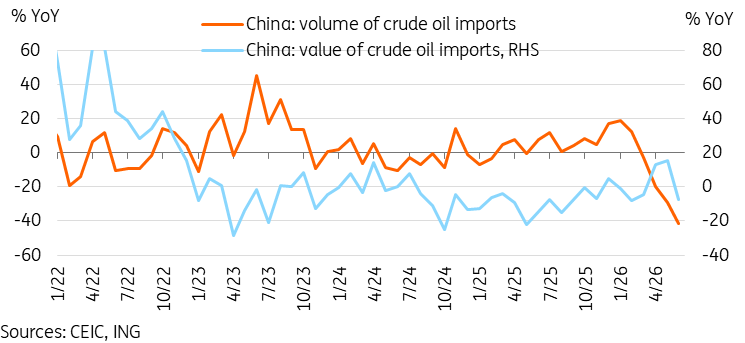
Those looking to the June data for signs of a return to China in oil markets are likely to be disappointed. Crude oil imports were down 7.5% YoY in value terms and 41.3% in volume terms. The June crude oil imports of 29.3mn barrels were the lowest monthly volume since 2016. Reports suggest that buying has resumed, but it may take time for these orders to be reflected in the data.
By destination, we saw strong import growth from Korea (85.0%), Taiwan (41.1%), with imports also reflecting the other side of the tech trade. Imports from Japan (34.0%) and the US (25.9%) were below headline growth, but also recovered on the month.
Through the first half of 2026, the import picture is very imbalanced. Tech-related imports have dominated, while other import categories remain weak, reflecting the weak domestic demand environment. This growing divergence of China's economy is likely to be highlighted when the domestic activity data comes out next week.
Oil import data has not shown a significant recovery of Chinese oil buying yet
Trade balance surprises on upside, offers support to 2Q growth
Both exports and imports beat forecasts in June, and the net effect was the trade surplus rising to $125.6bn, the highest level since January 2025. This came in a little stronger than forecasts (market: 120.1, ING: 120.1) as well.
Through the first half of the year, the trade surplus is actually down -1.3% YoY in USD terms, and -4.8% in RMB terms, thanks to the strong growth of imports. Intuitively, this suggests that the contribution to GDP should be negative. But that wasn't the case in the 1Q data, and it’s unlikely to be the case when the 2Q data comes out next week. Adjustment effects should deliver another positive lift from net exports when the data lands — and it will be badly needed given the past quarter’s slide in investment and consumption.
The direct impact from the trade balance aside, external demand is also one of the core pillars supporting industrial activity, a bright spot in the monthly activity data. It remains a key engine of growth for China and is likely to remain so for the rest of the year.



Comments
Log in or sign up to join the conversation.