

Bank of America Fund Manager Survey Update
On Tuesday, we put out a summary of the monthly Bank of America “Global Fund Manager Survey.” This month they surveyed 200 institutional managers with ~$517B AUM:
Here were the 5 key points:
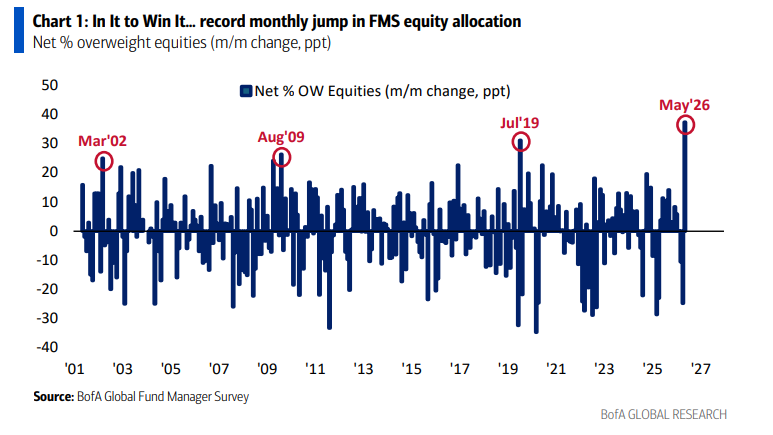
1) Net equity allocation posted its largest monthly jump on record in May, with managers piling into equities at a pace not seen outside prior extremes such as Mar ’02, Aug ’09, and Jul ’19. These flows are coming from the same crowd that puked in the hole on the way down, now forced to chase back in at much higher prices and extend the rally as they go. With those flows now starting to slow and positioning already heavily extended, the obvious question becomes who is left to buy from here.
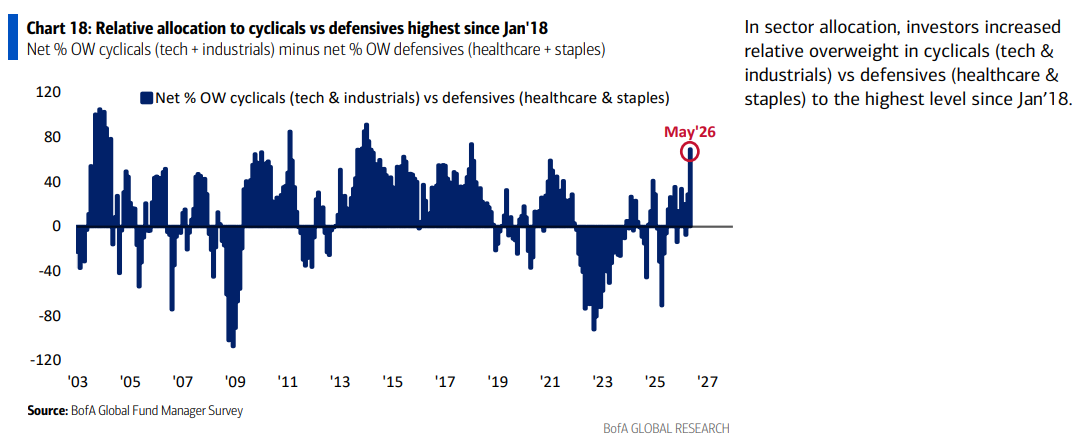
2) Relative allocation to cyclicals versus defensives (tech and industrials versus healthcare and staples) has climbed to its most stretched level since January 2018. We continue to view these “boring” sectors of the market as attractive opportunities to add exposure, especially in the context of a volatile midterm election year, where healthcare has outperformed 80% of the time and by an average of ~6 percentage points going back to 1970.
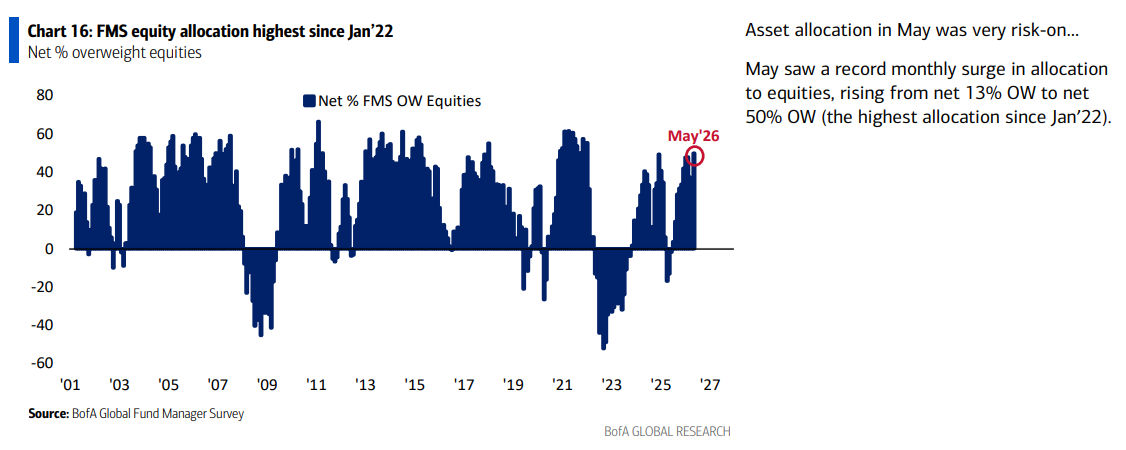
3) FMS equity allocation jumped from a net 13% overweight to a net 50% overweight in May, the highest since January 2022 and a record single-month move of +37 percentage points. While we remain constructive on a long-term basis, this is exactly the kind of stretched positioning and chasing that suggests the market is due for a near-term breather, and as noted on last week’s podcast, we are now positioned accordingly in what we view as one of the most crowded trades in the market.
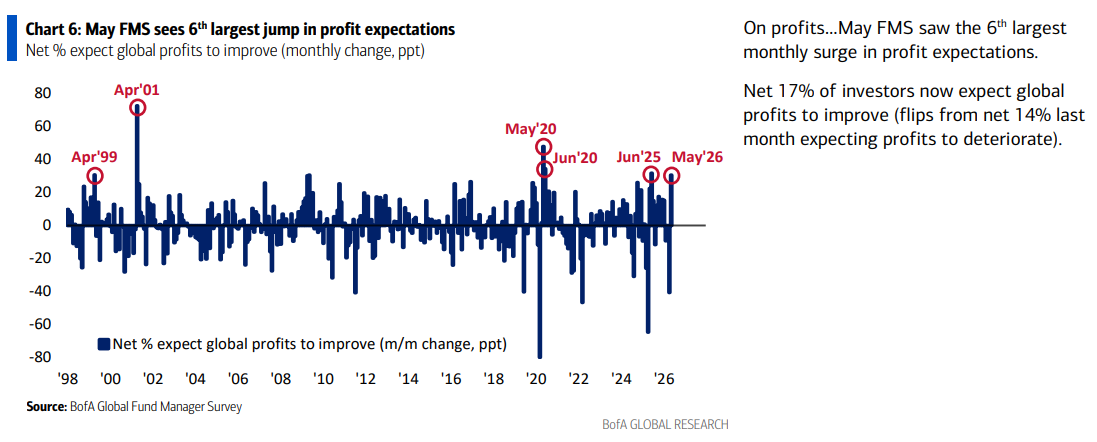
4) Net profit expectations posted the sixth-largest monthly jump on record in May, with a net 17% of managers now expecting global profits to improve, flipping from a net 14% expecting deterioration just last month. This supports our constructive view on a long-term basis, with the earnings engine still firing on all cylinders, even as we acknowledge near-term froth.
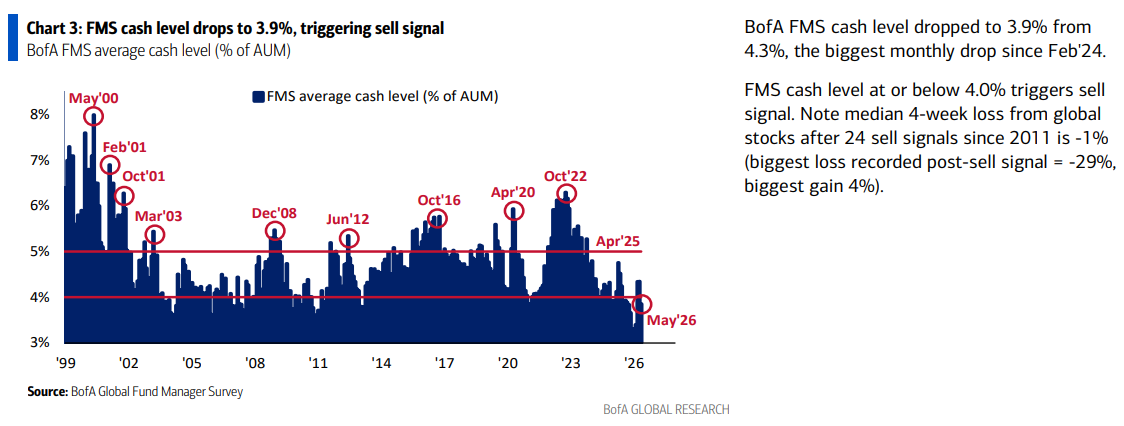
5) FMS average cash levels dropped from 4.3% to 3.9% in May, the biggest monthly decline since February 2024 and enough to trigger the BofA “Sell” signal. Across the 24 sell signals since 2011, the median four-week decline for global stocks is roughly -1% (biggest loss -29%, biggest gain 4%).
Alibaba (BABA) Update
For newer readers, here’s a quick overview of the key drivers behind our thesis on Alibaba, the toll taker of the Chinese consumer recovery and the cheapest way to play AI globally:
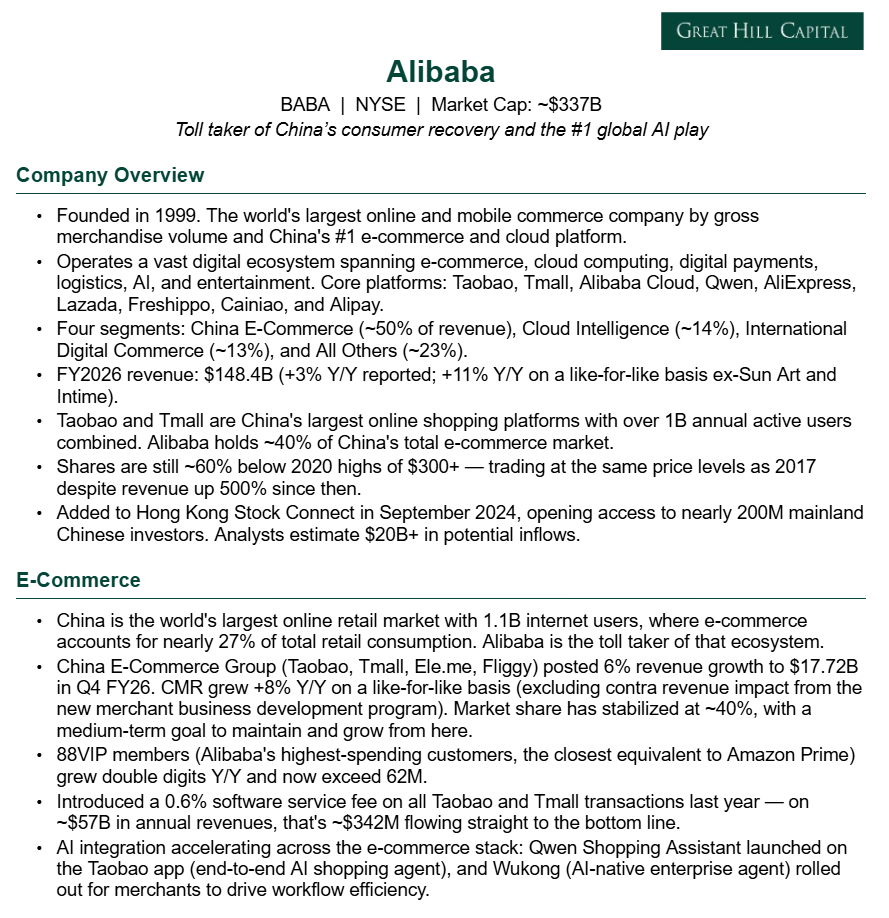
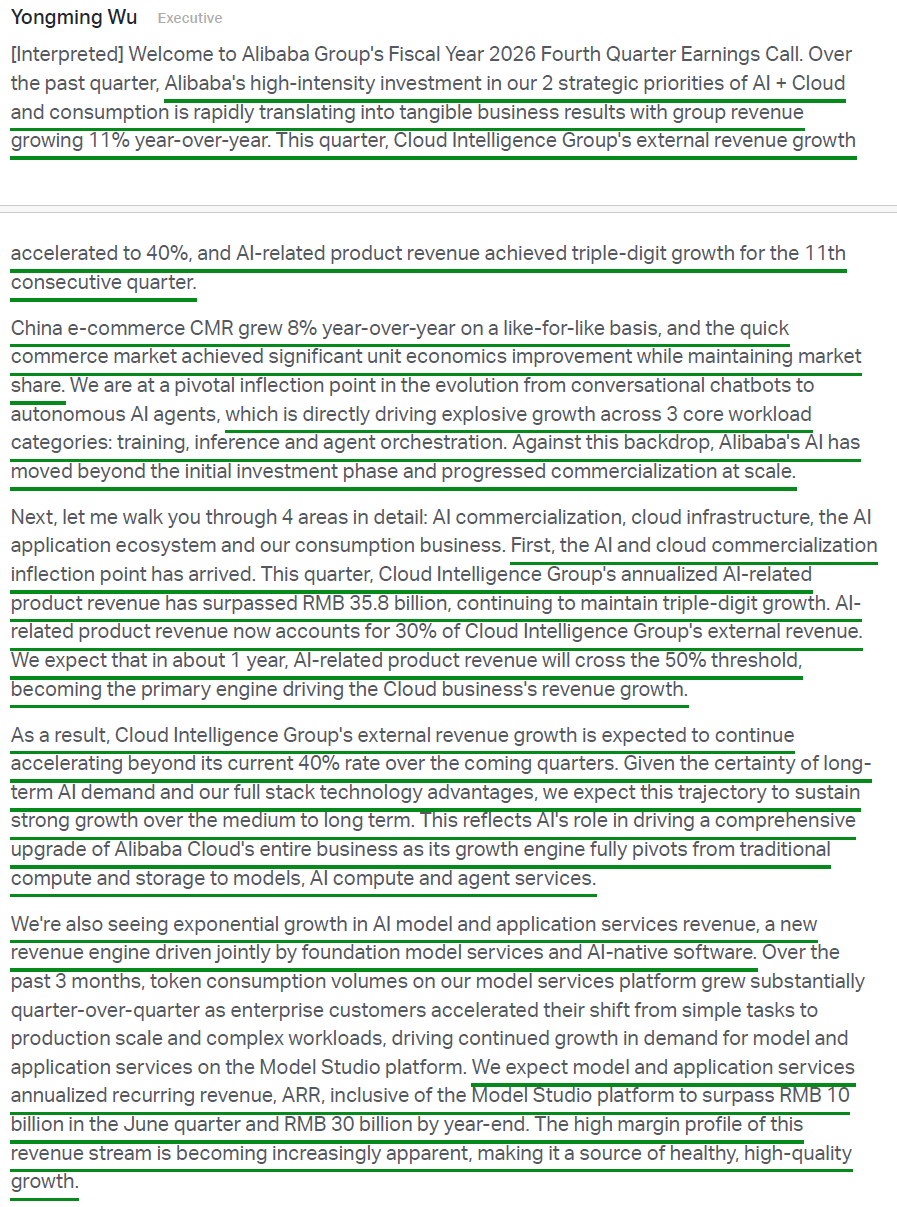
At face value, Alibaba’s fourth quarter looked pretty ugly. If you only read the headlines, you would think the wheels were coming off the business. That simply isn’t the case. While some of the headline figures made for easy material for commentators to run with, a closer look beneath the surface revealed a very different story: an accelerating core e-commerce business, a management team deliberately leaning into investment mode, and an increasingly dominant Cloud/AI segment beginning to show tangible returns.
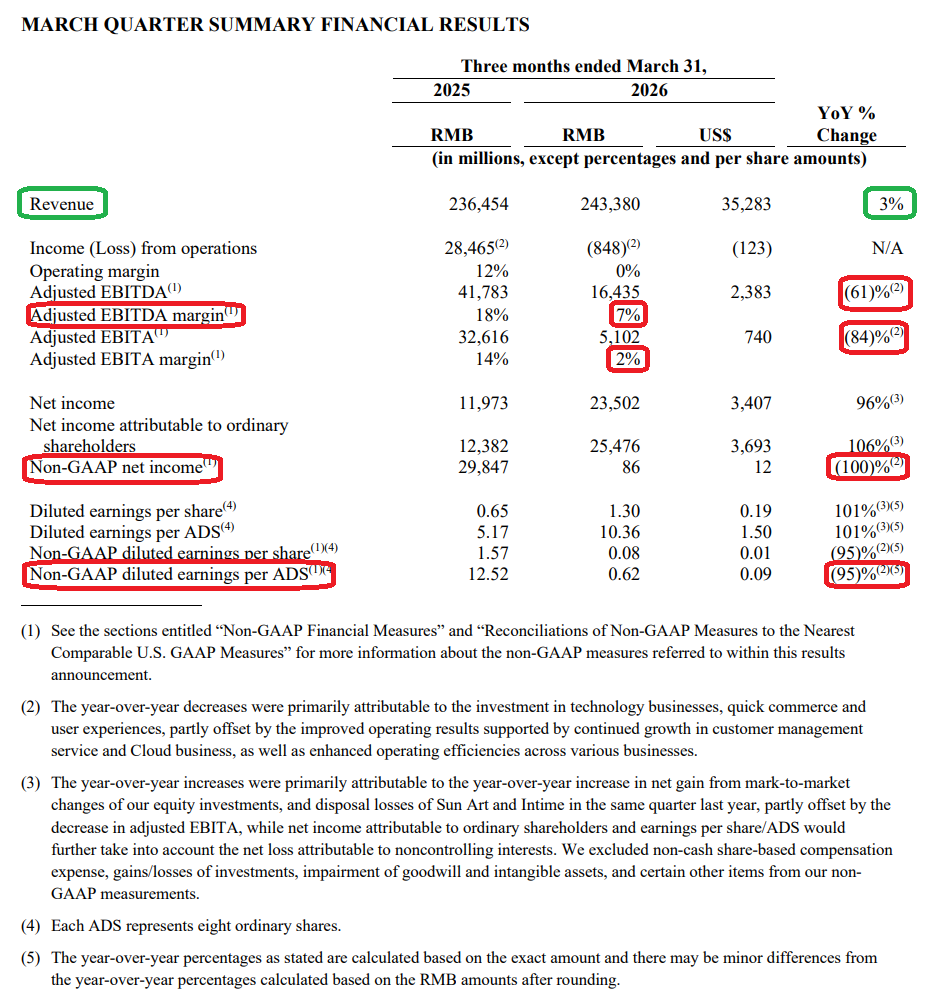
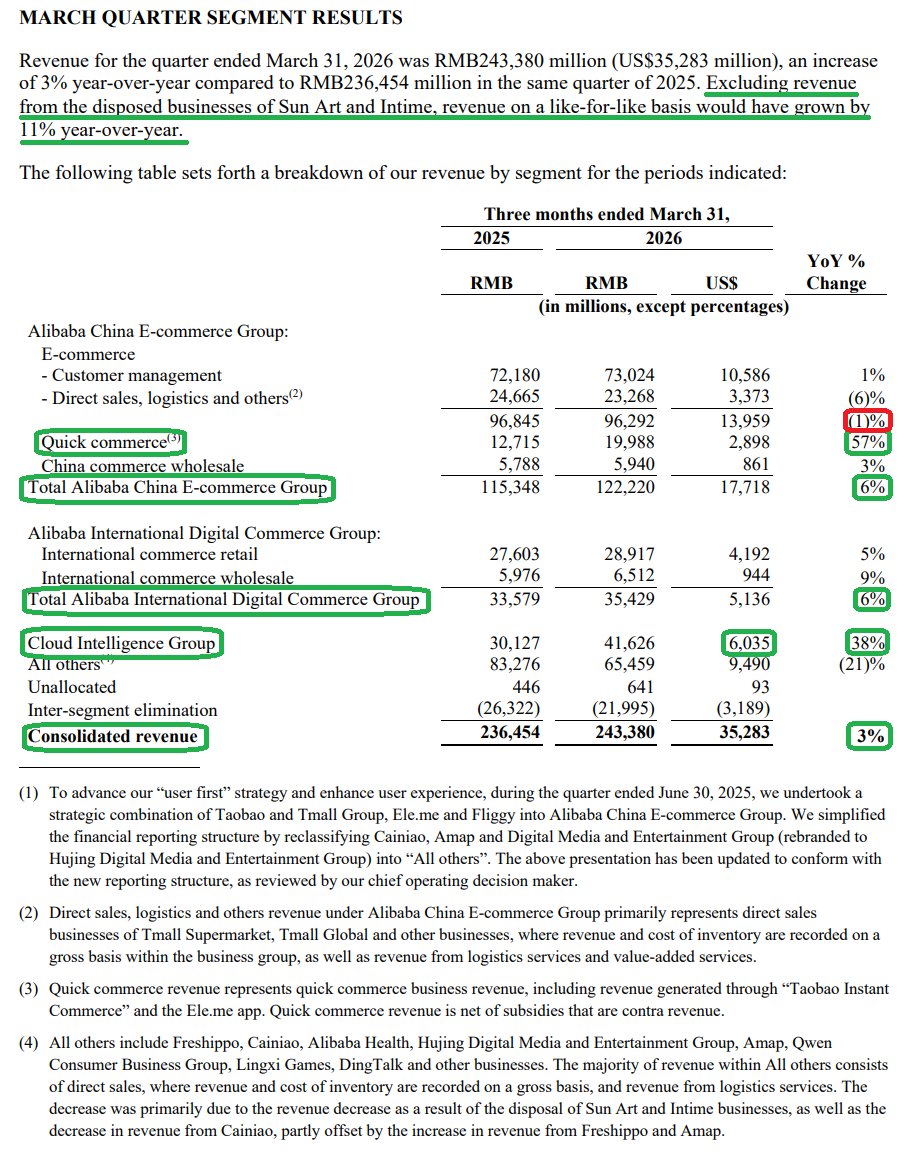
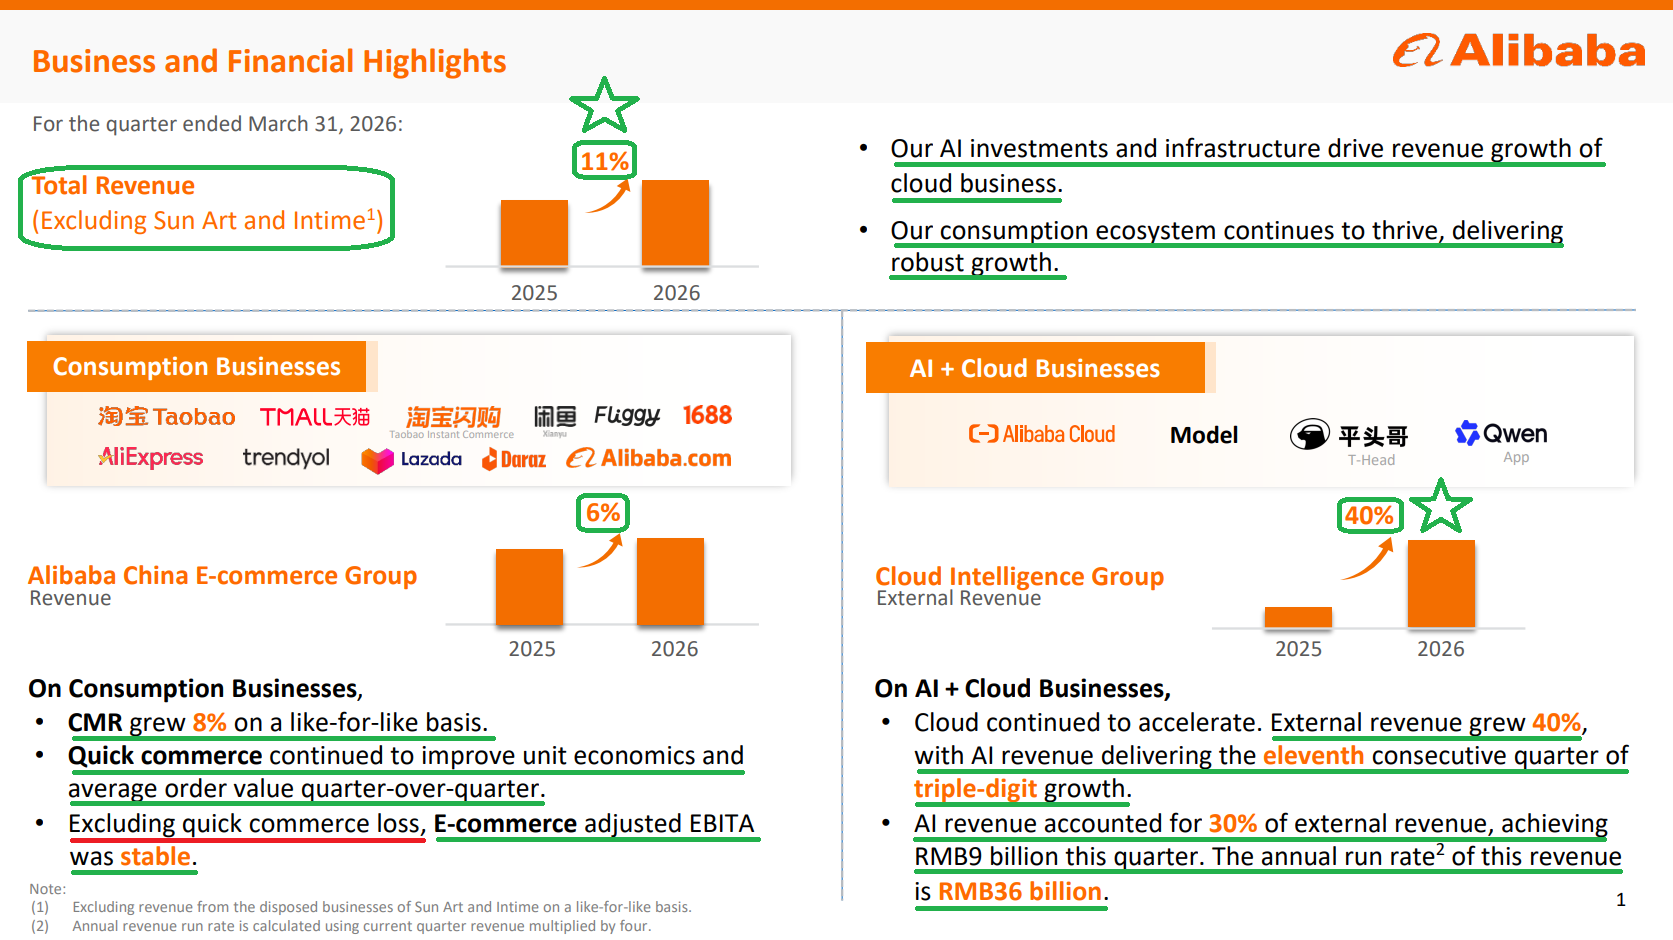
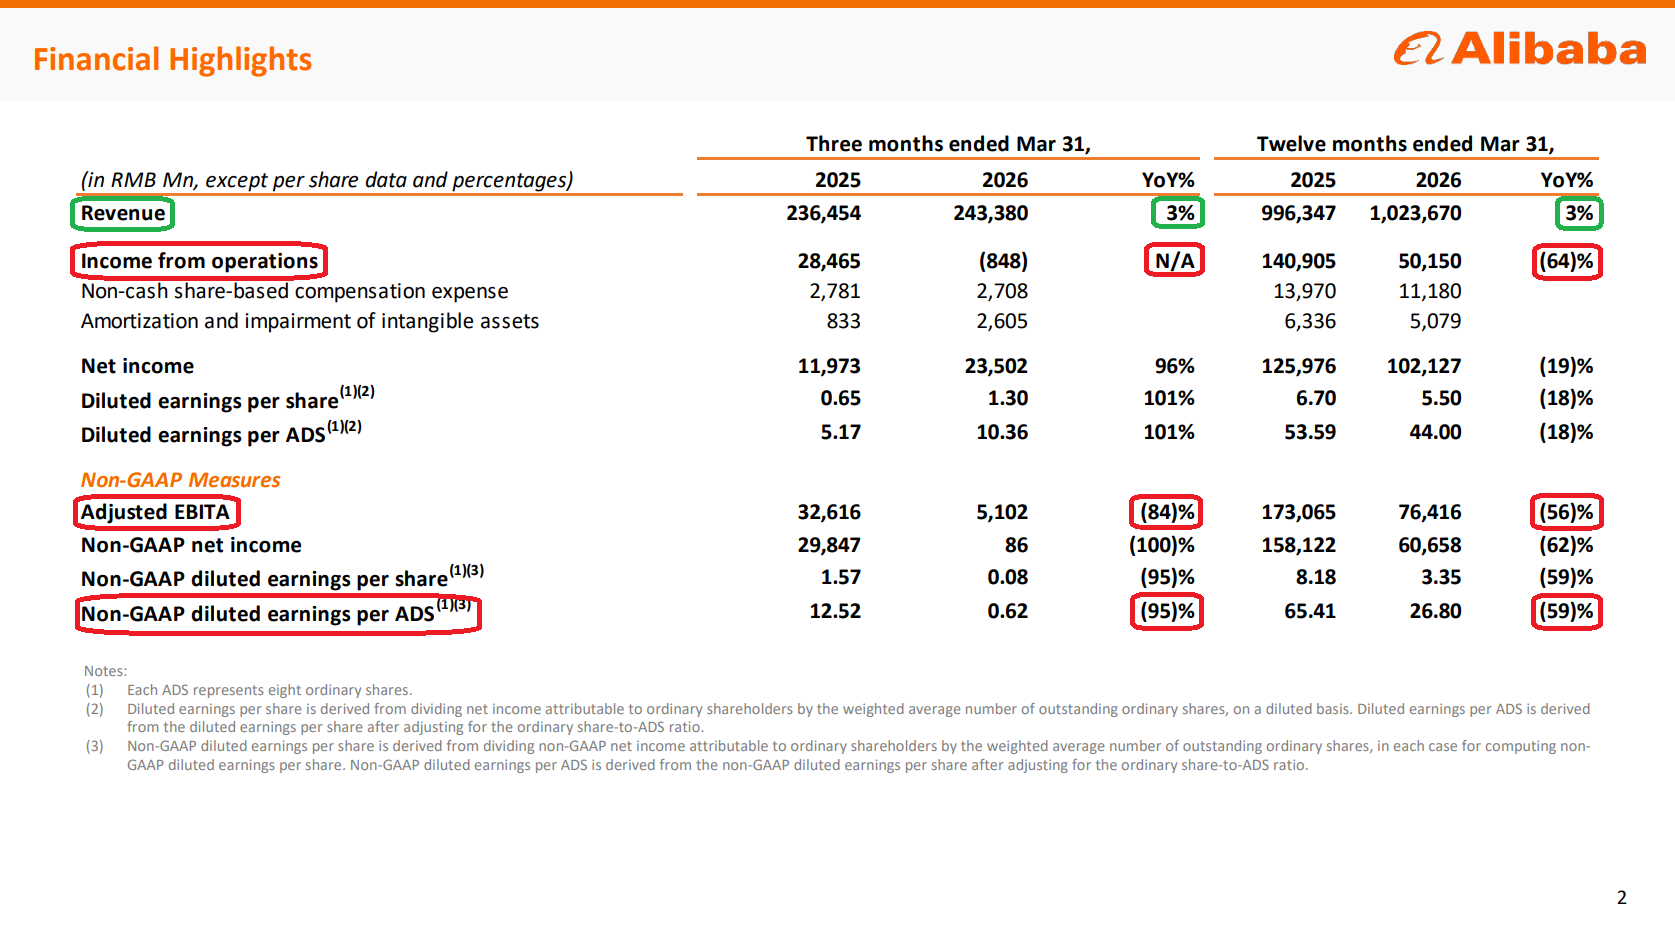
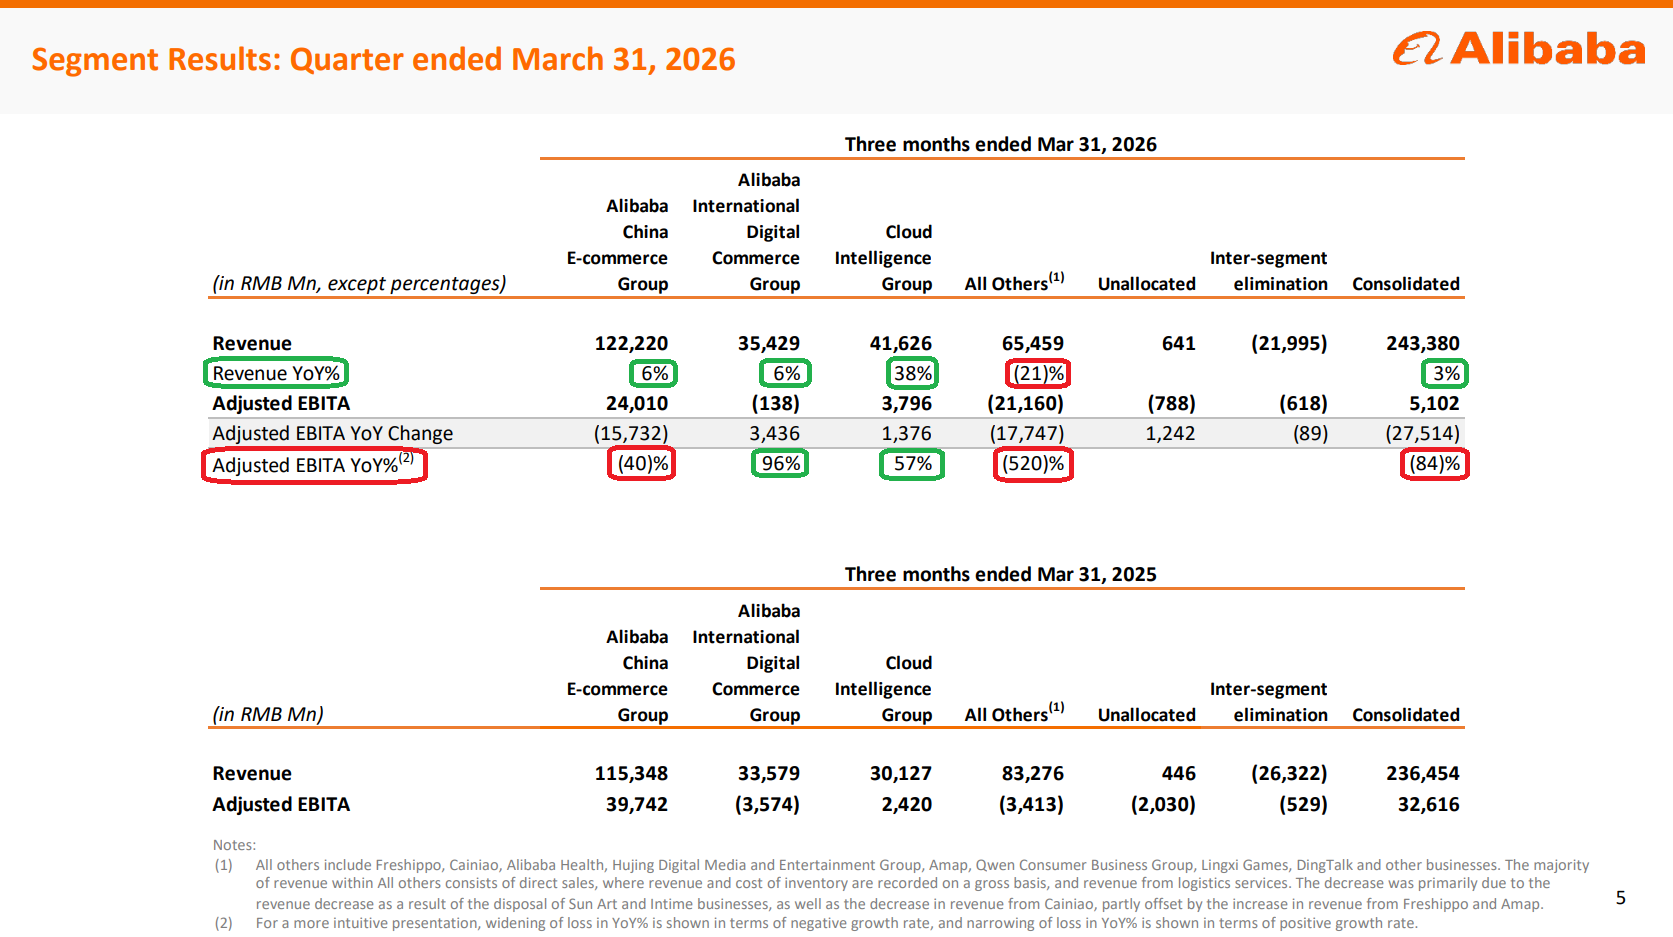
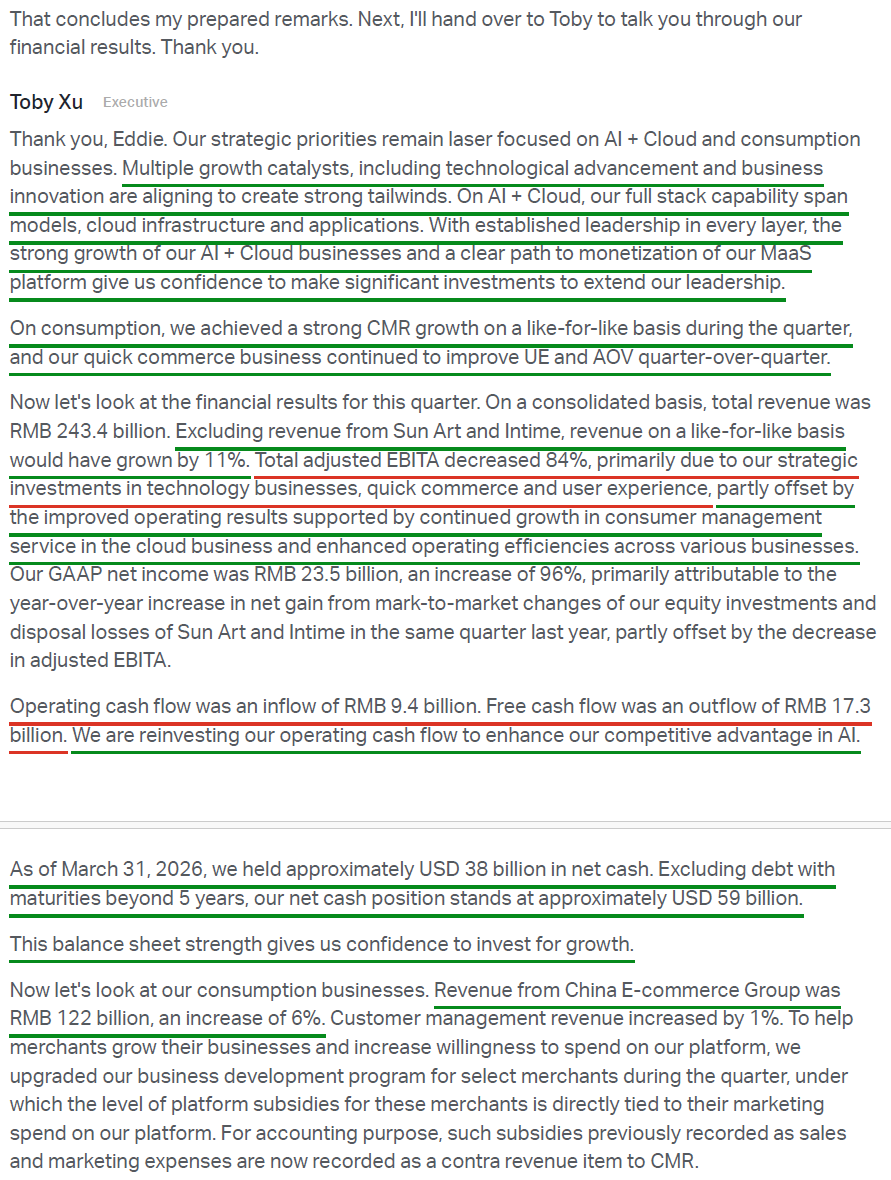
Starting with the top line, the reported revenue figure appeared disappointing at $35.3B, up just 3% Y/Y. However, backing out the disposed of non-core brick-and-mortar businesses of Intime and Sun Art, revenue grew 11% on a like-for-like basis, accelerating from 9% in Q3. In other words, the underlying business is not slowing down. It is speeding up.
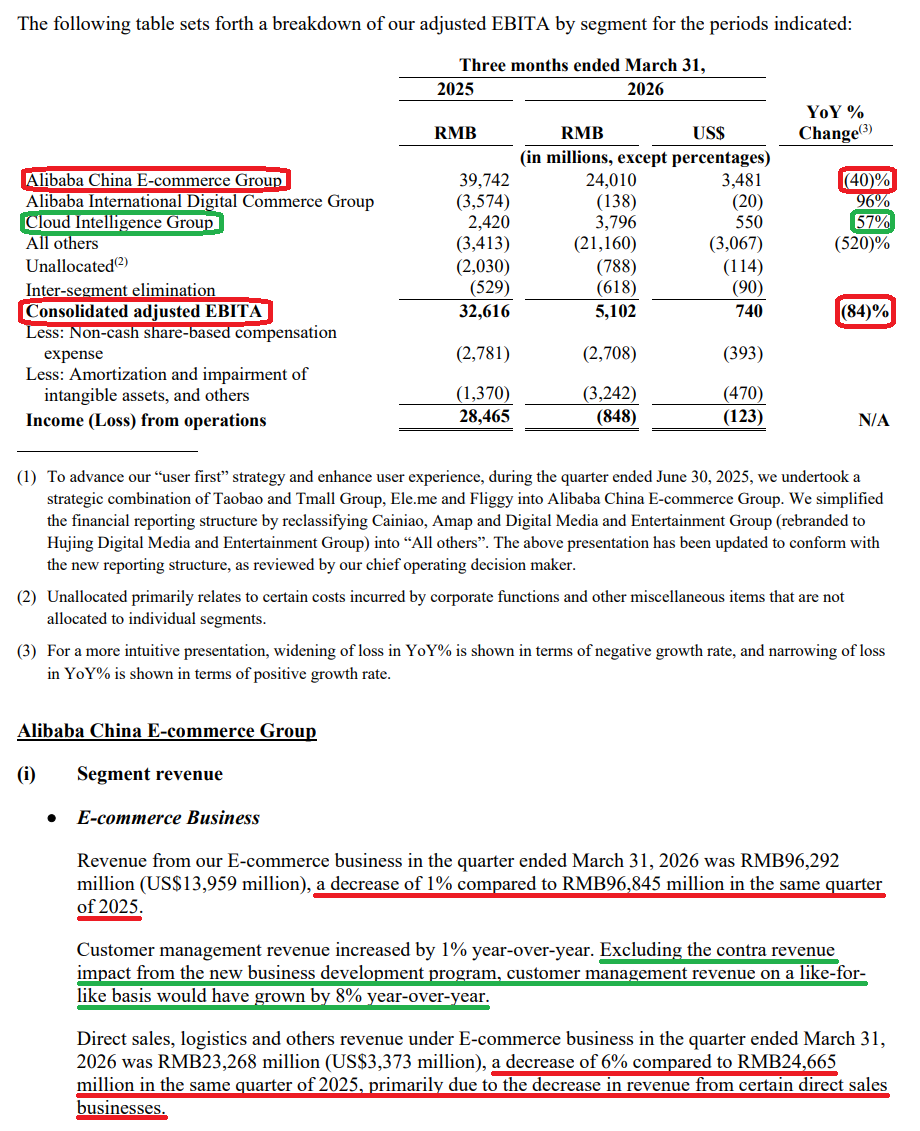
The biggest headline grabber was adjusted EBITA, which fell 84% to just $740M and drove Alibaba’s first operating loss since the Covid lows of 2021. Again, context matters. This was not the result of a deteriorating core business, but rather an intentional decision by management to aggressively invest in quick commerce, an on/off switch fully within management’s control and something they have been extremely transparent about. Excluding these investments, profits at the core e-commerce segment were effectively stable year over year.
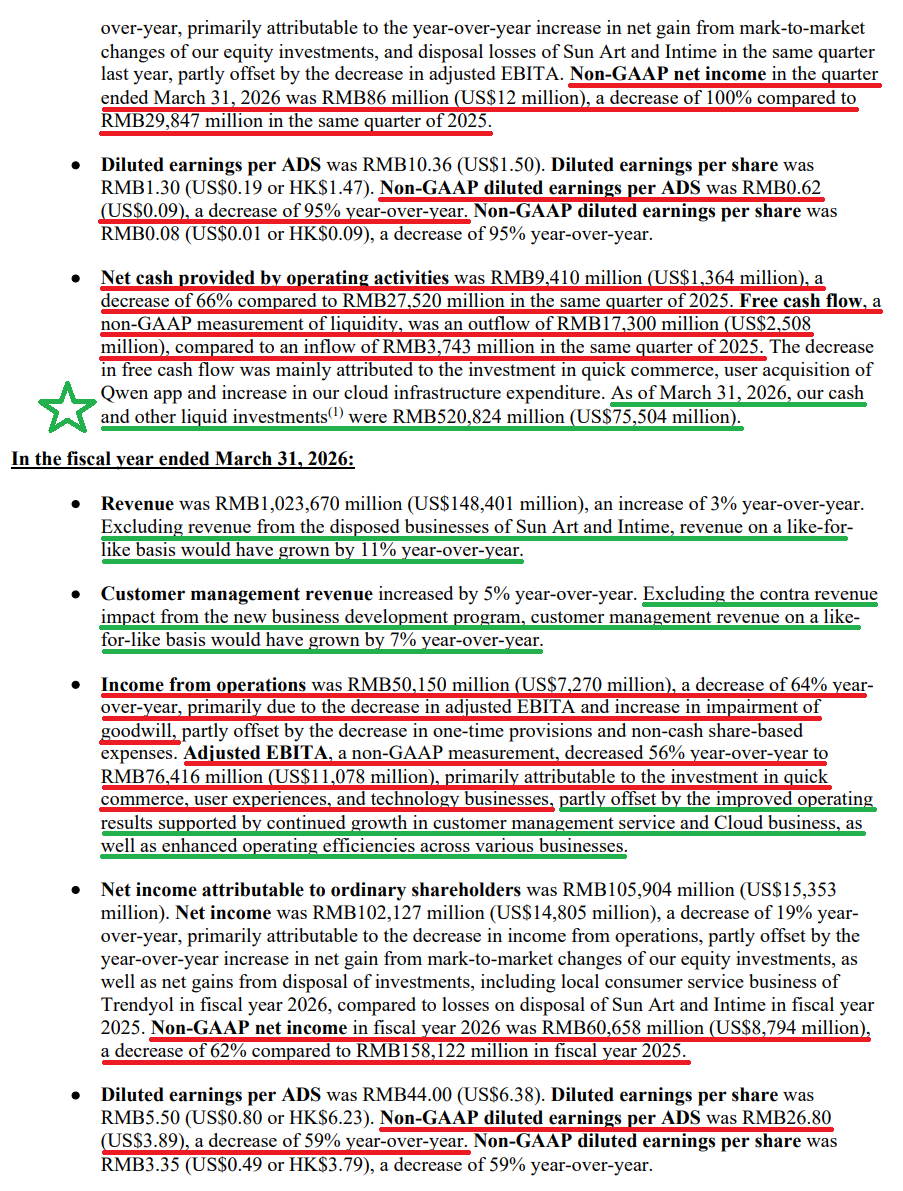
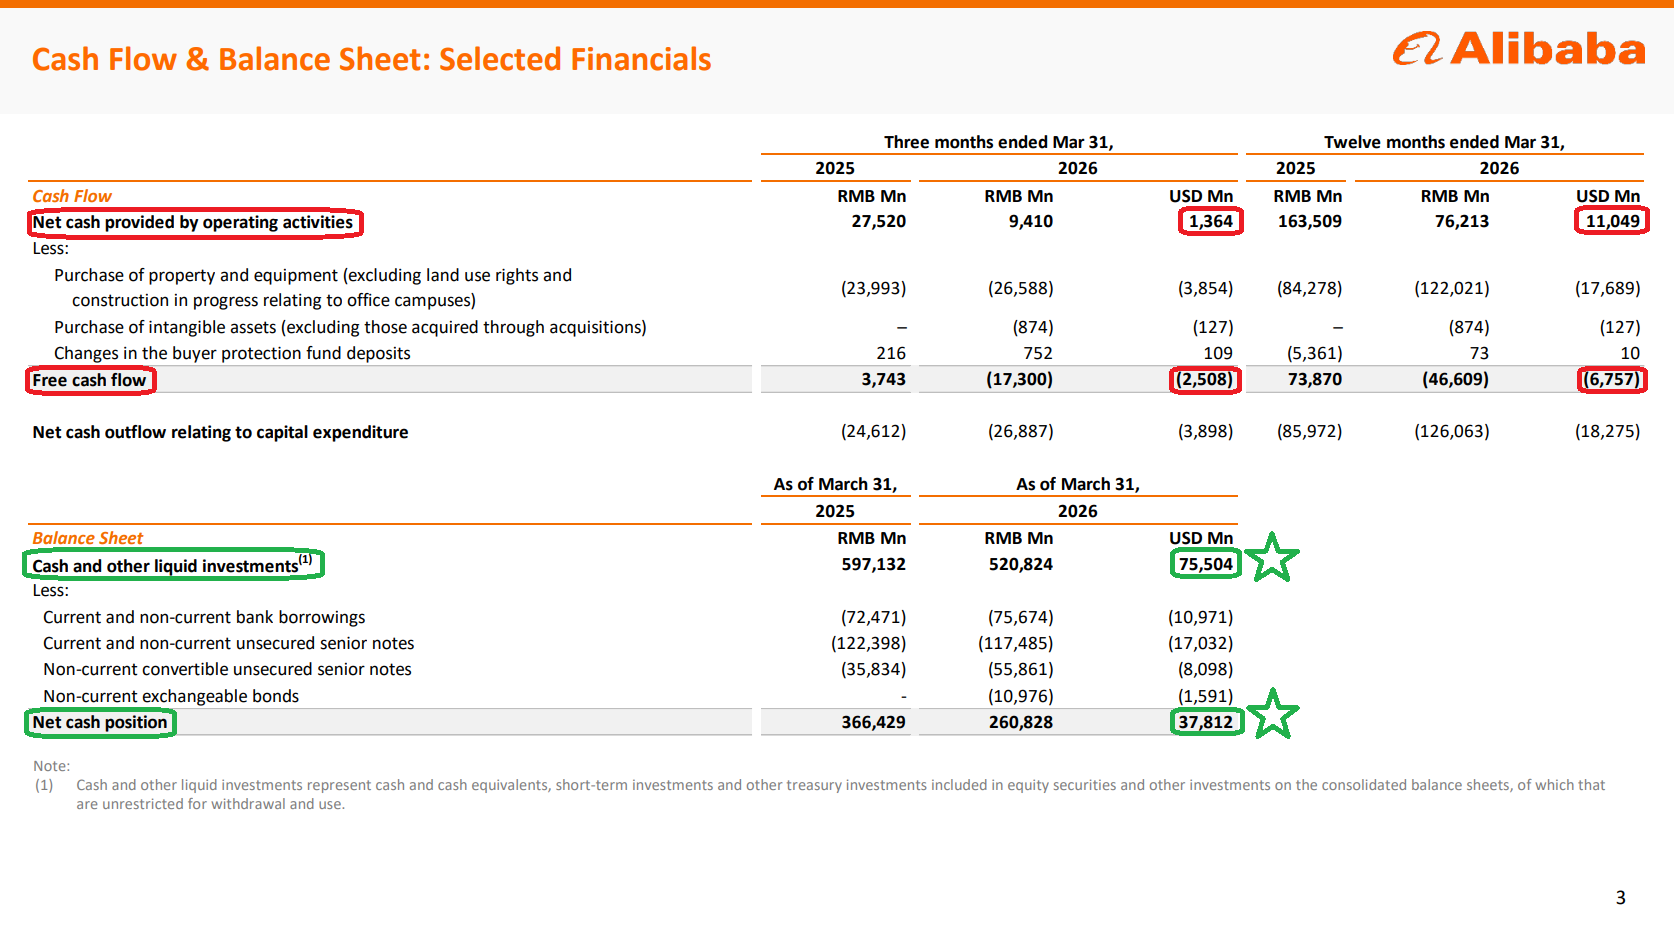
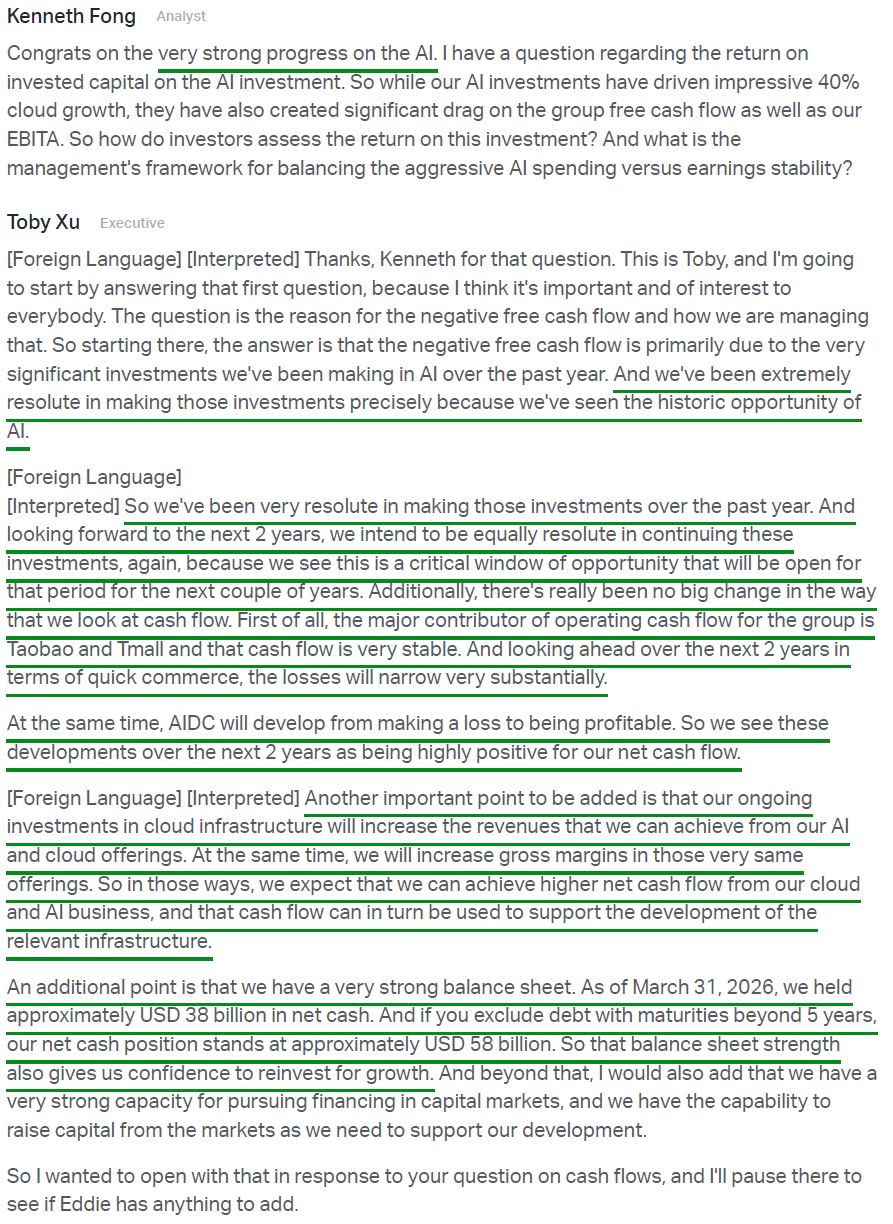
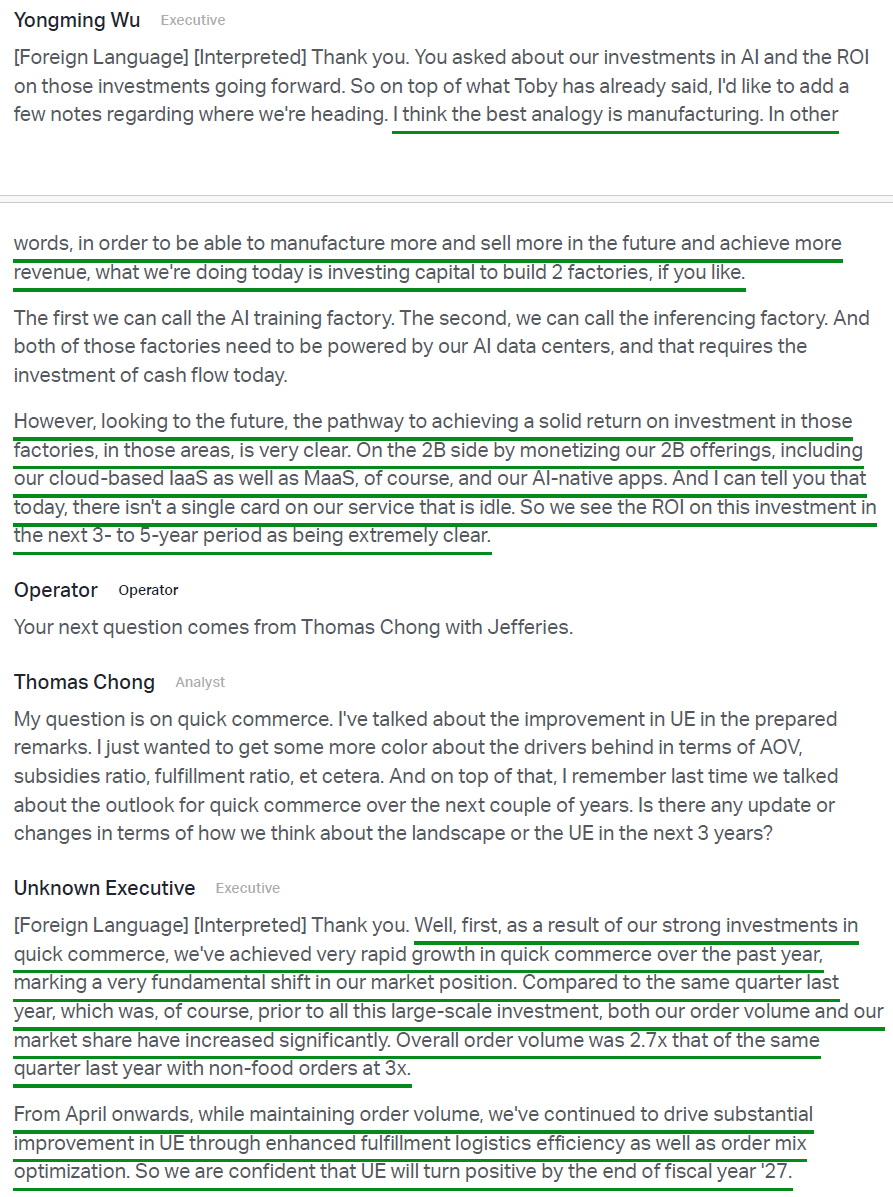
Free cash flow also swung to a $2.5B outflow in the quarter, with the full year coming in at -$6.8B compared to an inflow of $10.7B the prior year. While cash outflows are never something to celebrate, management has been very clear about its priorities: investing aggressively into Cloud/AI to capitalize on what they believe is a generational opportunity. Management now expects to exceed the previously announced ~$56B capex target over the next three years. Most importantly, they are doing so with what they believe is an “extremely clear” line of sight toward attractive returns on investment over the next three to five years.
We’ve received several questions lately surrounding the capital intensity of Alibaba and concerns around a capex-heavy investment cycle, especially given our skepticism toward the U.S. hyperscalers’ asset-heavy AI arms race. We believe there are three key reasons why Alibaba’s investment cycle should be viewed differently.
First, it comes down to how the buildout is being funded. Unlike some of the U.S. hyperscalers that are increasingly tapping debt markets and stretching balance sheets to finance AI ambitions, Alibaba is investing from a position of financial strength. The company sits on a $75.5B pile of cash and investments, with a net cash position of ~$38B, which grows to more than $59B when excluding debt maturities beyond five years. Meaning, Alibaba could theoretically fund the entire buildout from existing cash on hand if management chose to do so. There is no solvency concern here, nor is the balance sheet remotely compromised by the current investment cycle.
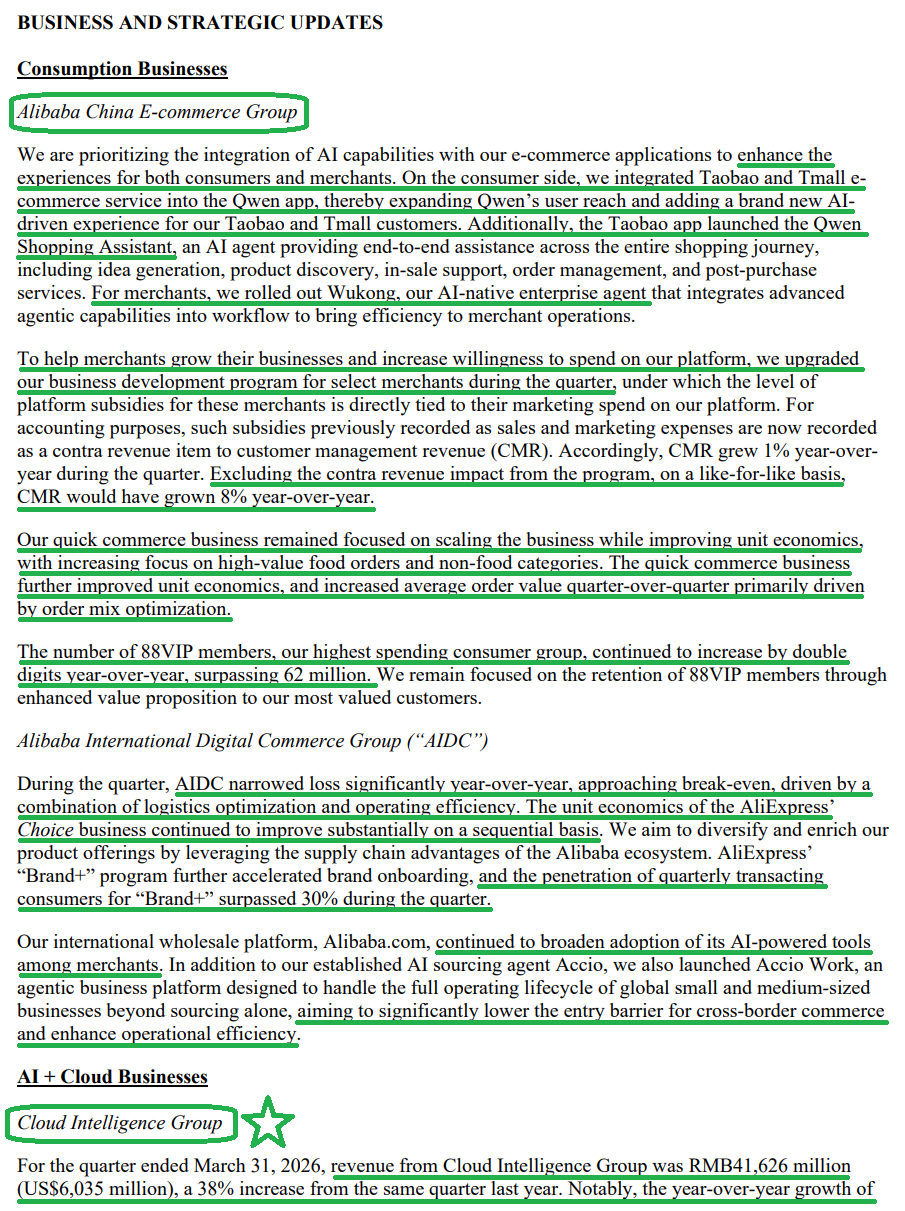
Second, and equally important, Alibaba is not a pure-play AI company dependent on external funding and speculative future monetization. It is backstopped by one of the largest e-commerce ecosystems in the world. The core China e-commerce business holds ~40% market share, delivered 8% like-for-like revenue growth in Q4, and continues to generate enormous amounts of durable, predictable cash flow. That creates a safety net very few AI companies possess, with the core business effectively subsidizing the cloud and AI buildout.
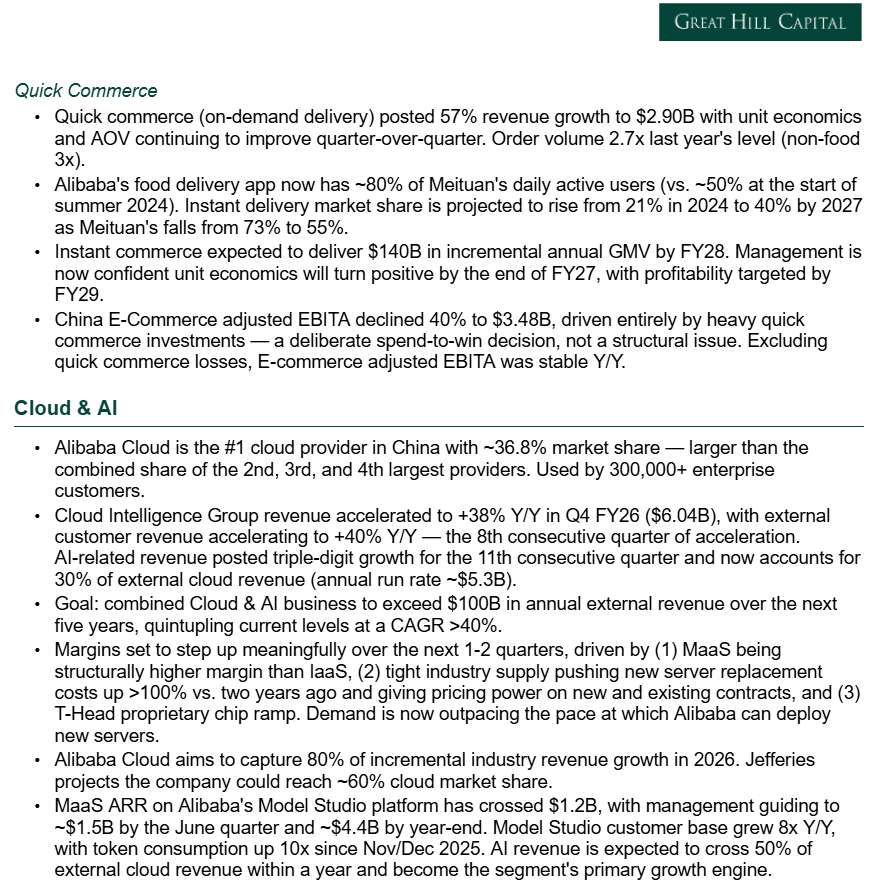
Meanwhile, the company’s international commerce (AIDC) segment is knocking on the door of profitability, while quick commerce losses continue to narrow and remain on track for positive unit economics by the end of FY27. As these businesses mature, Alibaba’s normalized cash flow profile will only become more attractive from here.
Third, and this is something we cannot stress enough: having a better reinvestment opportunity than buying back cheap shares is a GOOD thing, not a BAD thing.
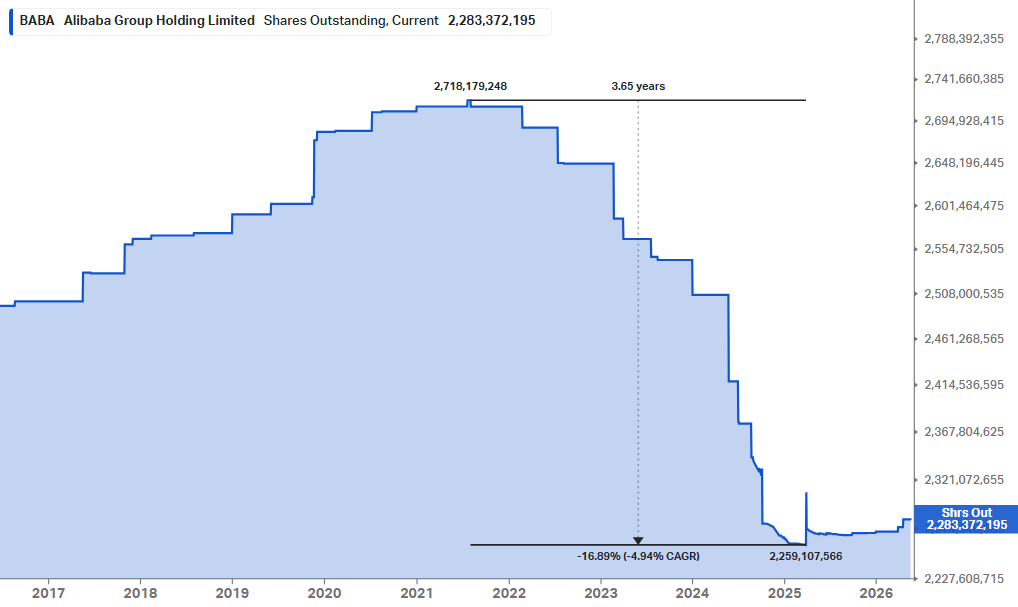
Don’t get us wrong. We love buybacks when stocks are materially undervalued and the price is dislocated. When Alibaba traded in the $60s and China was written off as “uninvestable,” management repurchased stock hand over fist (as did we), retiring ~17% of shares outstanding in just over three years. The stock has since more than DOUBLED, with those buybacks creating tremendous value for shareholders.
Today, however, a dollar deployed into cloud infrastructure, AI models, and proprietary chips likely generates a far higher long-term return than a dollar spent repurchasing shares at more than double the prior price. This is the rare case of a management team that bought low and is now reinvesting high, the exact opposite of the typical value-destructive playbook where buybacks peak near the top and management is hiding under their desks when stocks are actually cheap.
Put all three factors together and not only does Alibaba have the financial capacity to pursue this opportunity, it also possesses what we believe is a structural advantage in doing so.
What matters even more is what’s waiting on the other side of this investment cycle: a direct line of sight toward a leading full-stack Cloud/AI franchise, with management targeting the combined Cloud and AI business to reach $100B in annual revenue over the next five years, implying a CAGR north of 40%.
Importantly, we are already beginning to see real returns from these investments, something very few ‘AI’ companies can genuinely claim today.
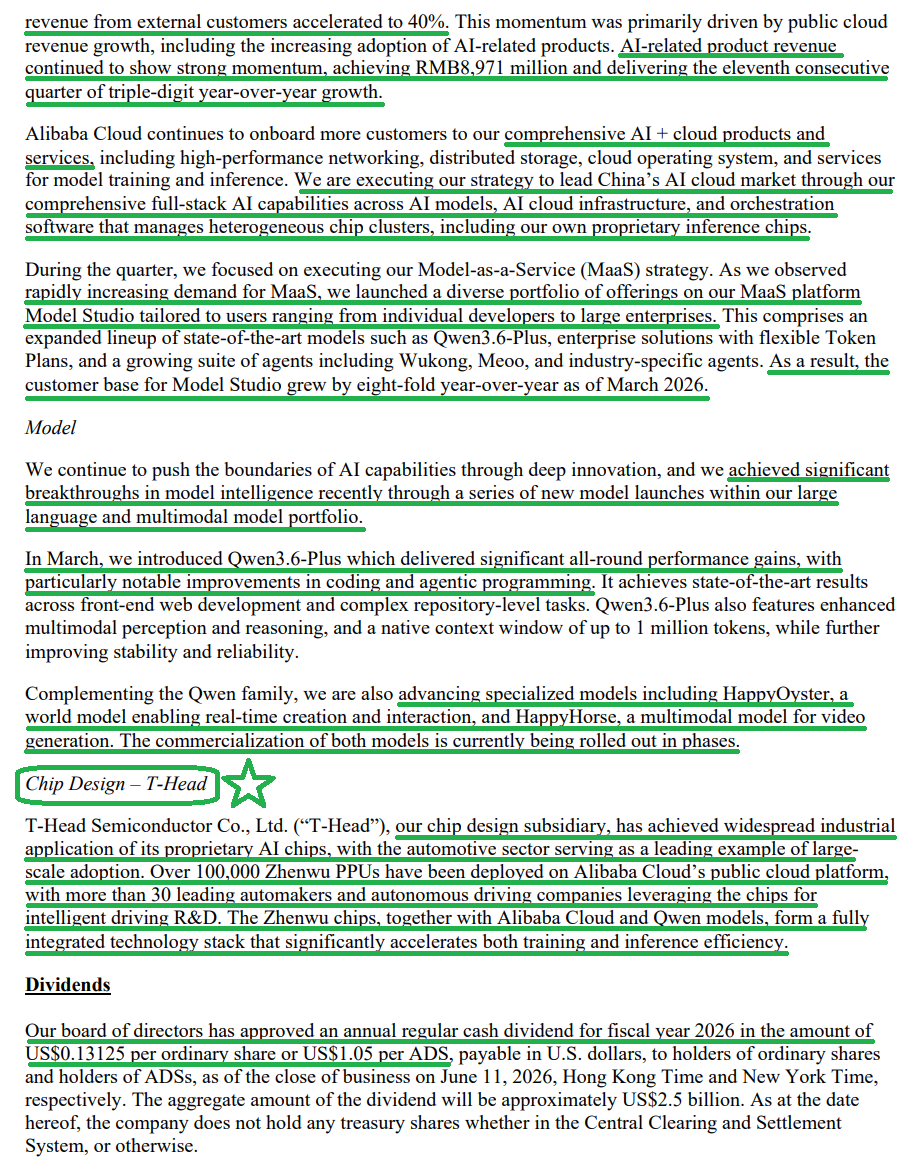
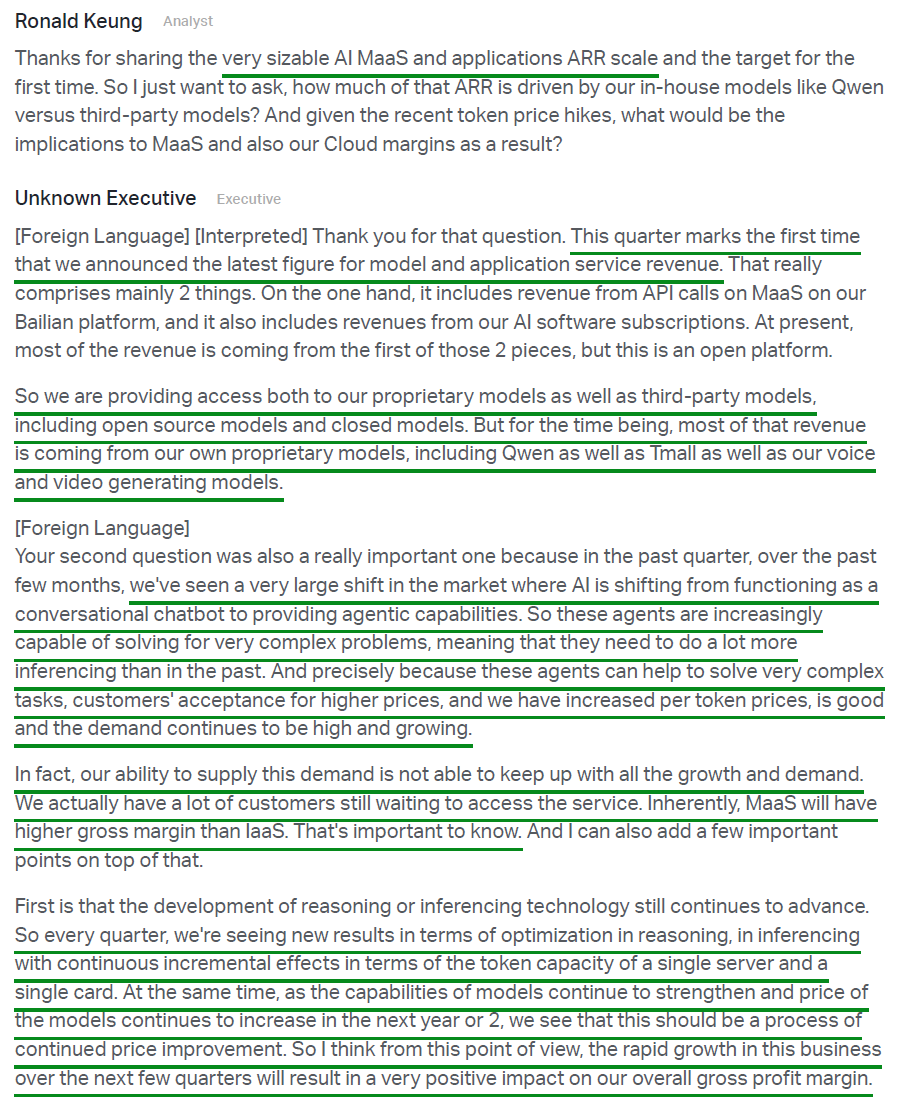
AI-related product revenue reached $1.3B this quarter (~$5.3B annualized), marking the eleventh consecutive quarter of triple-digit growth. Early on, investors could poke holes in the “triple-digit growth” narrative as simply the result of scaling off a small base. That argument no longer holds water, with AI-related revenue now accounting for ~30% of total cloud revenue and on track to exceed 50% within the next year.
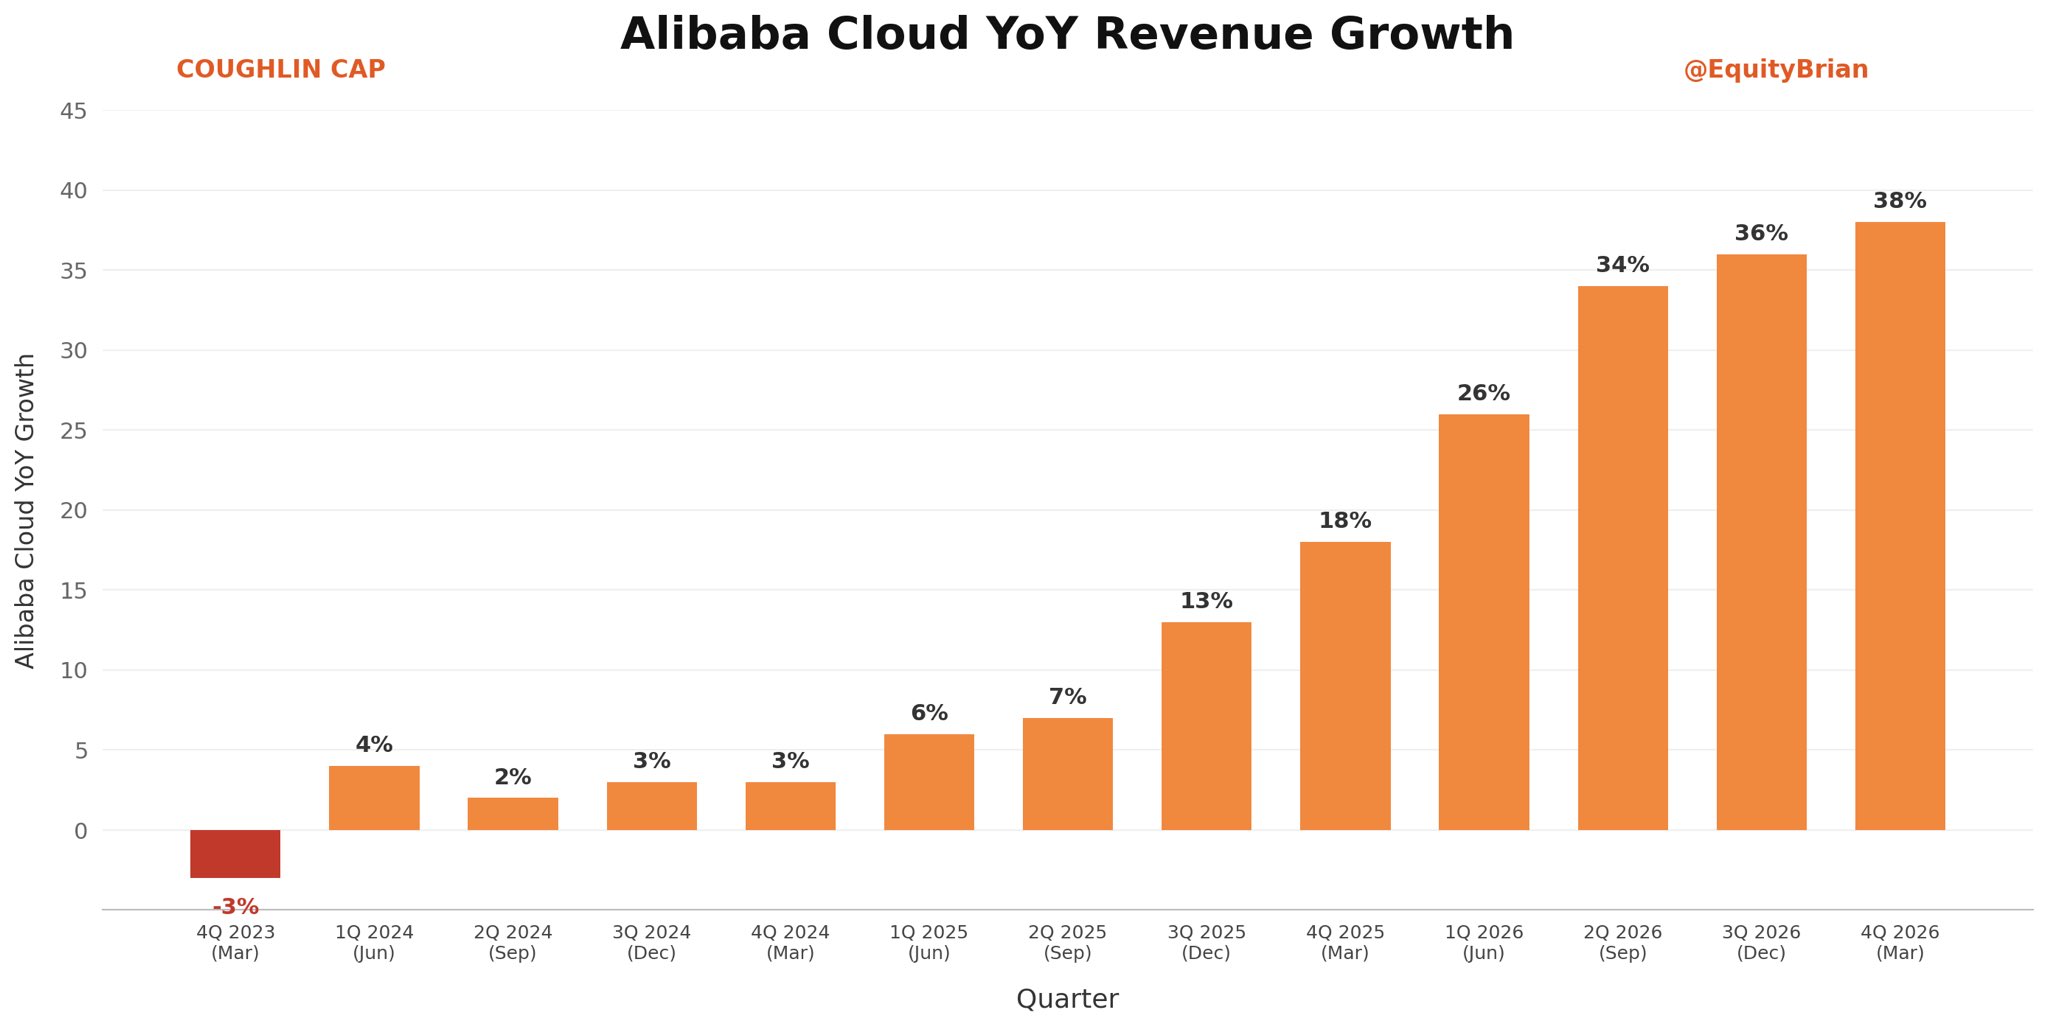
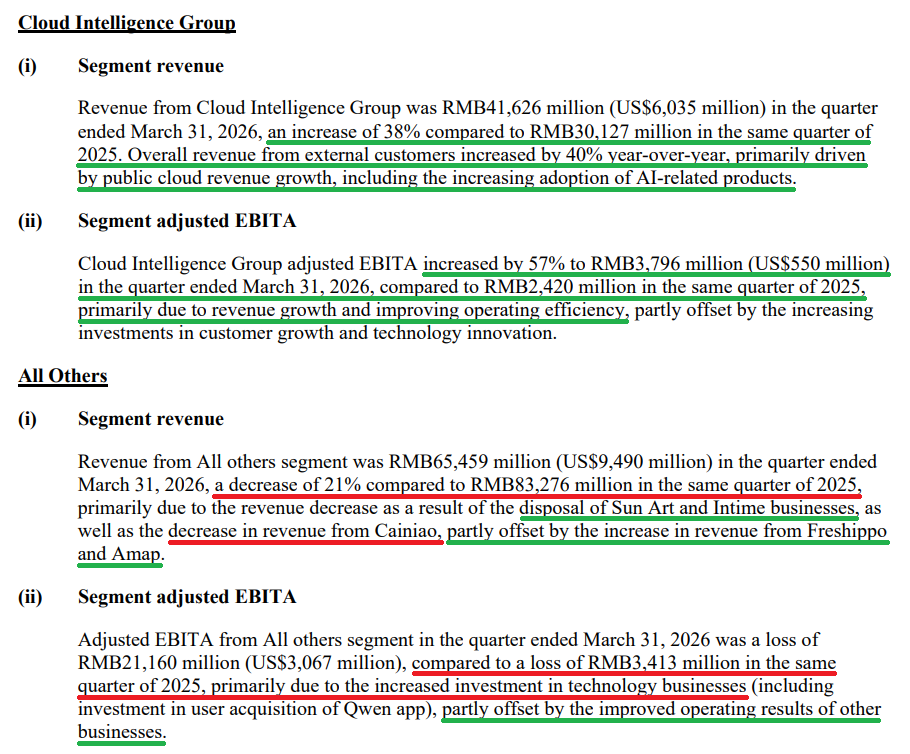
This AI strength, combined with demand across the traditional cloud business that still far outstrips supply, drove external cloud revenue growth to 40%, up from 35% in the prior quarter and marking the eighth consecutive quarter of acceleration.
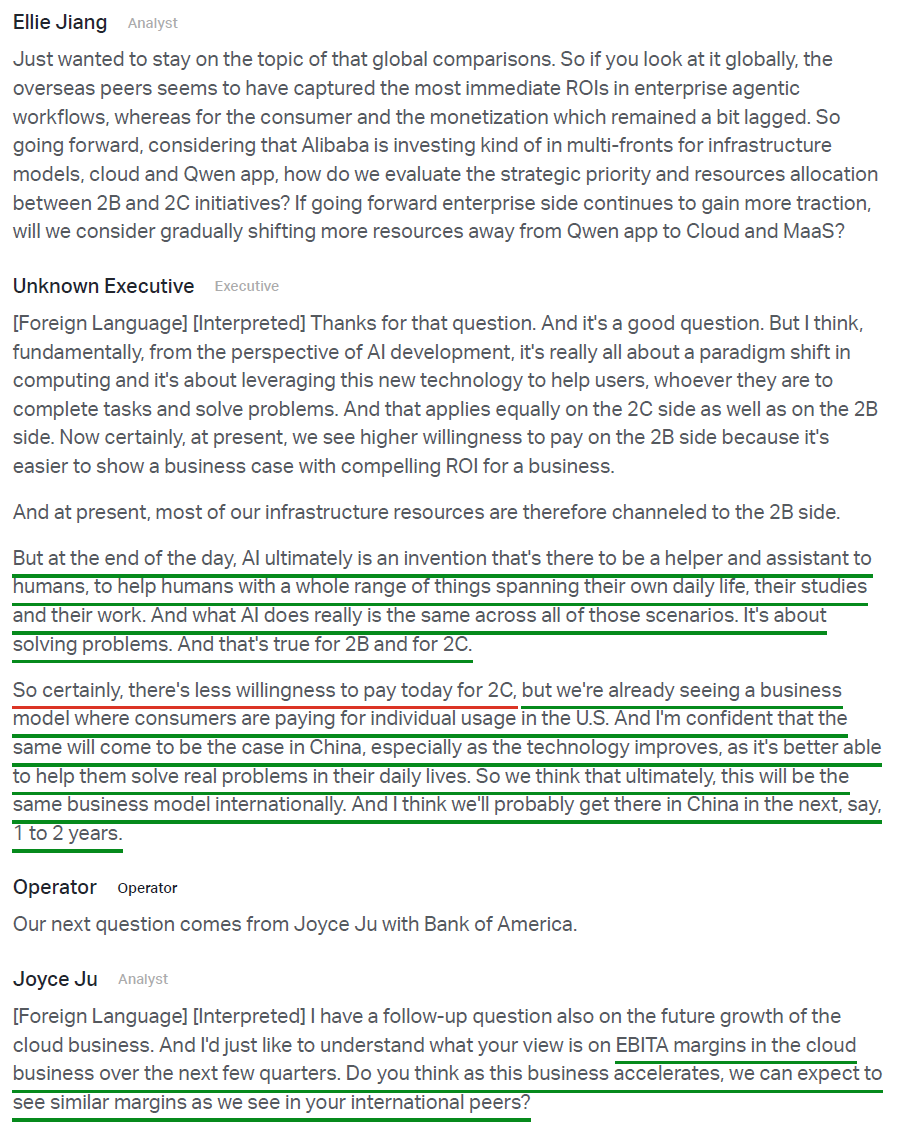
While management was clear that the near-term focus for the Cloud segment remains squarely on growth and market share gains, the conversation eventually shifts toward profitability, where the margin runway remains massive. Alibaba Cloud currently generates segment margins of 9.1%, compared to operating margins of 37.7% at AWS (AMZN) and 32.9% at Google Cloud (GOOGL).
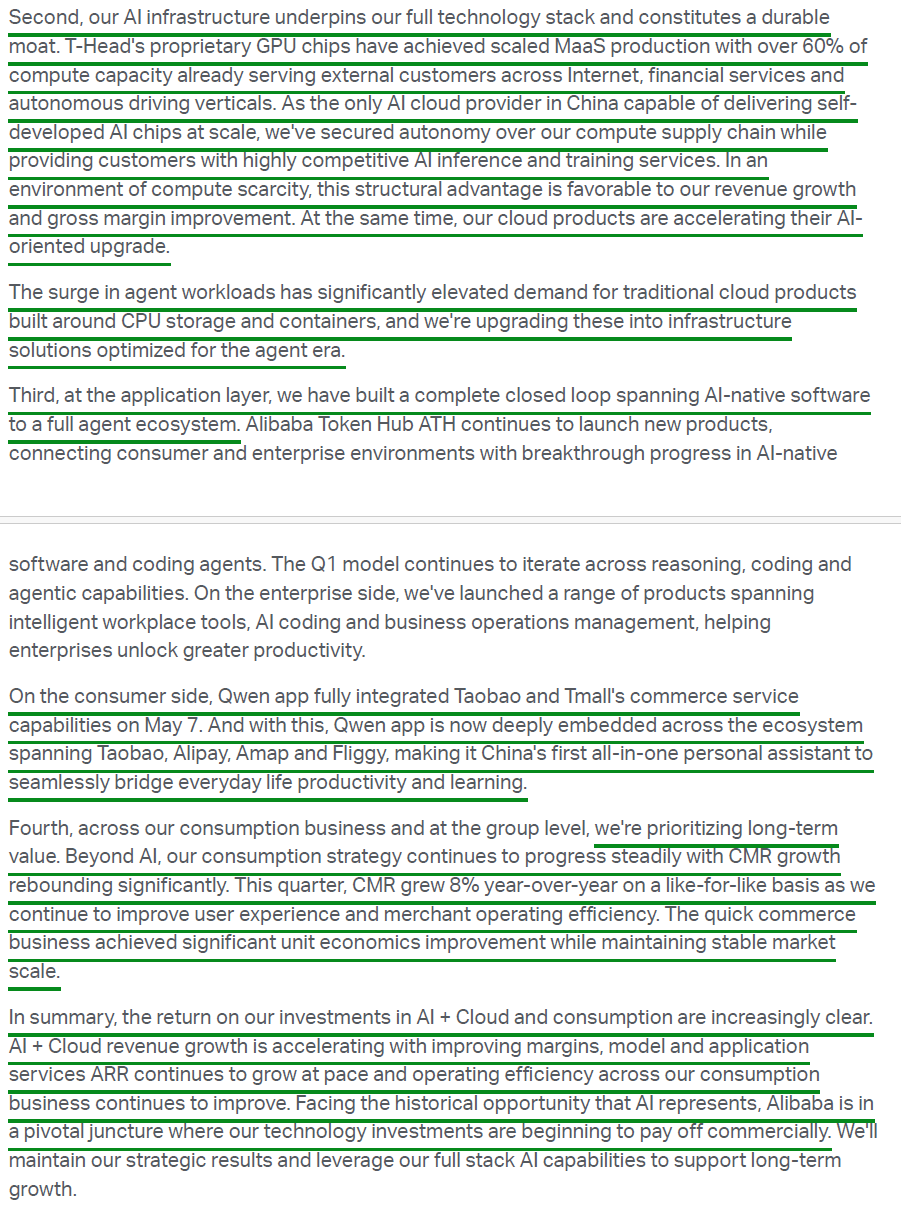
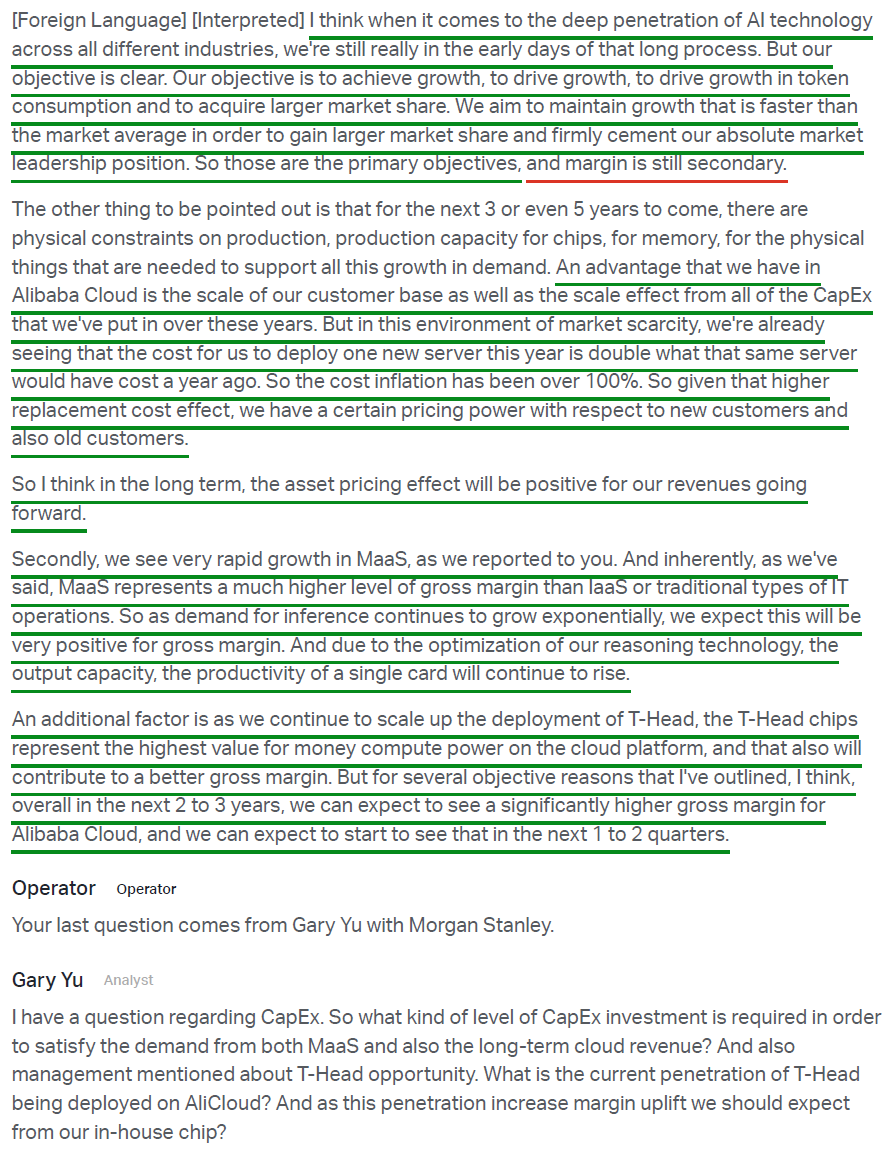
Several structural tailwinds should support materially higher margins going forward, including a mix shift toward higher-margin MaaS offerings, pricing power driven by global compute shortages that have pushed server replacement costs to more than 2x levels from two years ago, and growing adoption of Alibaba’s in-house T-Head chips, which materially lower the overall cost base. Management expects these factors to begin driving meaningful margin expansion over the next one to two quarters, with a very long runway beyond that.
At the same time, T-Head has now scaled into mass production and is increasingly seen as a credible domestic alternative to leading chip providers. In a compute-constrained environment, Alibaba’s in-house silicon provides a major structural advantage for internal operations while also creating a high-margin business serving external customers.
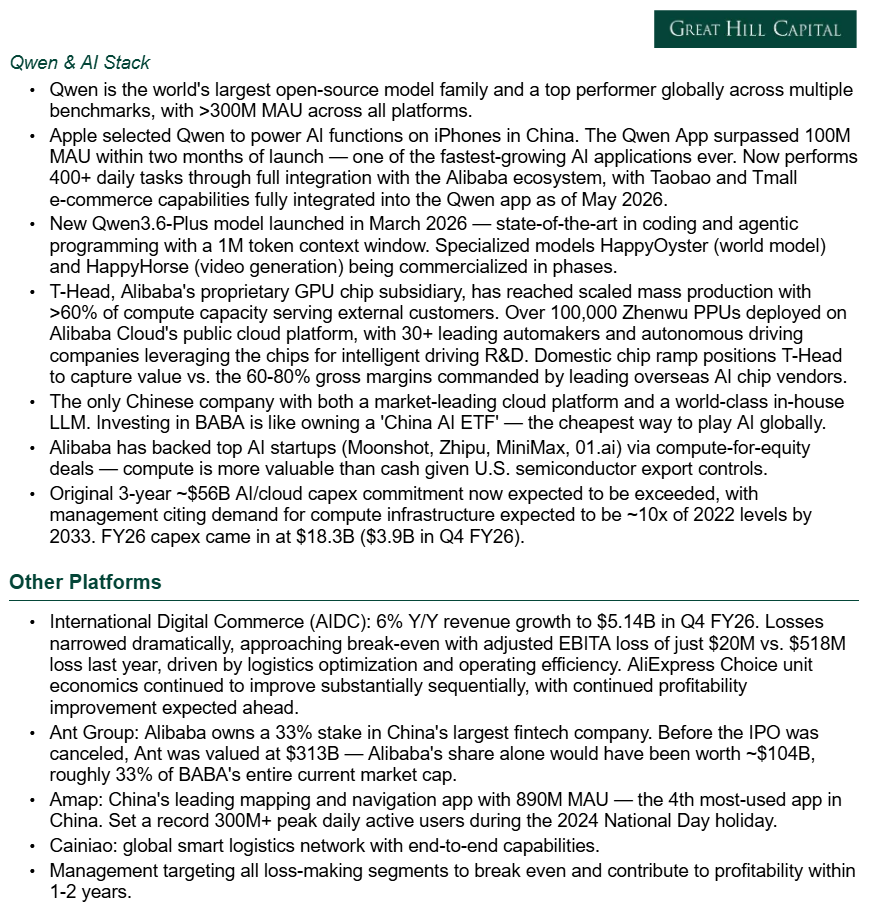
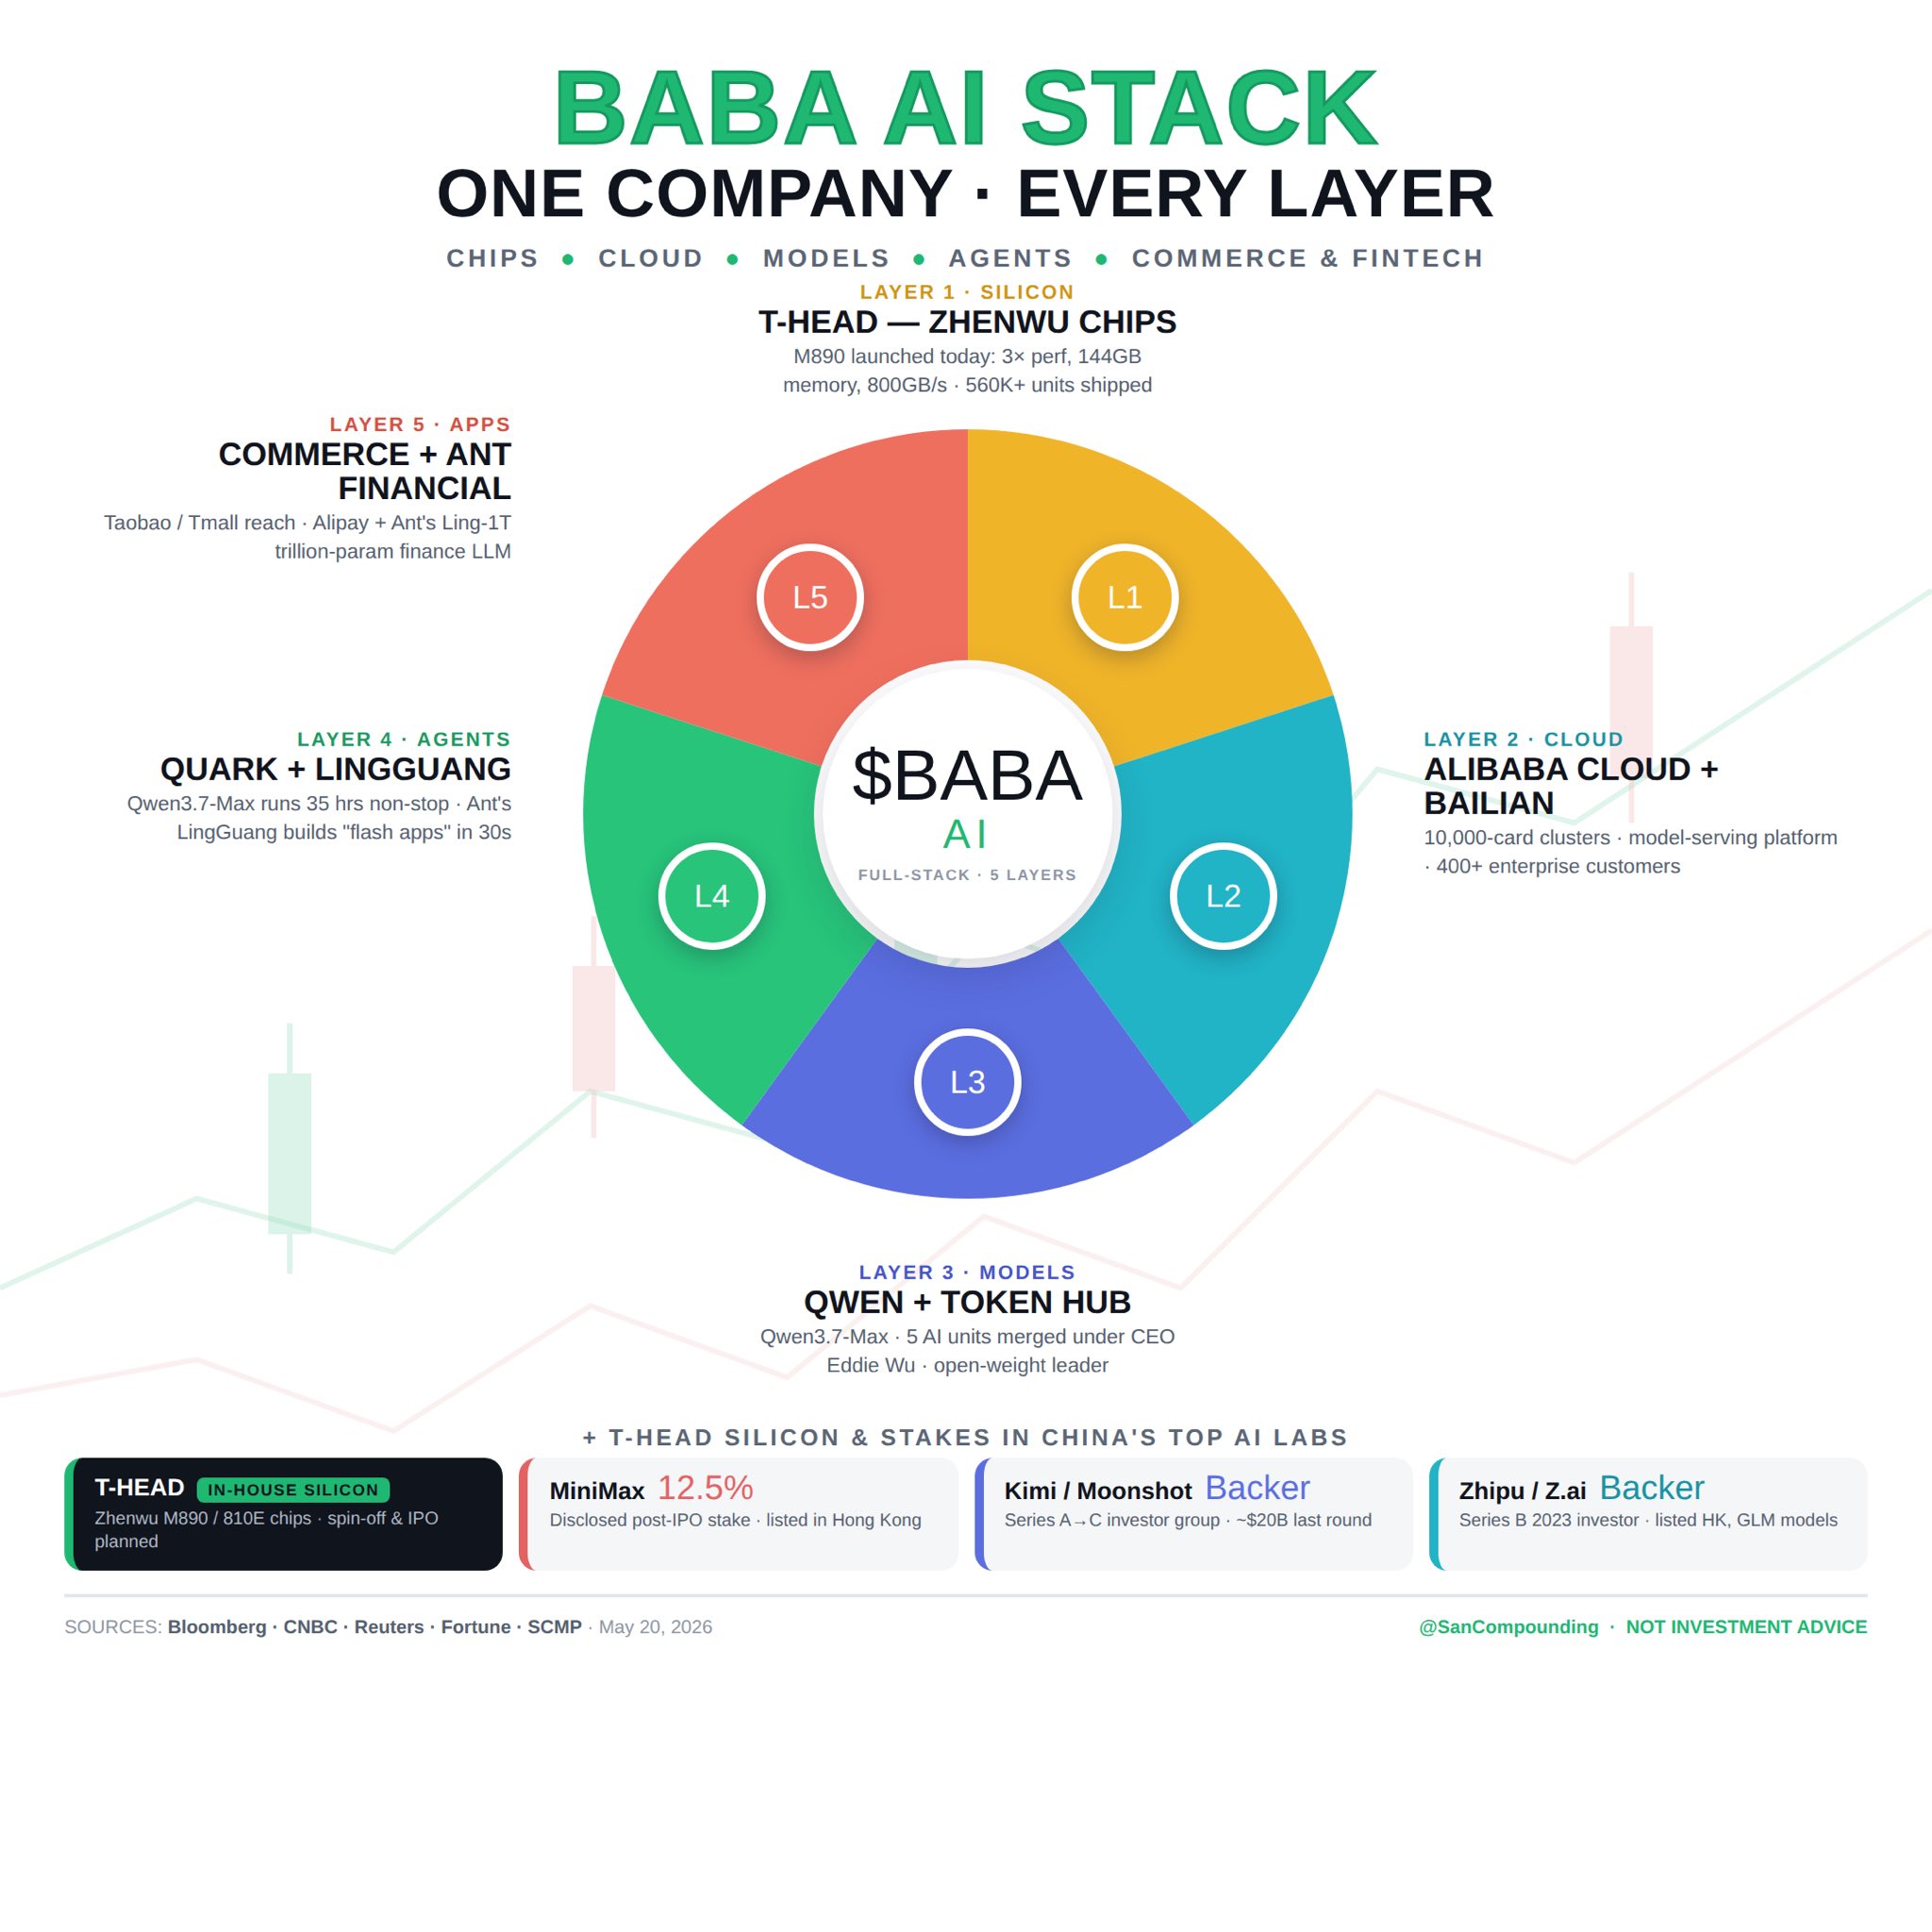
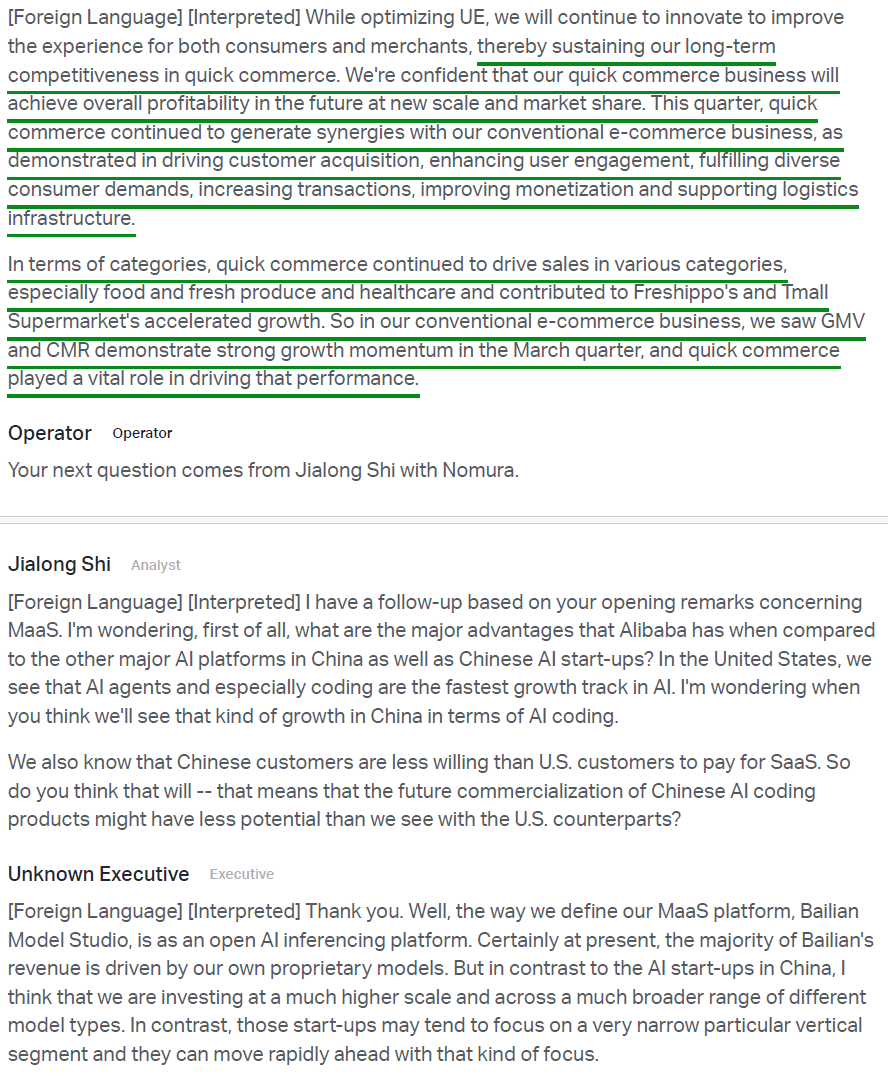
Put it all together, and what emerges is a full-stack AI platform spanning cloud infrastructure (~38% market share), leading open-source AI models (Qwen is the world’s largest open-source model family), and advanced proprietary chips.
Not to mention what may be the market’s most overlooked piece of the story: Alibaba is effectively a China AI ETF hidden inside a single stock.
As China’s leading cloud provider, Alibaba has leveraged compute-for-equity deals across the country’s AI ecosystem, resulting in stakes across some of China’s most promising AI startups like Moonshot, MiniMax, Zhipu, and others that remain undisclosed until the next funding headline appears. These investments sit on the balance sheet with little to no value assigned to them in the stock price. Every time another multi-million or billion-dollar stake surfaces, the market is reminded just how massive this hidden optionality really is.
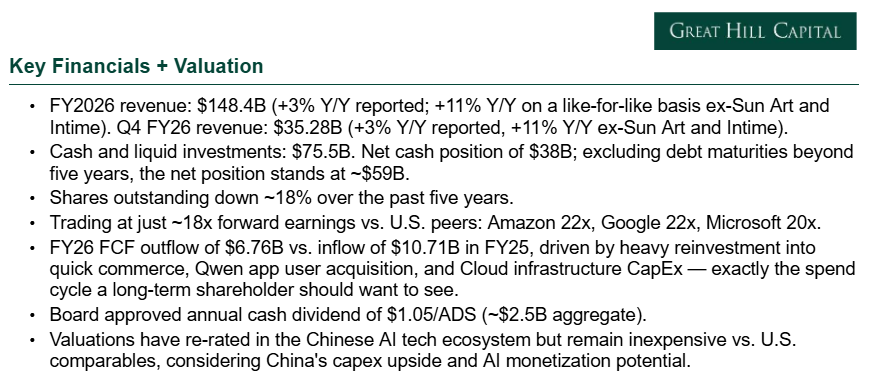
At less than 15x forward earnings, investors are getting the cheapest large-scale AI platform globally, the #1 cloud provider in China, a rapidly scaling chip business, the #1 Chinese e-commerce platform, an international commerce business just reaching profitability, and countless other businesses and equity stakes that the market continues to largely ignore.
That’s exactly the type of company we want to own in size, which is why we were smiling so wide we could eat a banana sideways when we were able to put new money to work as the stock pulled back into the low $120s.
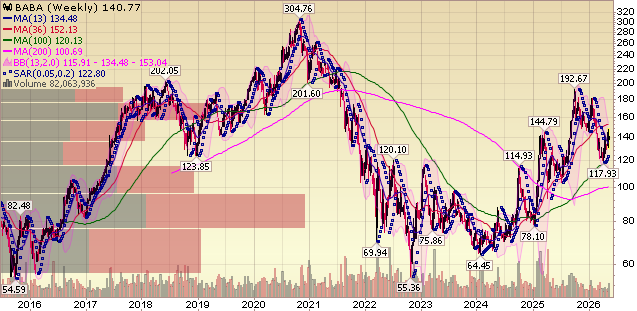
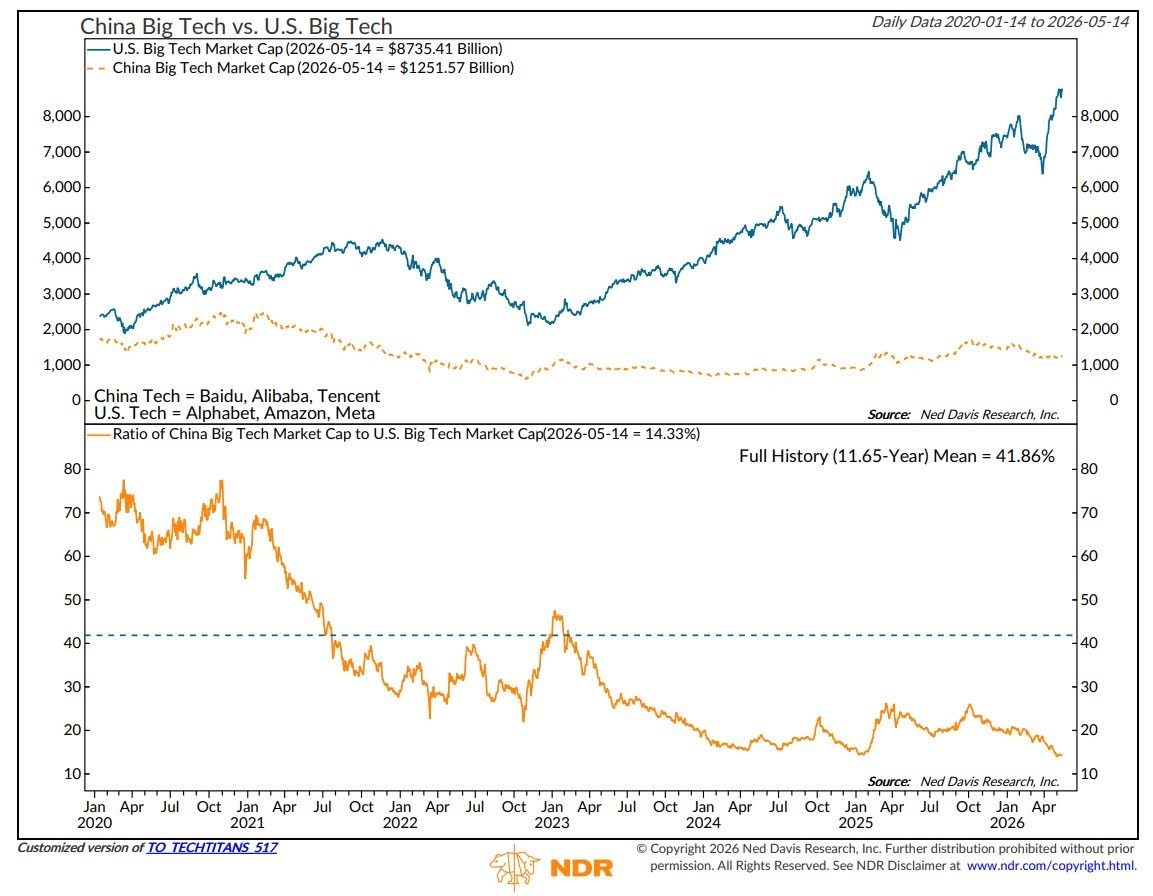
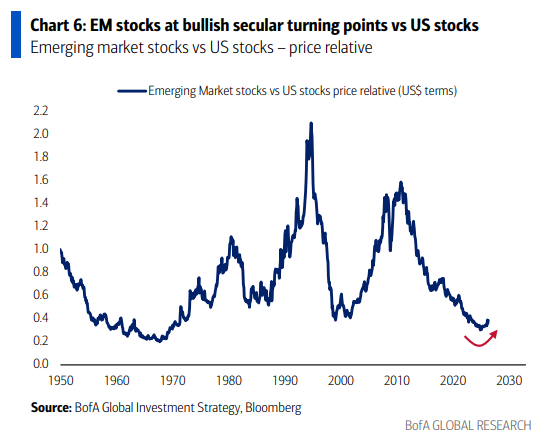
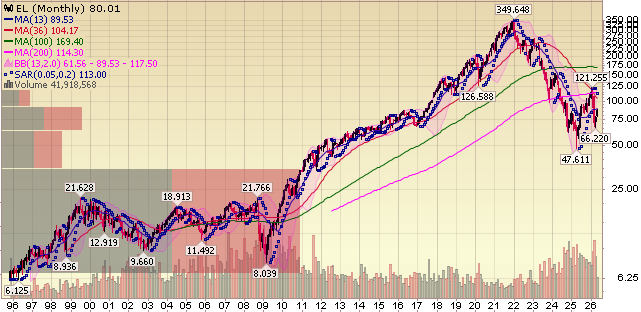
So while most of the market remains fixated on U.S. hyperscalers and the semiconductor trade, we think investors continue to overlook one of the most attractive ways to gain exposure to the theme globally. Looking at the charts below, despite the stock having already more than doubled from the lows where we were buying until our fingers bled, we still believe this story remains in the very early innings.
Q4 Earnings Breakdown
10 Key Points
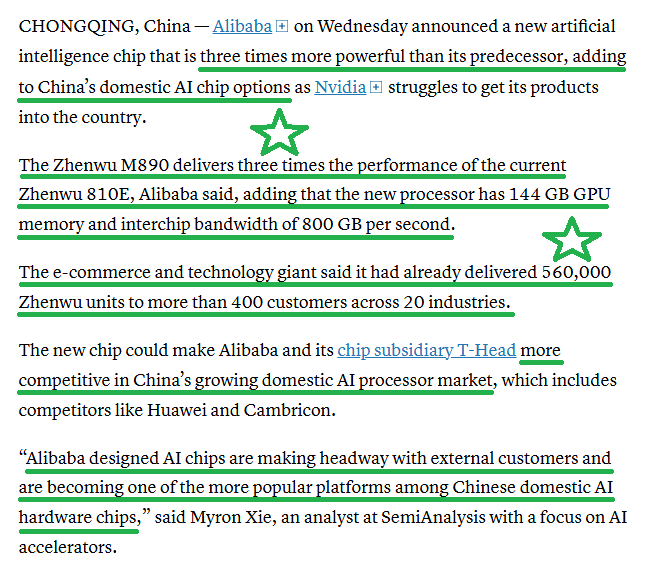
1) Revenue came in at $35.28B (+3% Y/Y reported, +11% ex-disposed businesses Sun Art and Intime on a like-for-like basis), missing consensus by ~$455M, while the +11% underlying growth marked an acceleration from the +9% rate last quarter.
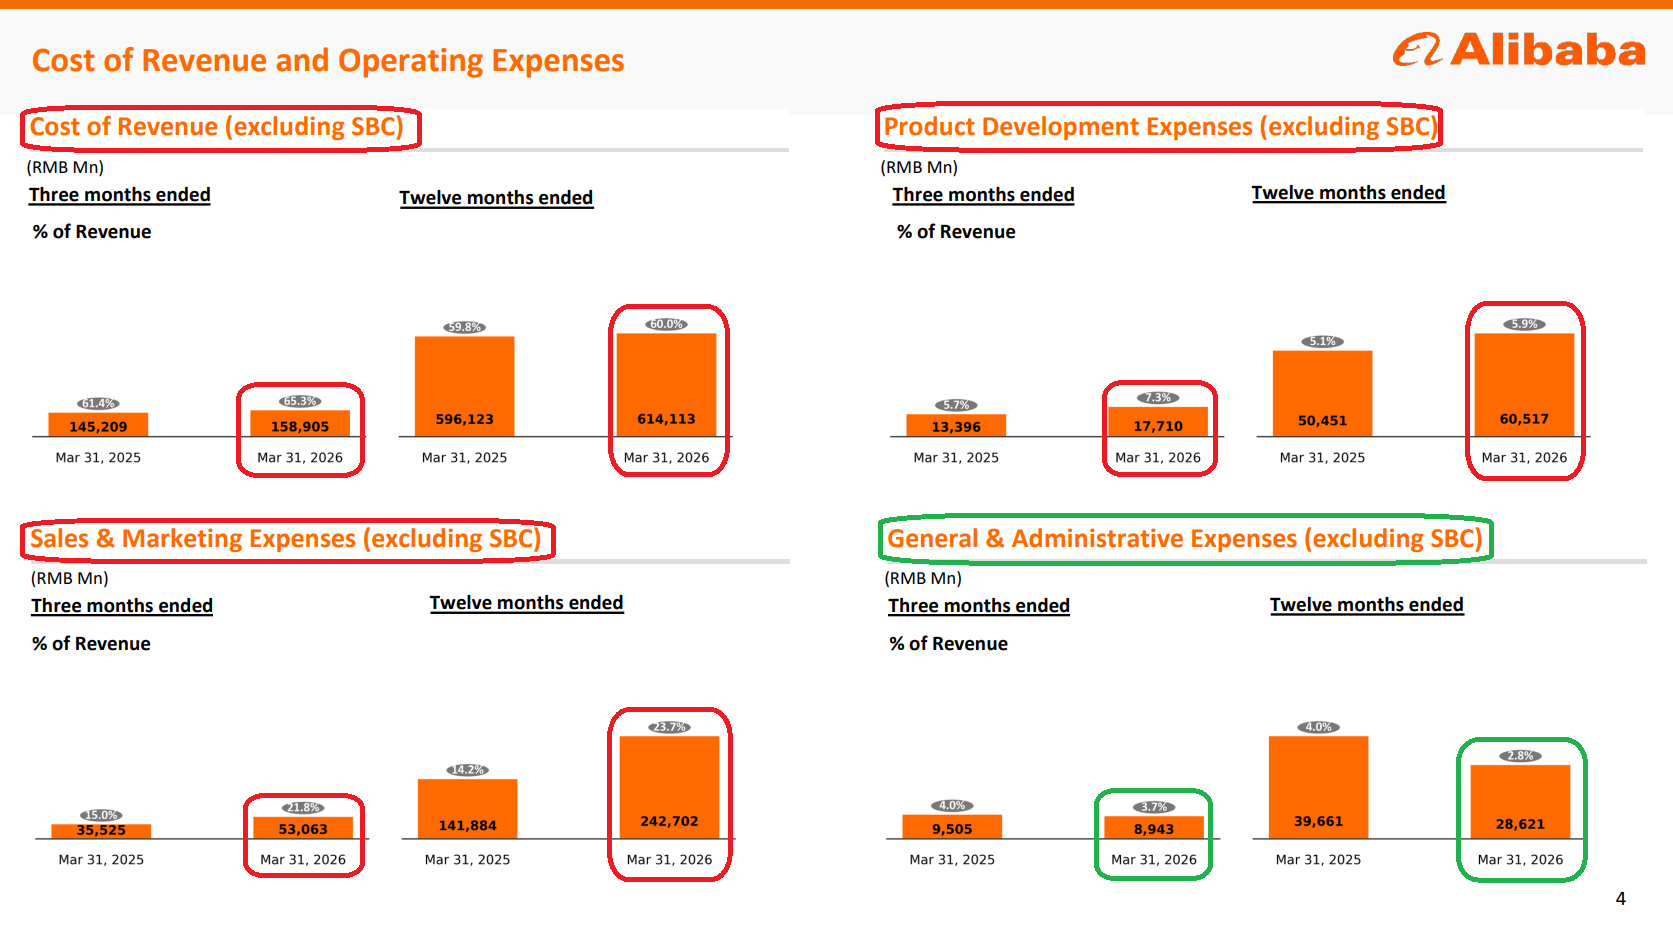
2) Adjusted EBITA fell 84% Y/Y to $740M, with margins compressing to ~2% from ~14% in the prior year period, driven by a step-up in strategic investment in quick commerce and Qwen app user acquisition, which pushed sales and marketing expense to 21.8% of revenue from 15.0%. G&A moved the other way, falling to 3.7% of revenue from 4.0% on continued cost discipline. Management expects adjusted EBITA to remain volatile in the near term as the investment cycle runs its course, with margins secondary to growth and market share gains for now.
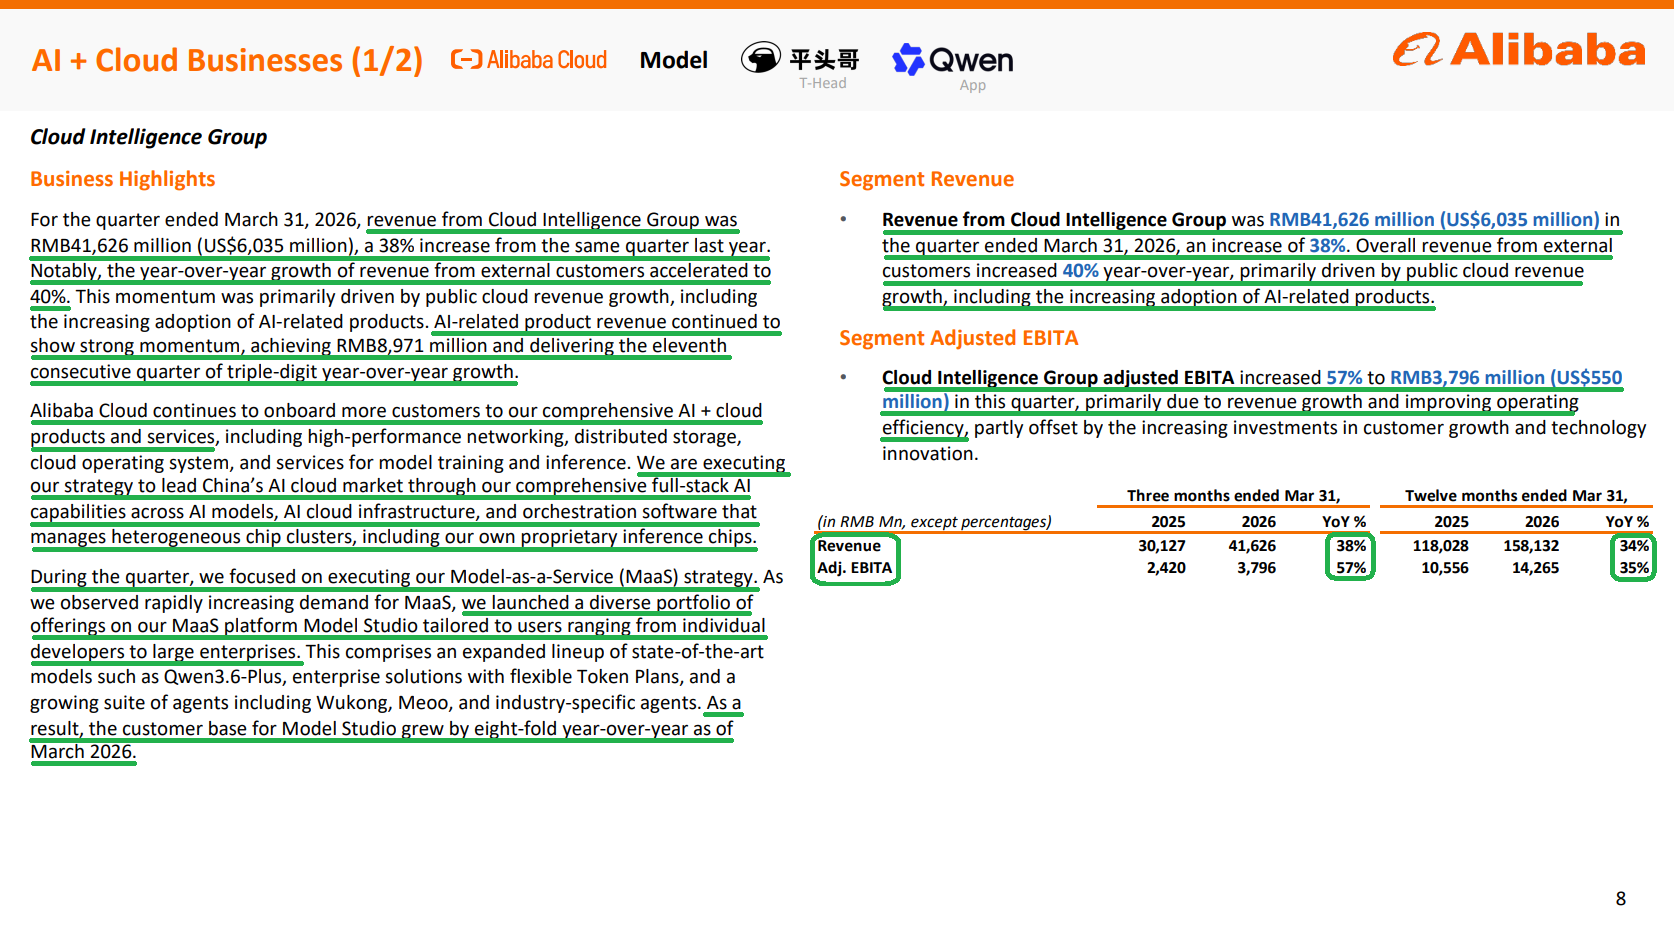
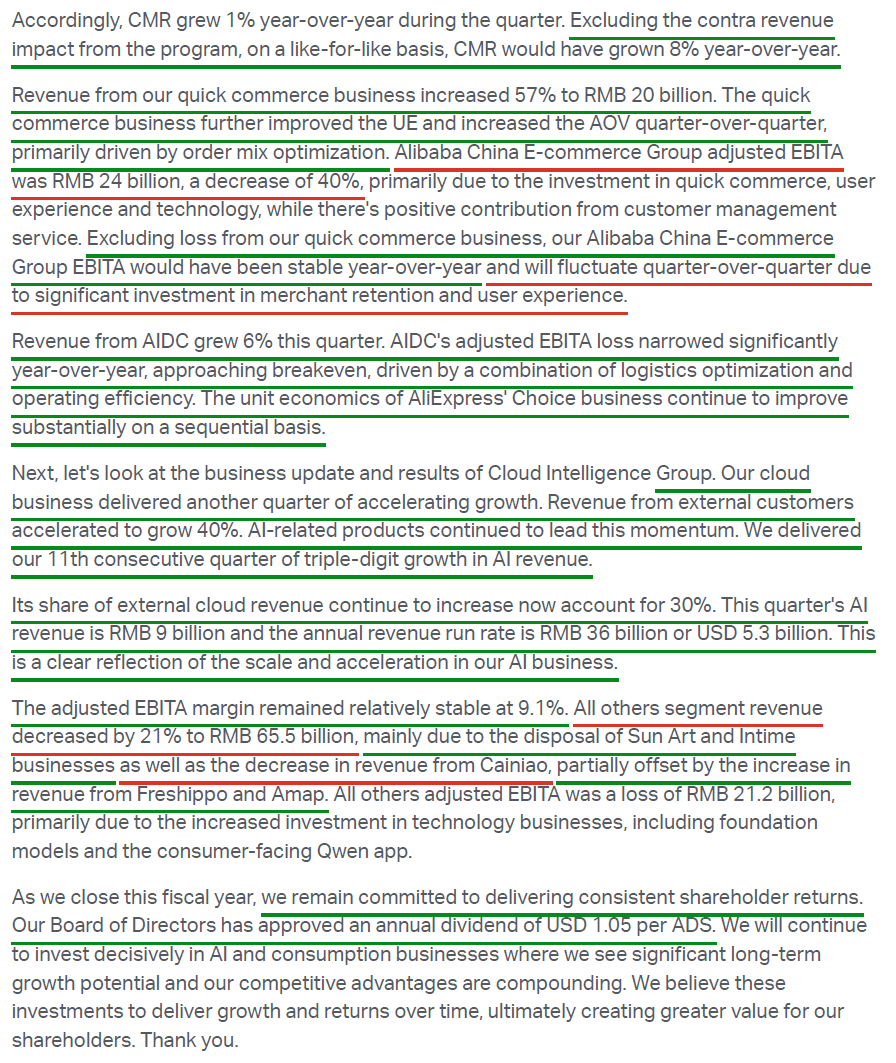
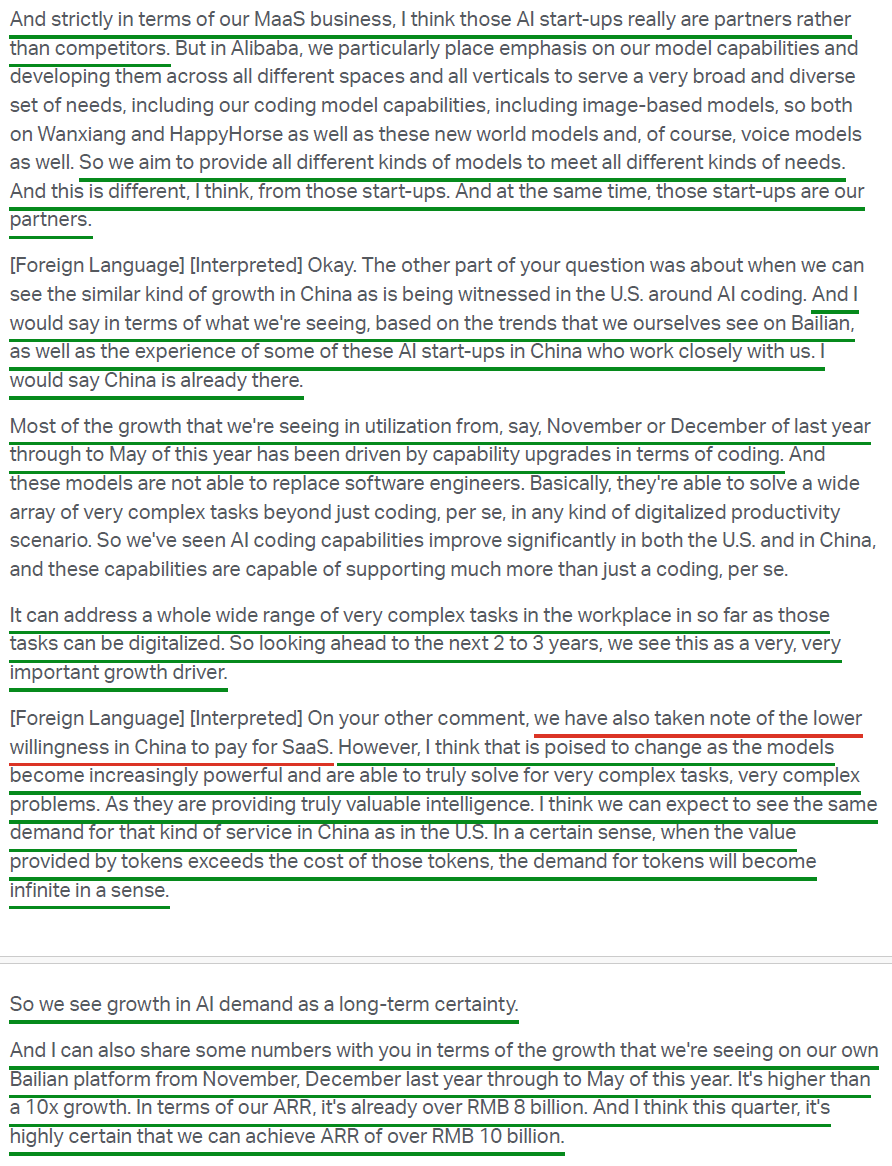
3) Cloud revenue grew 38% Y/Y to $6.04B, with external customer revenue accelerating to +40% from +35% last quarter, marking the eighth consecutive quarter of acceleration. Segment adjusted EBITA rose 57% Y/Y to $550M, with margins steady at 9.1%. Management guided to meaningful gross margin improvement over the next one to two quarters, driven by a mix shift toward structurally higher-margin MaaS, pricing power from new server replacement costs running >100% above two-year-ago levels, and the T-Head proprietary chip ramp. External growth is expected to continue accelerating beyond the current 40% rate, with the long-term target of $100B+ in annual external Cloud and AI revenue within five years unchanged.
4) AI-related product revenue reached $1.30B, marking its eleventh consecutive quarter of triple-digit growth and now accounting for 30% of Cloud external revenue, up from >20% last quarter. Management expects AI revenue to exceed 50% of external Cloud revenue within a year and become the segment’s primary growth engine going forward. MaaS ARR on the Model Studio platform has crossed $1.2B, with management guiding to ~$1.5B by the June quarter and ~$4.4B by year-end, equivalent to close to $100M per month in token and agentic AI revenue. Model Studio’s customer base has grown eight-fold Y/Y, with token consumption up more than 10x since November. On the consumer side, the Qwen app was fully integrated with Taobao and Tmall on May 7, with the Taobao app launching the Qwen Shopping Assistant.
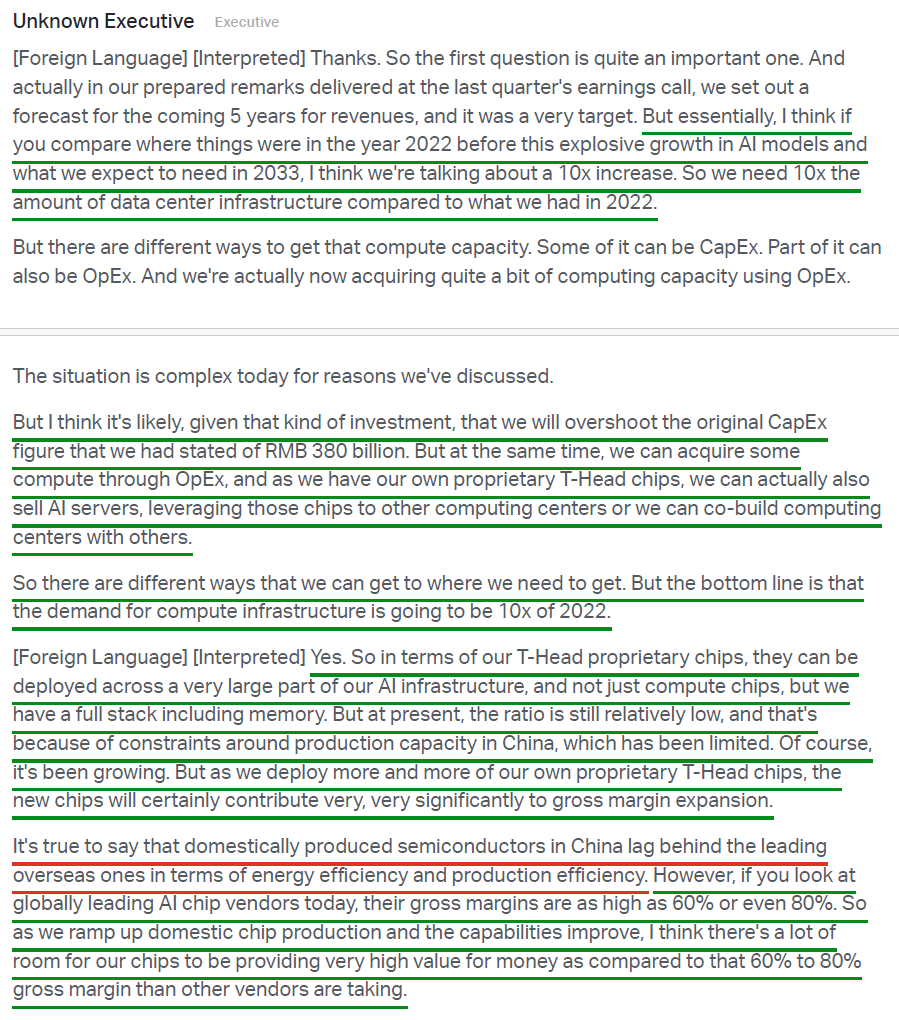
5) T-Head, Alibaba’s proprietary chip subsidiary, has reached scaled mass production, with more than 60% of compute capacity now serving external customers across internet, financial services, and autonomous driving verticals. Over 100,000 Zhenwu PPUs have been deployed on Alibaba Cloud’s public cloud platform, with 30+ leading automakers and autonomous driving companies using the chips for intelligent driving R&D. As the only AI cloud provider in China delivering self-developed chips at scale, T-Head gives Alibaba a structural advantage in a compute-scarce environment and positions it to capture share against the 60–80% gross margins that leading overseas AI chip vendors currently command.
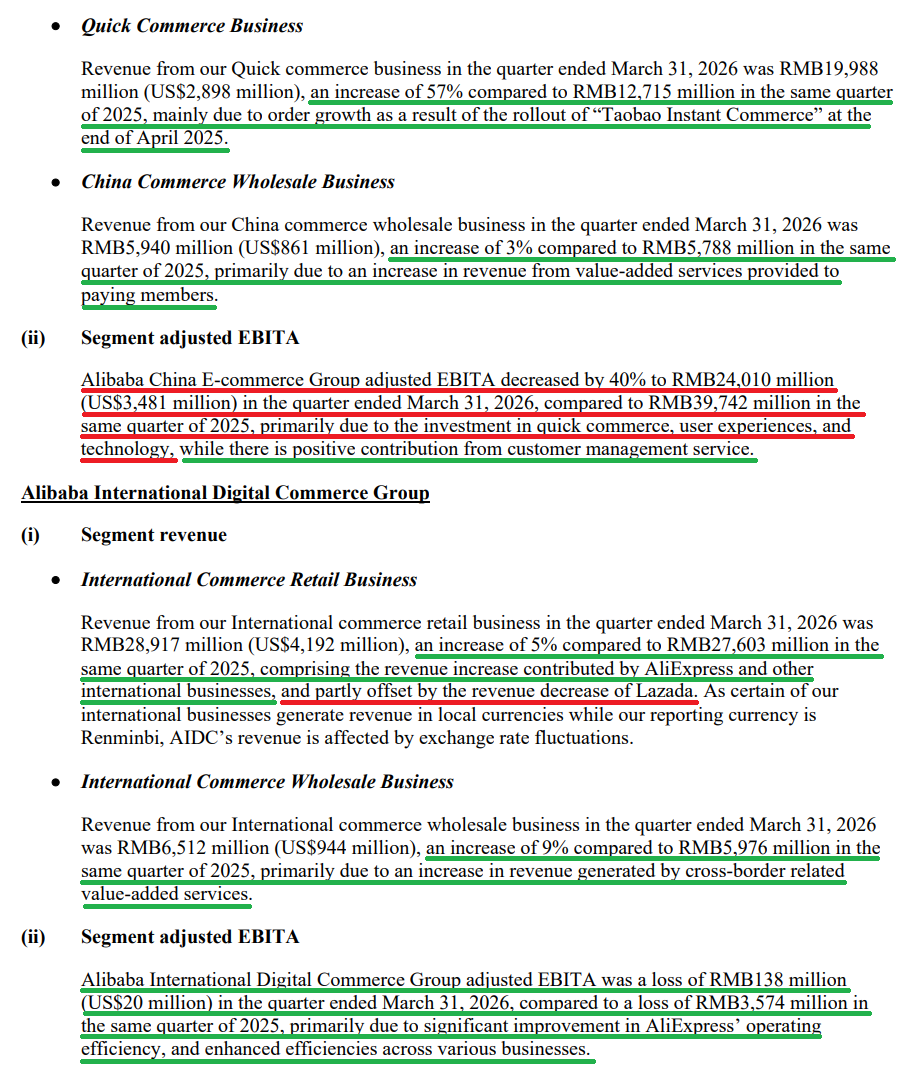
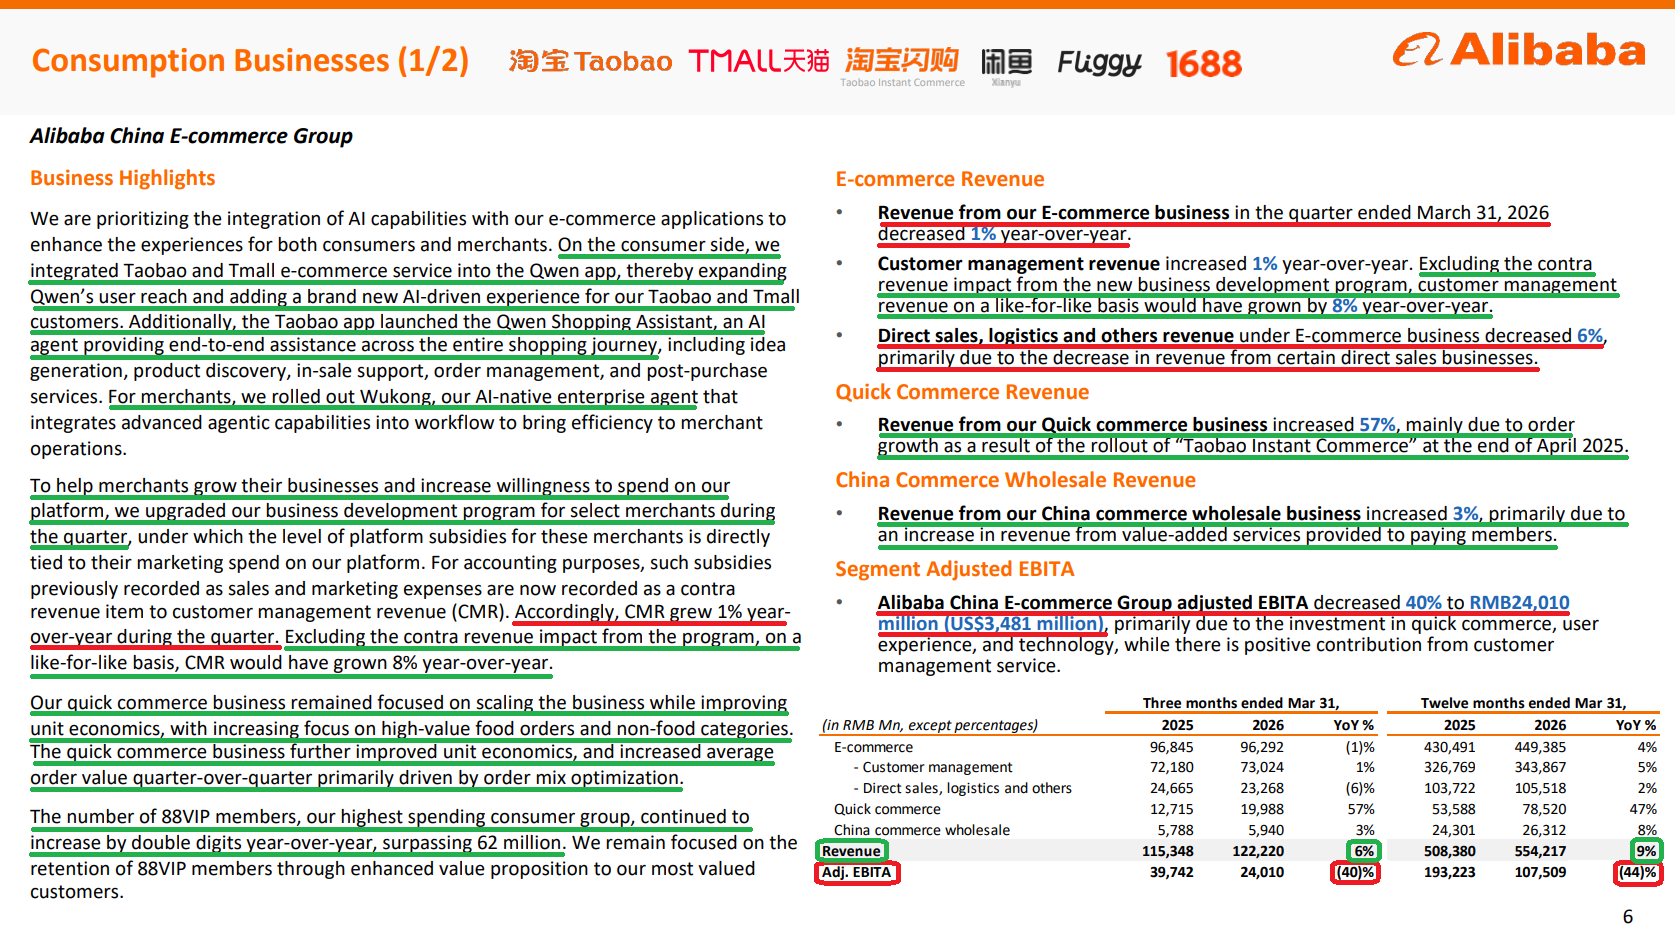
6) Quick commerce revenue grew 57% Y/Y to $2.90B, with unit economics and average order value improving significantly quarter-over-quarter, driven by a better mix toward higher-value categories. Overall order volume ran at 2.7x last year’s level, with non-food orders at 3x, while the business maintained market share through the quarter. Management remains confident that unit economics will turn positive by the end of FY27. Quick commerce also continued to drive synergies with traditional e-commerce, supporting customer acquisition, engagement, and transaction frequency, while contributing incremental volume to Freshippo and Tmall Supermarket.
7) China e-commerce revenue came in at $17.72B (+6% Y/Y), with CMR growing +1% Y/Y as reported but +8% on a like-for-like basis, excluding the contra revenue impact from the new merchant business development program. The +8% underlying growth marks a strong acceleration from the +1% like-for-like rate last quarter. Direct sales, logistics, and other revenue declined 6% Y/Y on lower revenue from certain direct sales businesses. Segment adjusted EBITA was $3.48B (-40% Y/Y) due to continued quick commerce investment; excluding quick commerce losses, e-commerce EBITA was stable Y/Y. 88VIP members, Alibaba’s highest-spending cohort and closest equivalent to Amazon Prime, grew double digits Y/Y to >62 million.
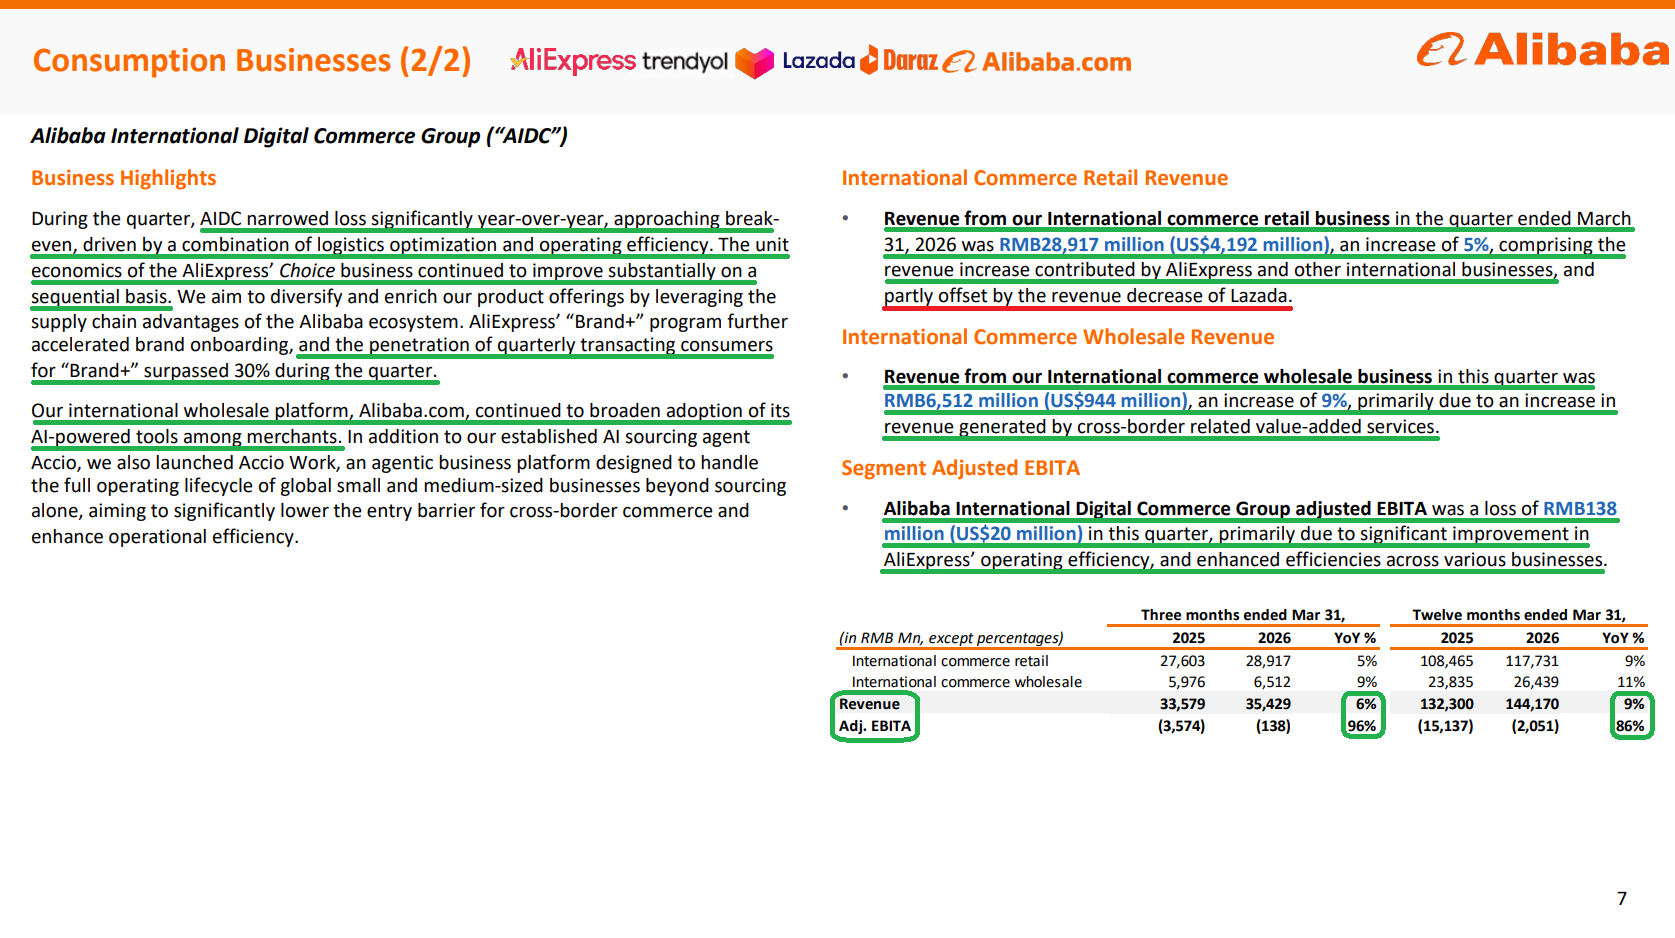
8) Alibaba International (AIDC) revenue grew 6% Y/Y to $5.14B, with international retail up 5% to $4.19B and wholesale up 9% to $944M. Adjusted EBITA loss narrowed to $20M from a $518M loss a year ago, approaching break-even, driven by logistics optimization, operating efficiency gains, and substantially improved unit economics in the AliExpress Choice business.
9) Capex was $3.9B in the quarter and $18.3B for the full year, funding the Cloud and AI buildout. Management now expects to exceed its prior ~$56B three-year AI investment commitment, citing compute infrastructure demand it sees reaching ~10x 2022 levels by 2033. Management characterized the spend as demand-driven rather than speculative, noting there is not a single idle unit of capacity in its system, and described its line of sight to ROI over the next three to five years as extremely clear.
10) Free cash flow was an outflow of $2.51B in the quarter, versus an inflow of $543M last year, bringing full-year FY26 FCF to an outflow of $6.76B compared with an inflow of $10.71B in FY25. The decline was driven by heavy reinvestment into quick commerce, Qwen app user acquisition, and Cloud infrastructure capex. Cash and liquid investments totaled $75.50B, resulting in a net cash position of ~$38B, or ~$59B excluding debt maturities beyond five years. Management expects the cash flow profile to improve as quick commerce losses narrow and AIDC moves toward profitability, while Taobao and Tmall continue to generate stable underlying operating cash flow.
Earnings Call Highlights
Morningstar Analyst Note
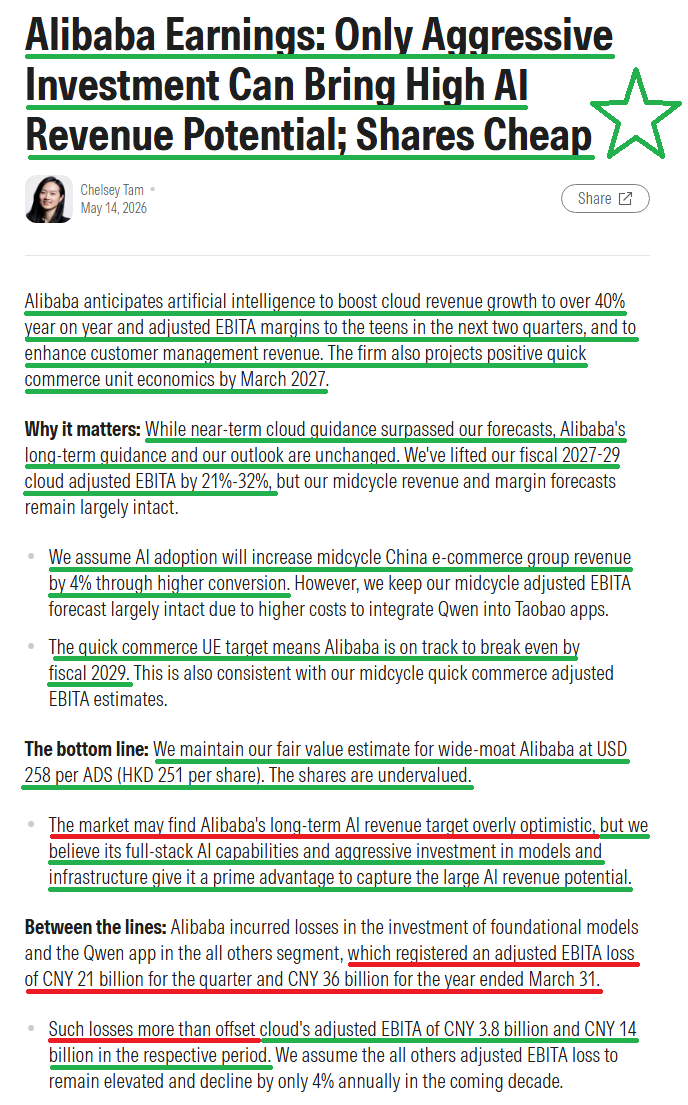
Estée Lauder (EL) Update
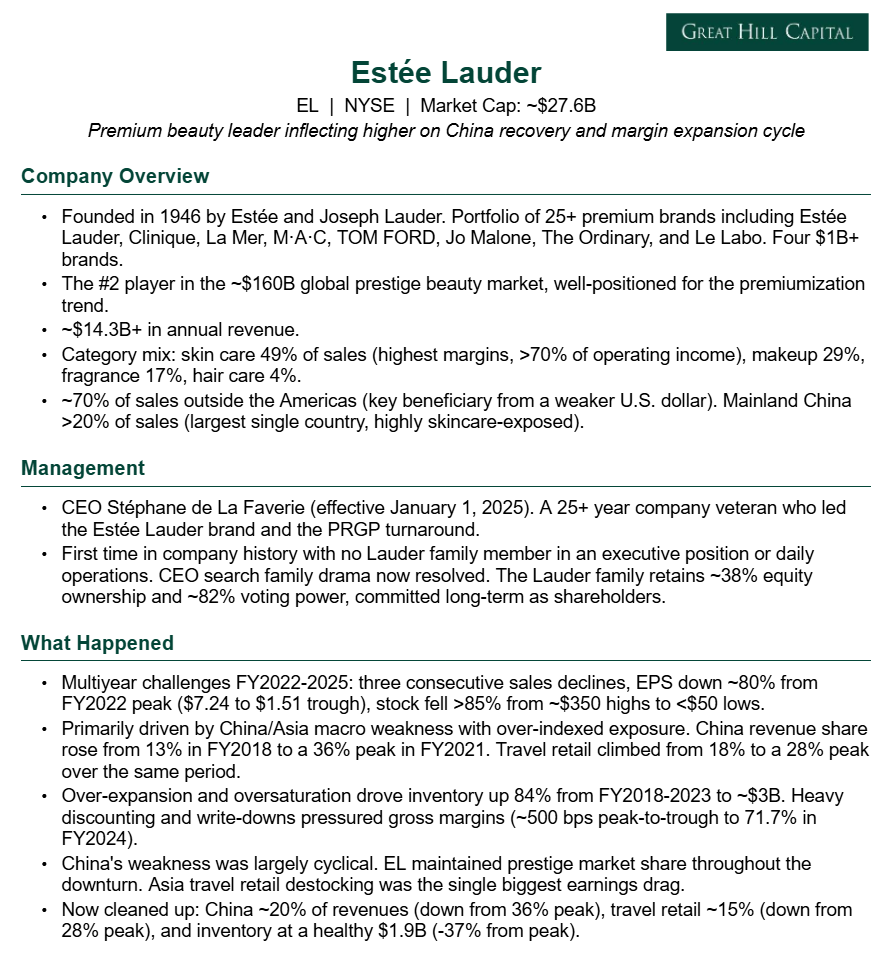
For newer readers, here’s a quick overview of the key drivers behind our thesis on Estée Lauder, a leader in global prestige beauty that is now inflecting back to growth following a cyclical slowdown, with meaningful operating leverage still to come:
Q3 Earnings Breakdown
10 Key Points
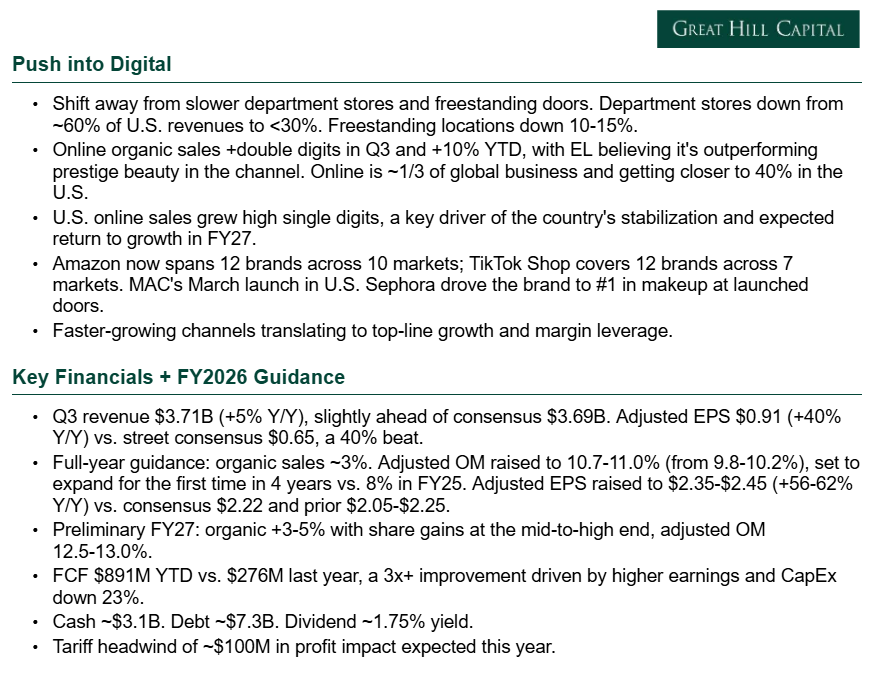
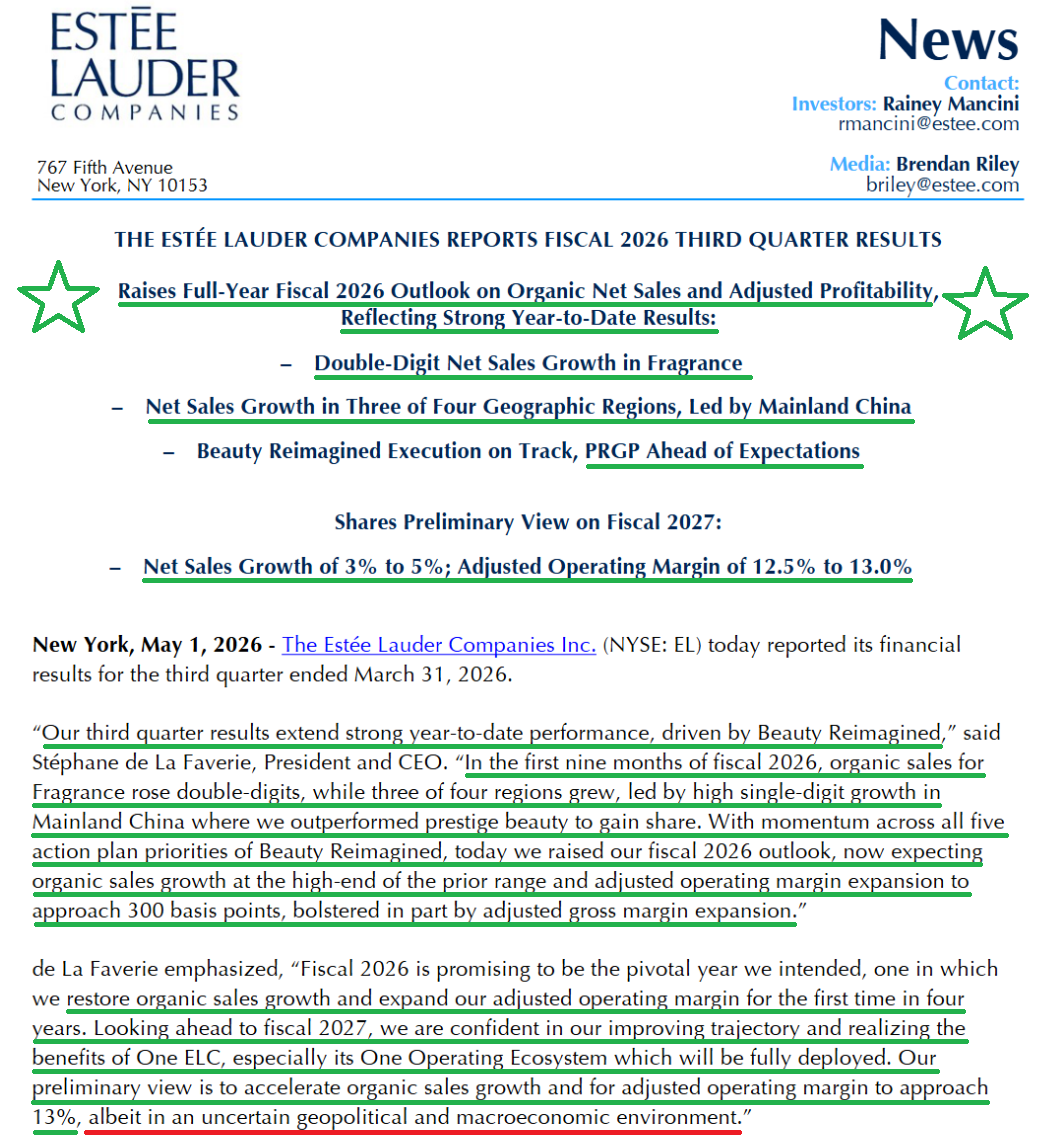
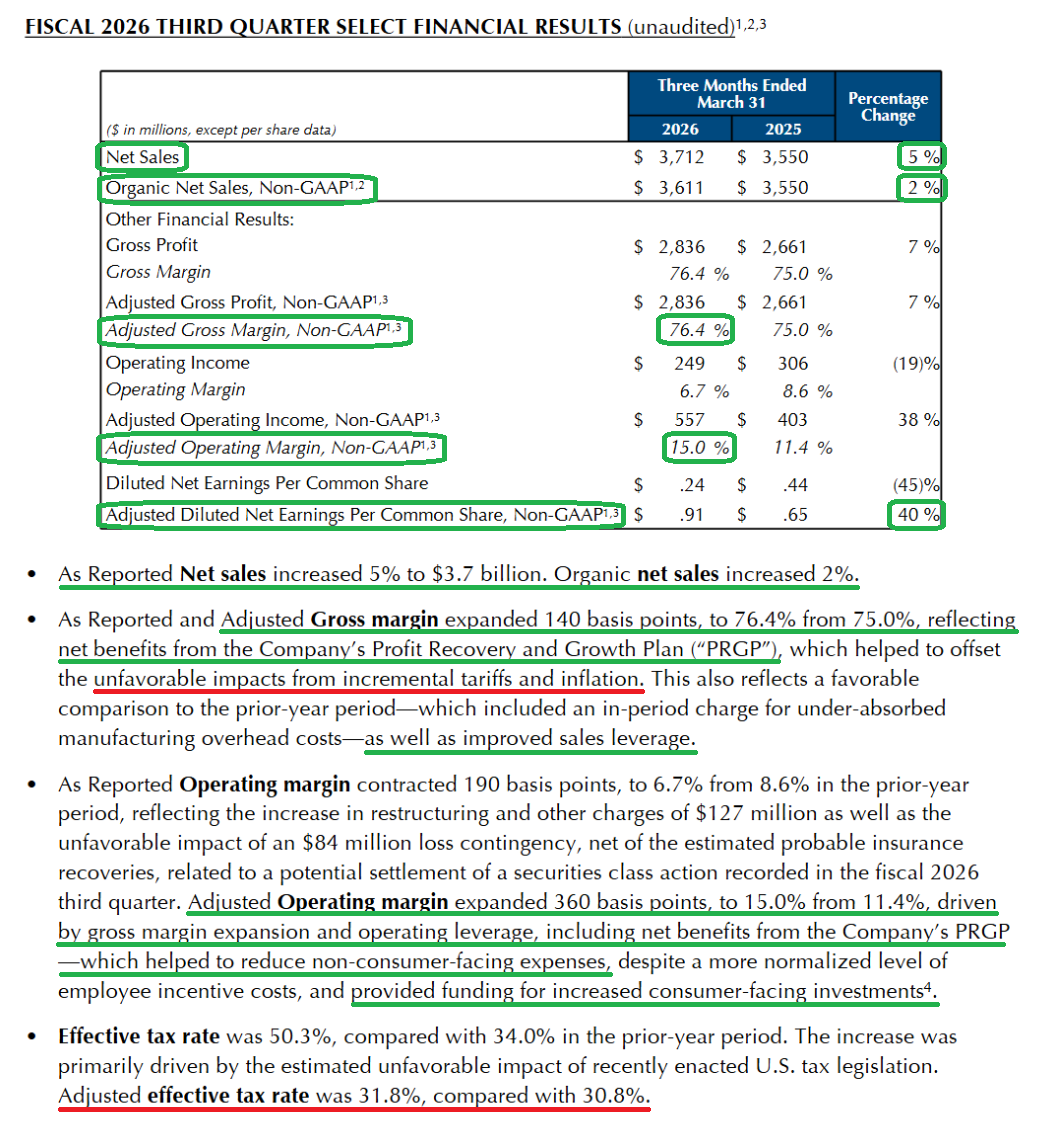
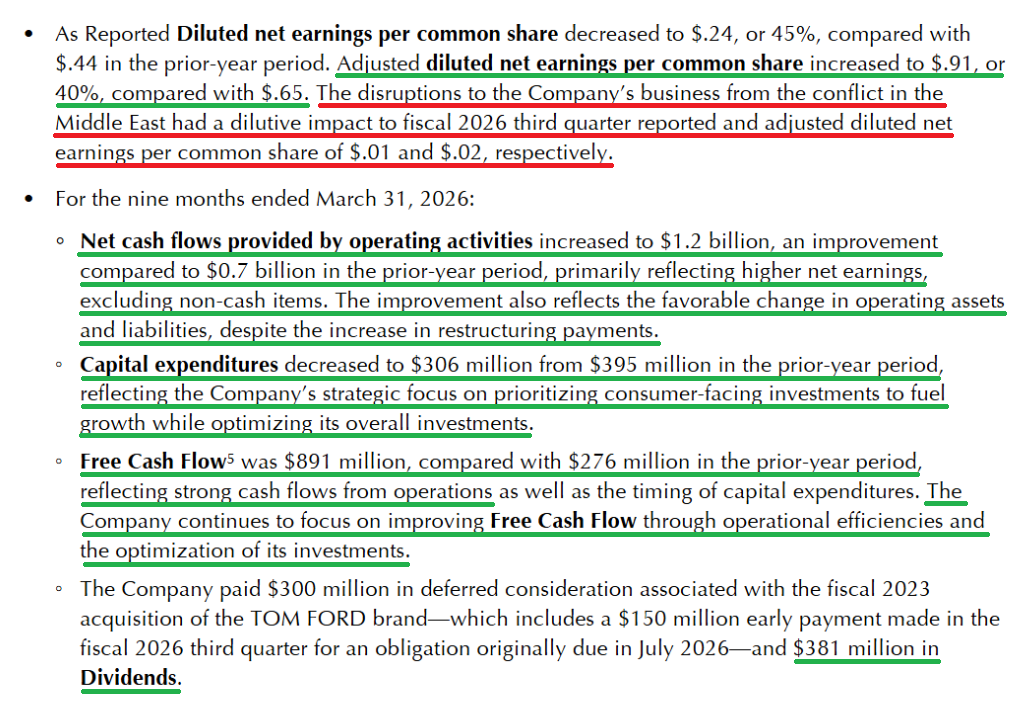
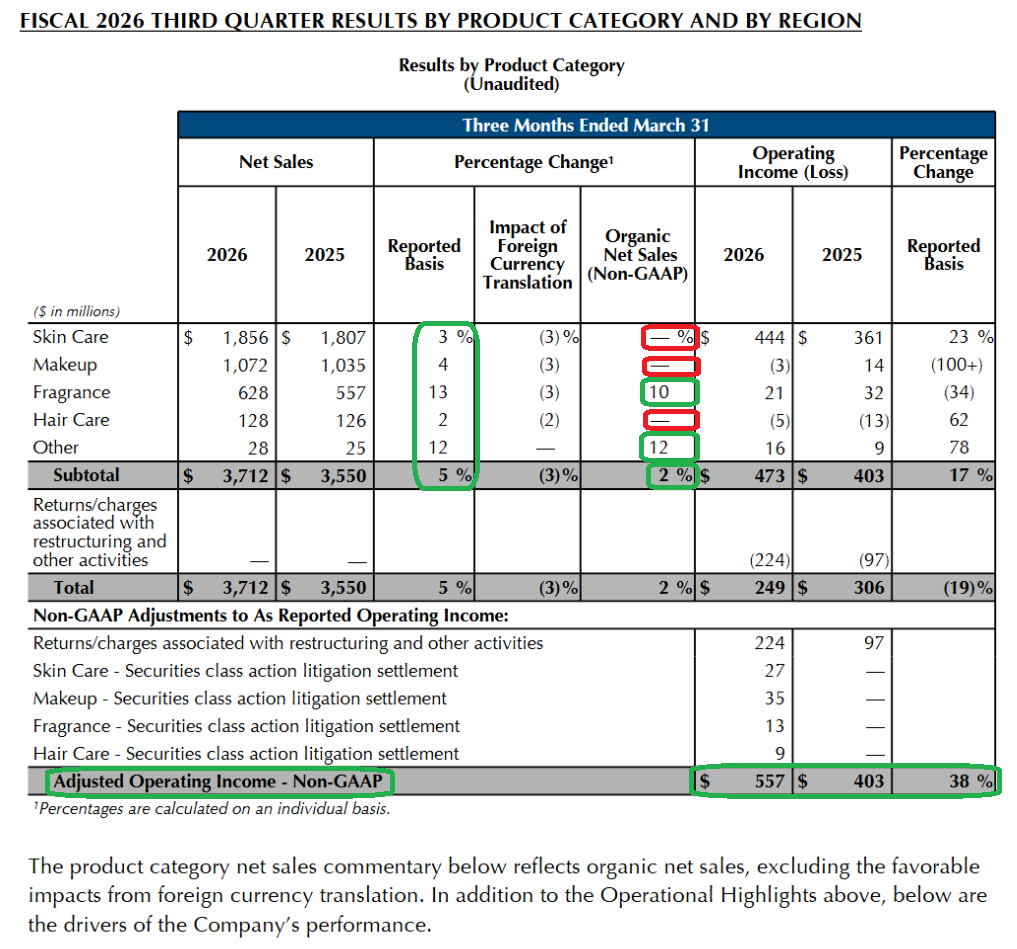
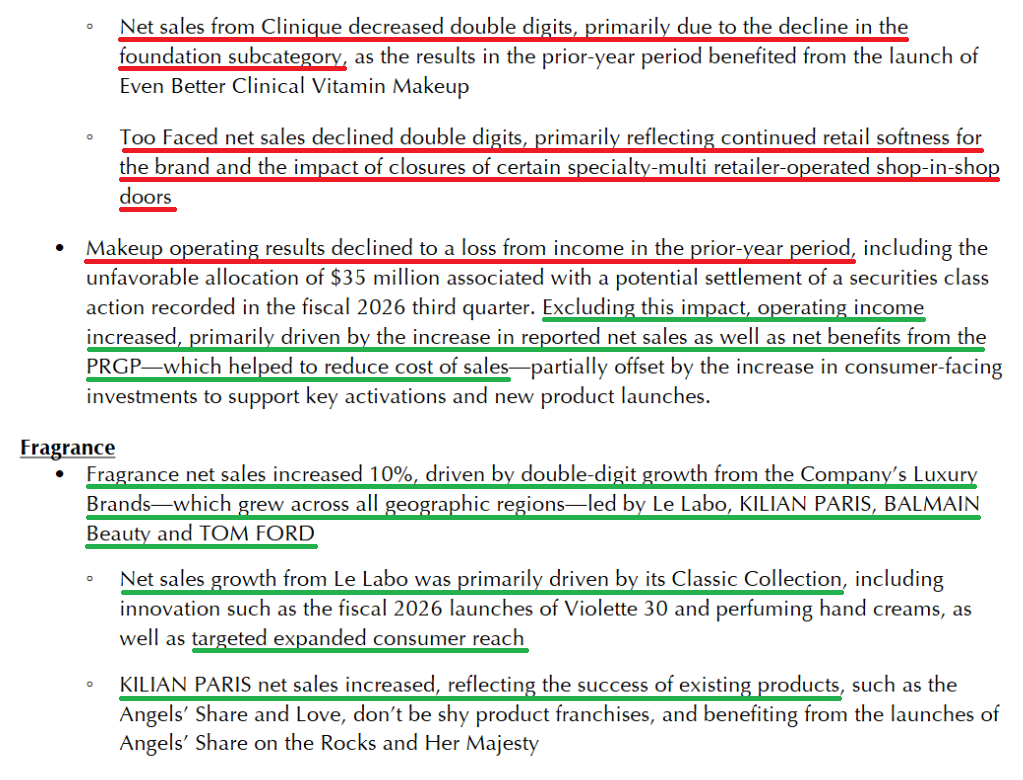
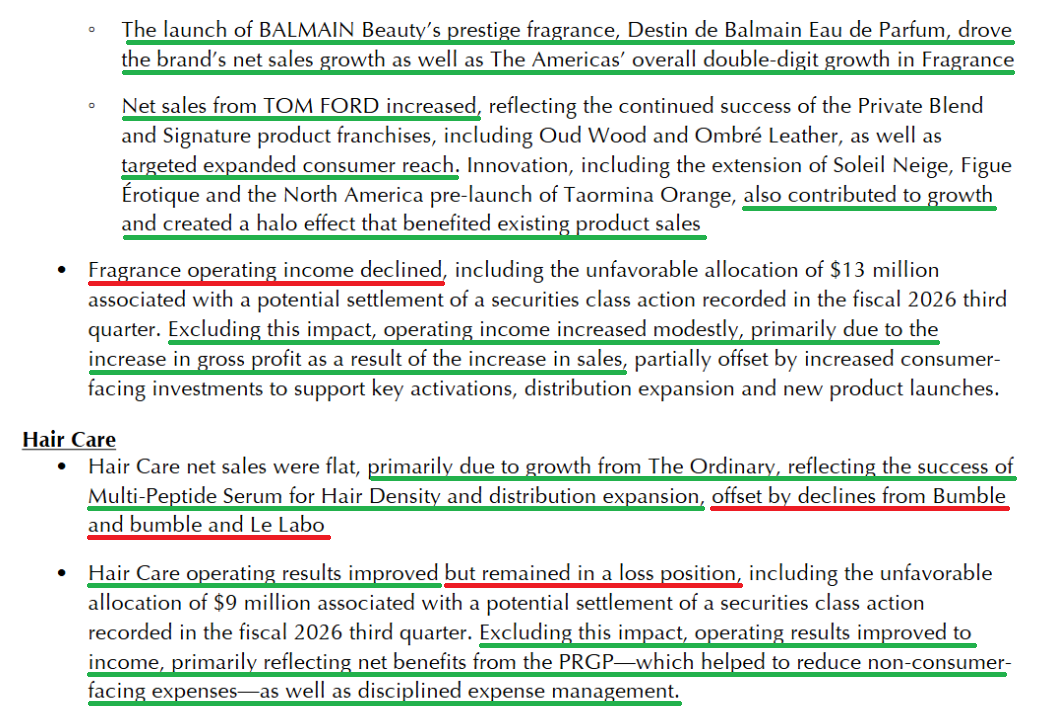
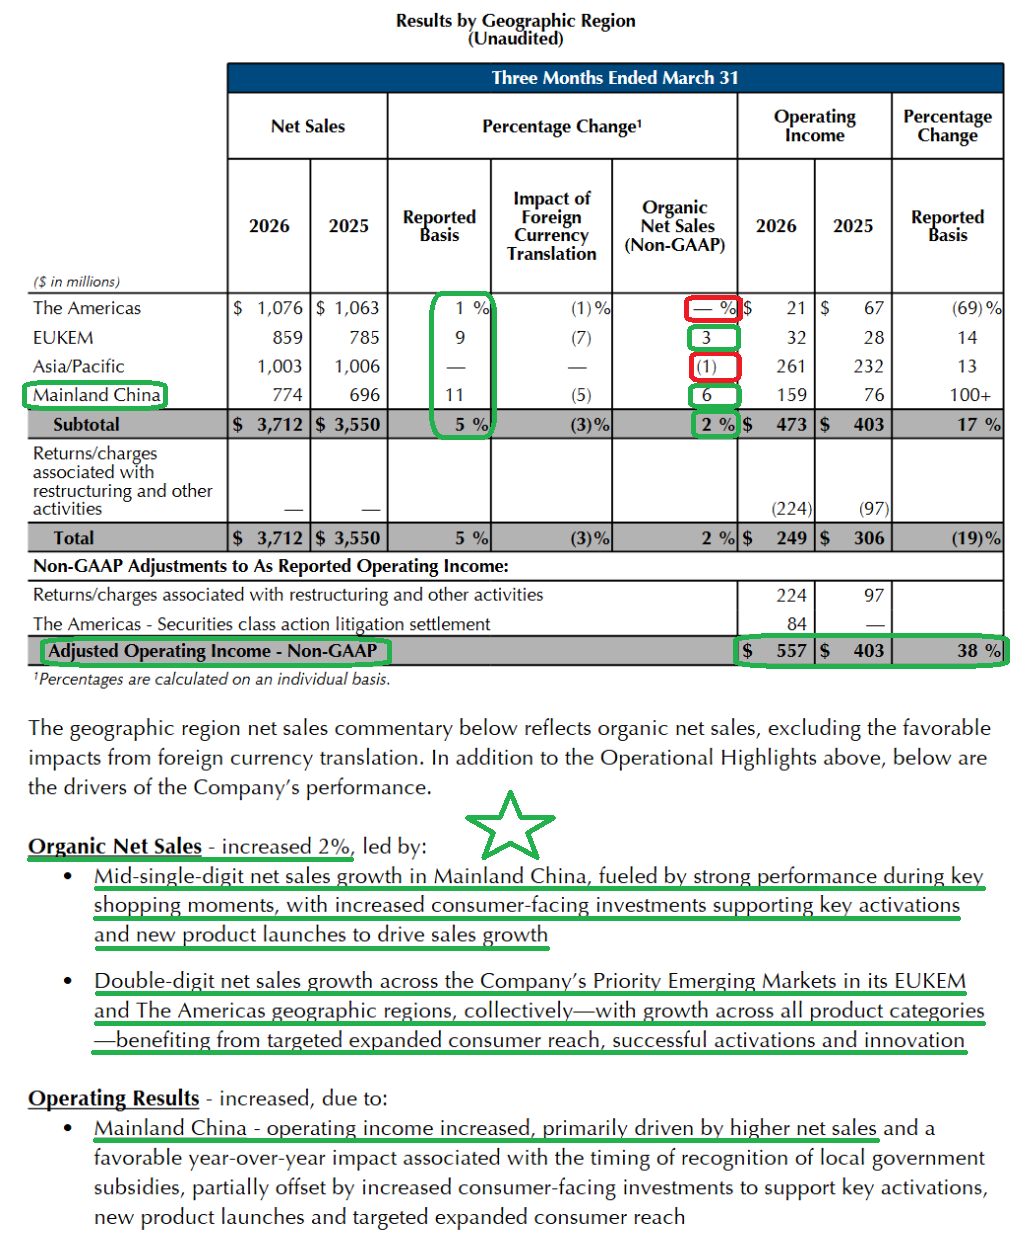
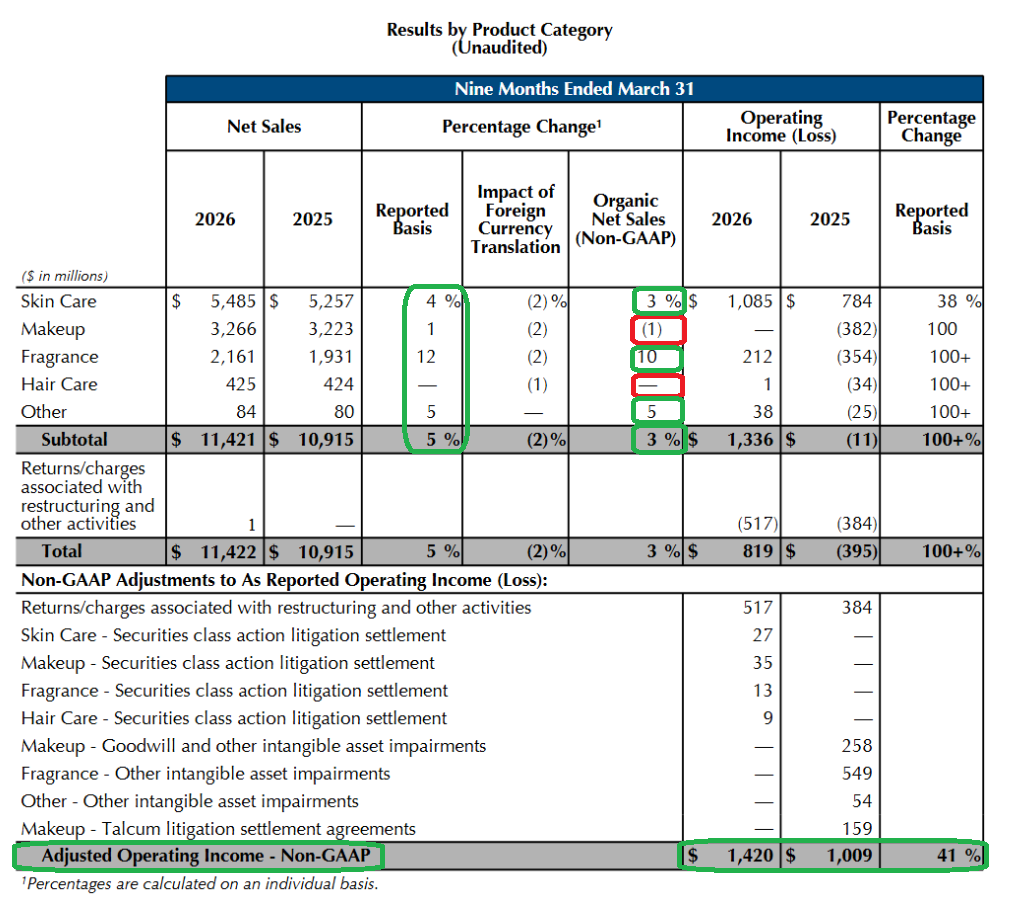
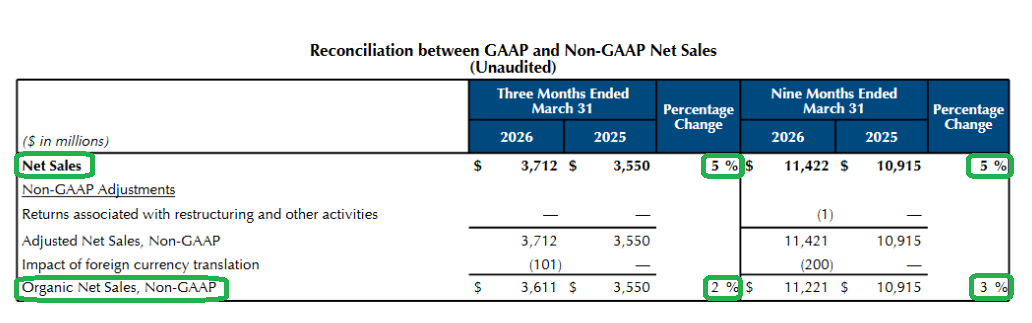
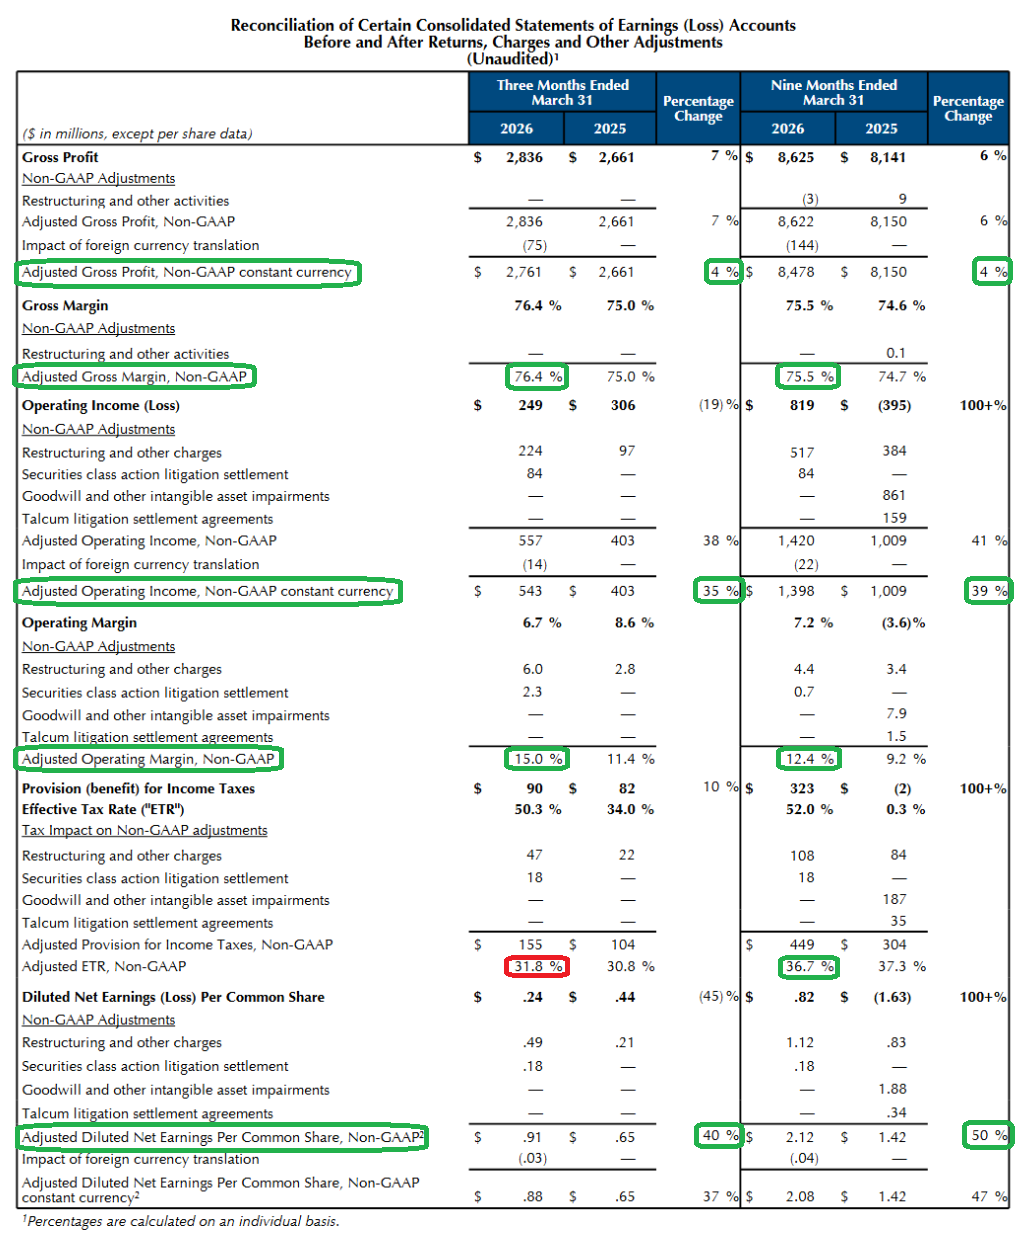
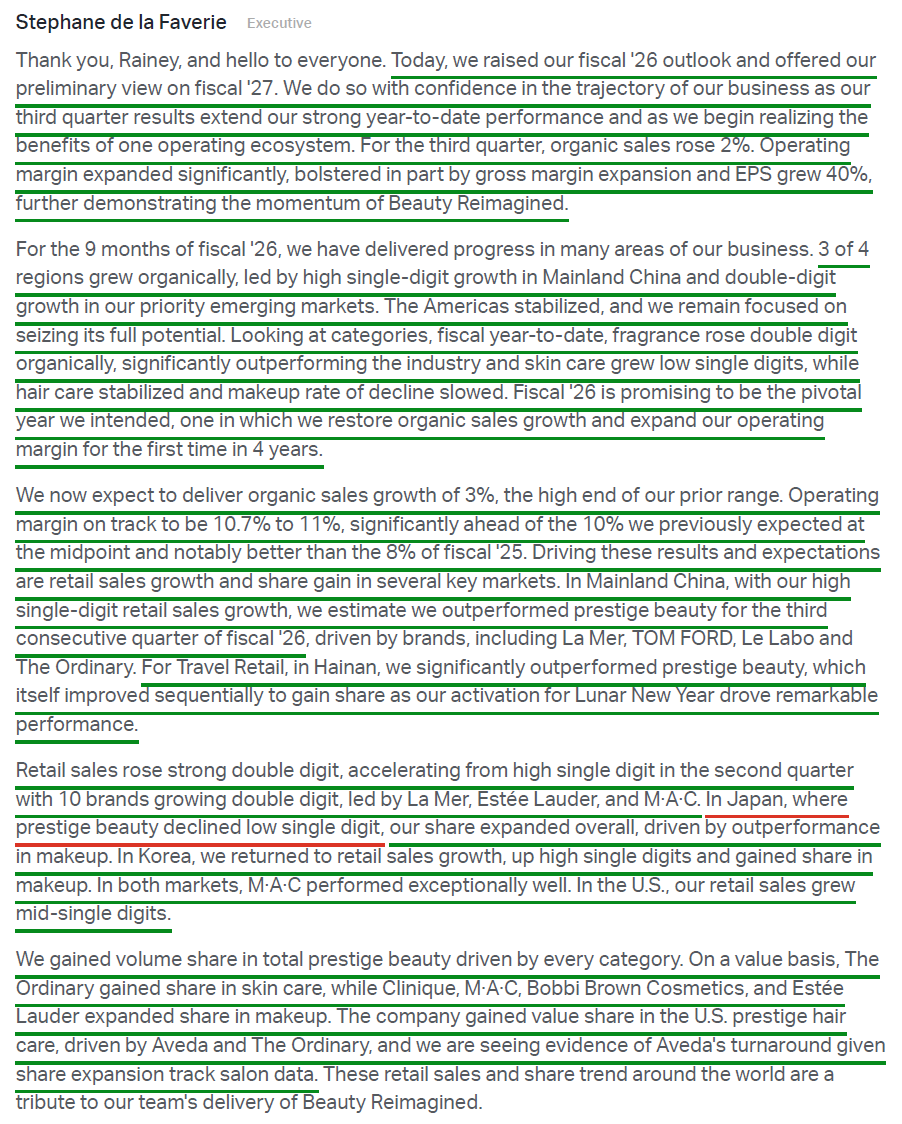
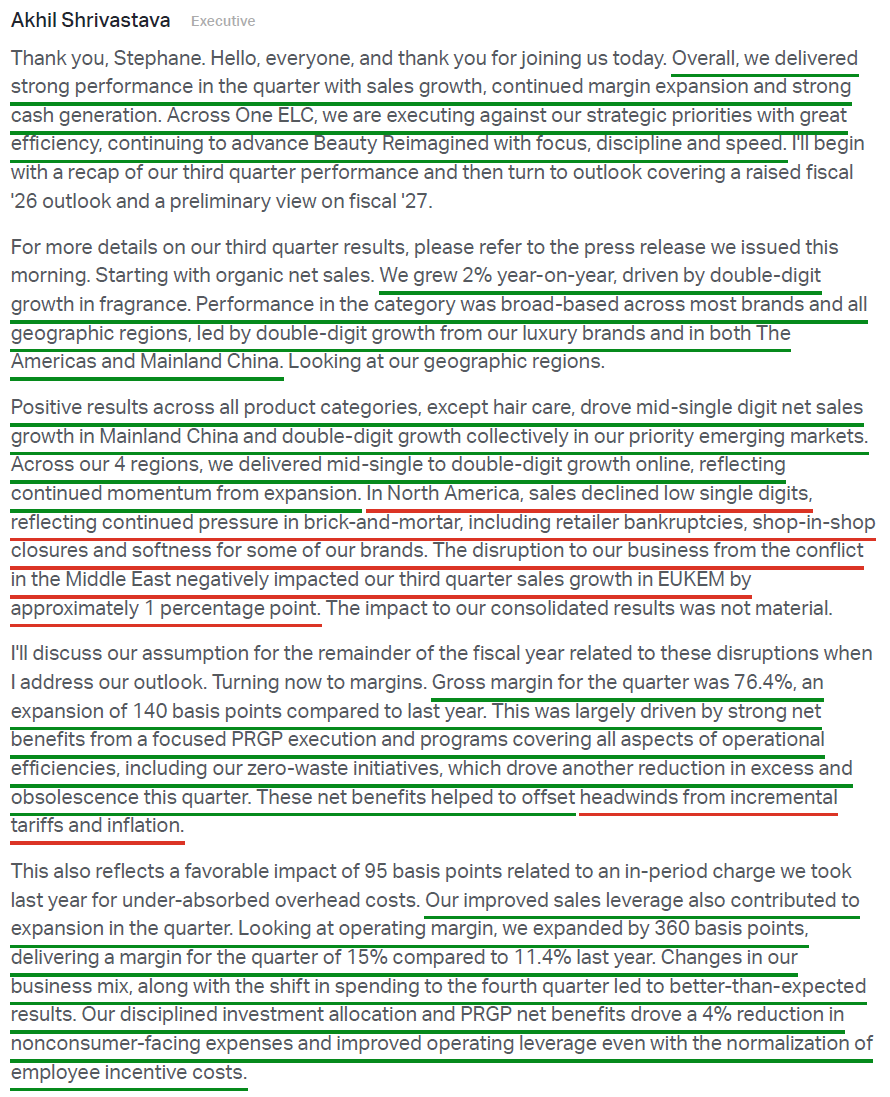
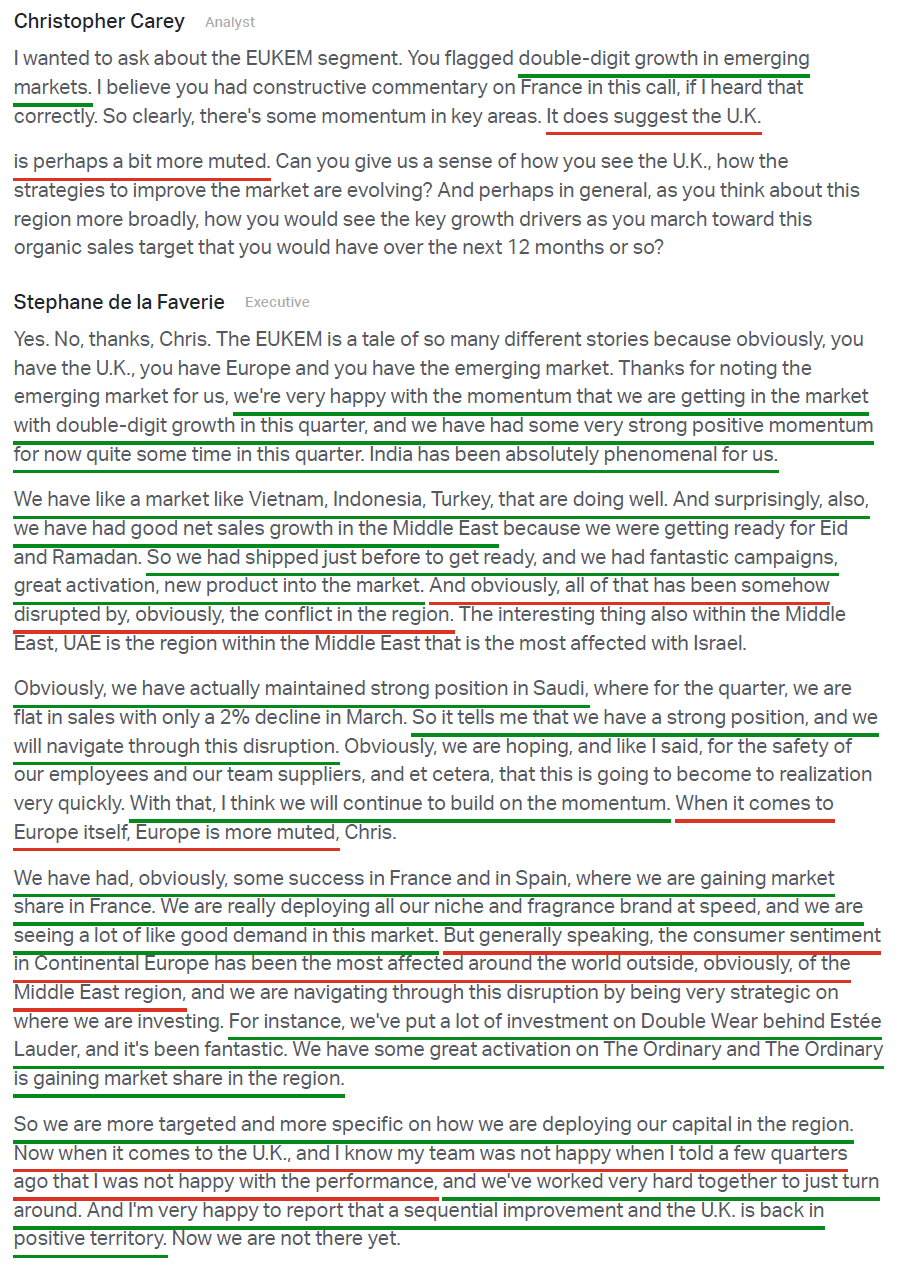
1) Estée Lauder reported Q3 net sales of $3.71B (+4.6% reported, +1.7% organic), slightly ahead of consensus at $3.69B and landing ~10 bps above the Street on organic growth. Three of four regions grew organically, led by high-single-digit growth in Mainland China and double-digit growth across priority emerging markets. Fragrance led the quarter at +10% organic on luxury strength, while Skin Care, Makeup, and Hair Care were each roughly flat. YTD organic growth now stands at +3%, keeping EL on track for its first year of positive organic growth in four years (FY25 -8%, FY24 -1.7%, FY23 -6%). Adjusted EPS of $0.91 (+40% Y/Y) beat consensus of $0.65 by 40%.
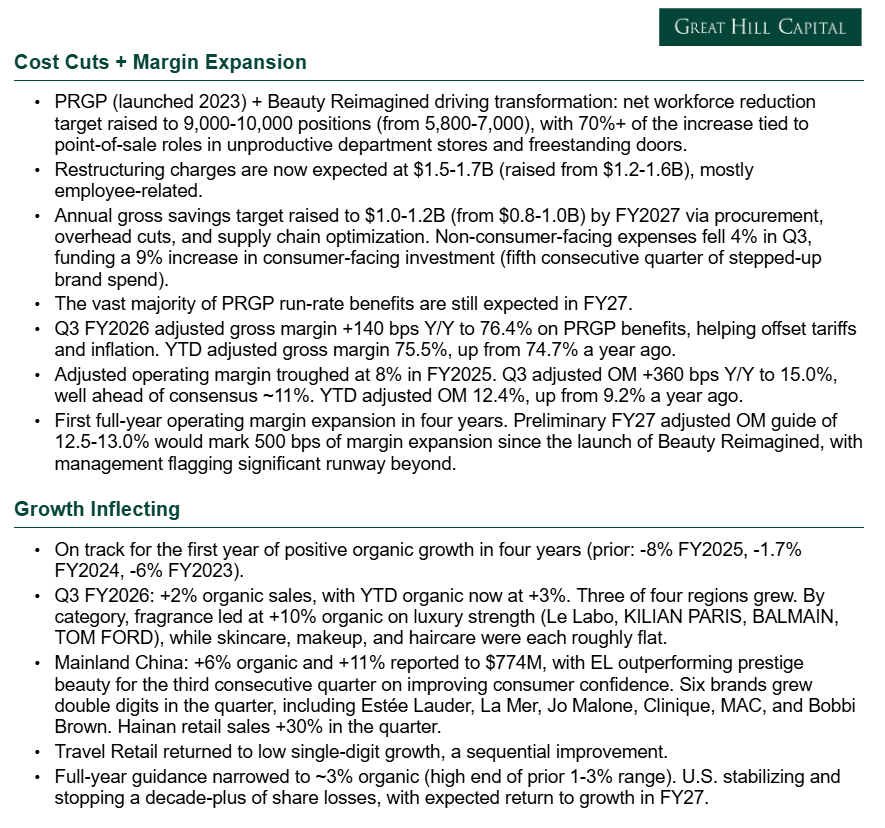
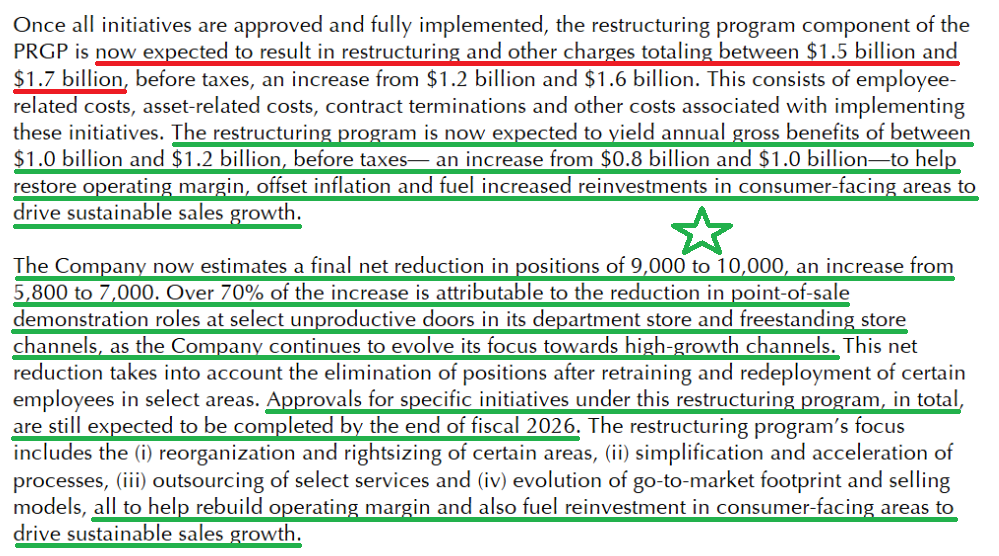
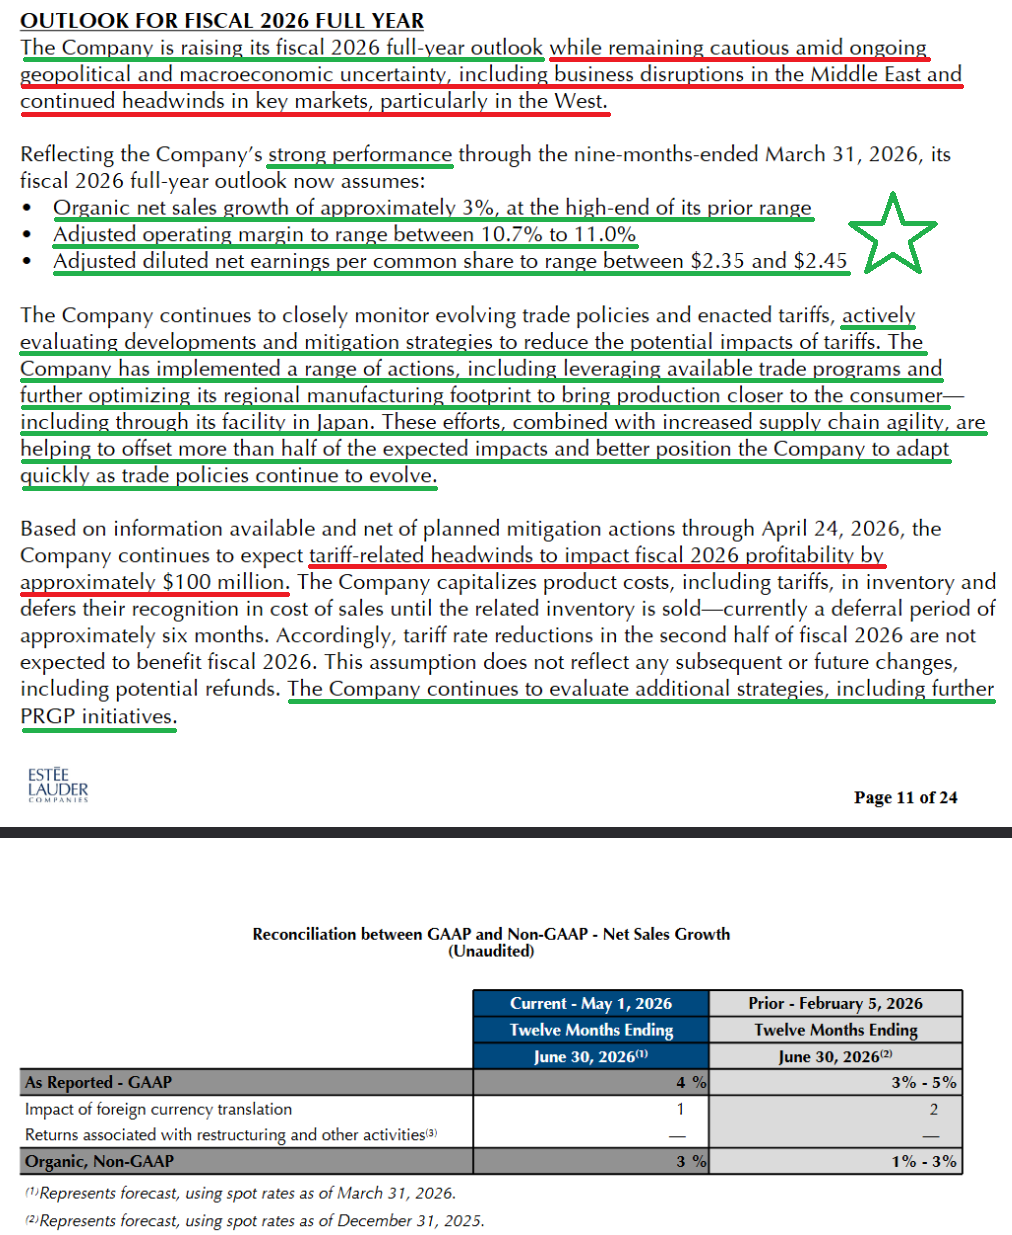
2) Adjusted gross margin expanded 140 bps Y/Y to 76.4% from 75.0%, lifting YTD adjusted gross margin to 75.5% from 74.7% a year ago. The expansion was driven by net benefits from the Profit Recovery and Growth Plan, including zero-waste initiatives that drove another reduction in excess and obsolescence, which together helped offset incremental tariff and inflation headwinds. For the full year, management continues to expect ~$100M of tariff-related headwinds to FY26 profitability, with mitigation actions, including leveraging available trade programs and further optimizing the regional manufacturing footprint to bring production closer to the consumer, expected to offset more than half of the impact.
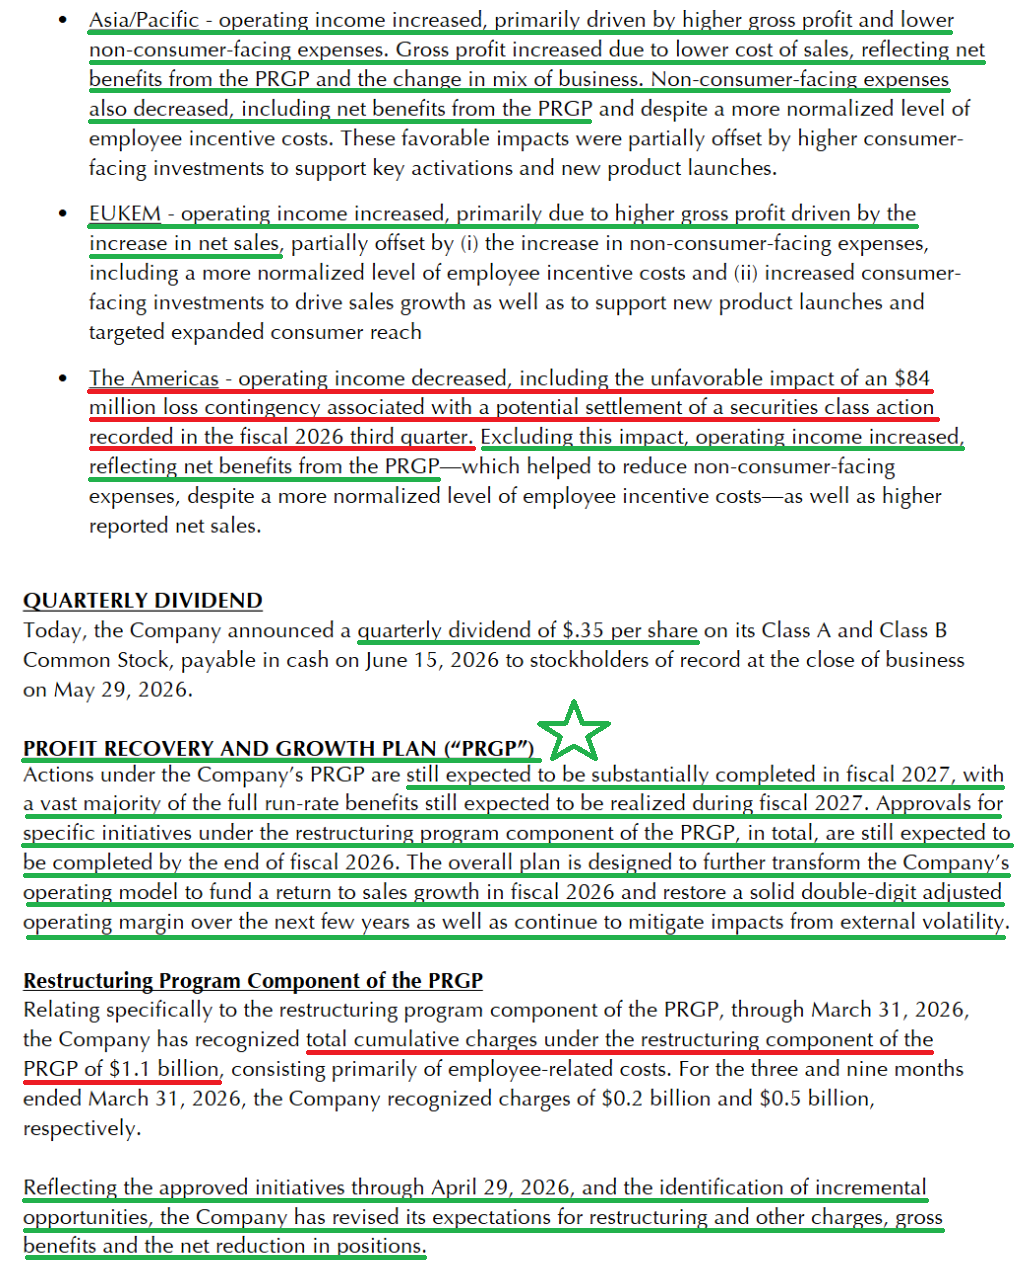
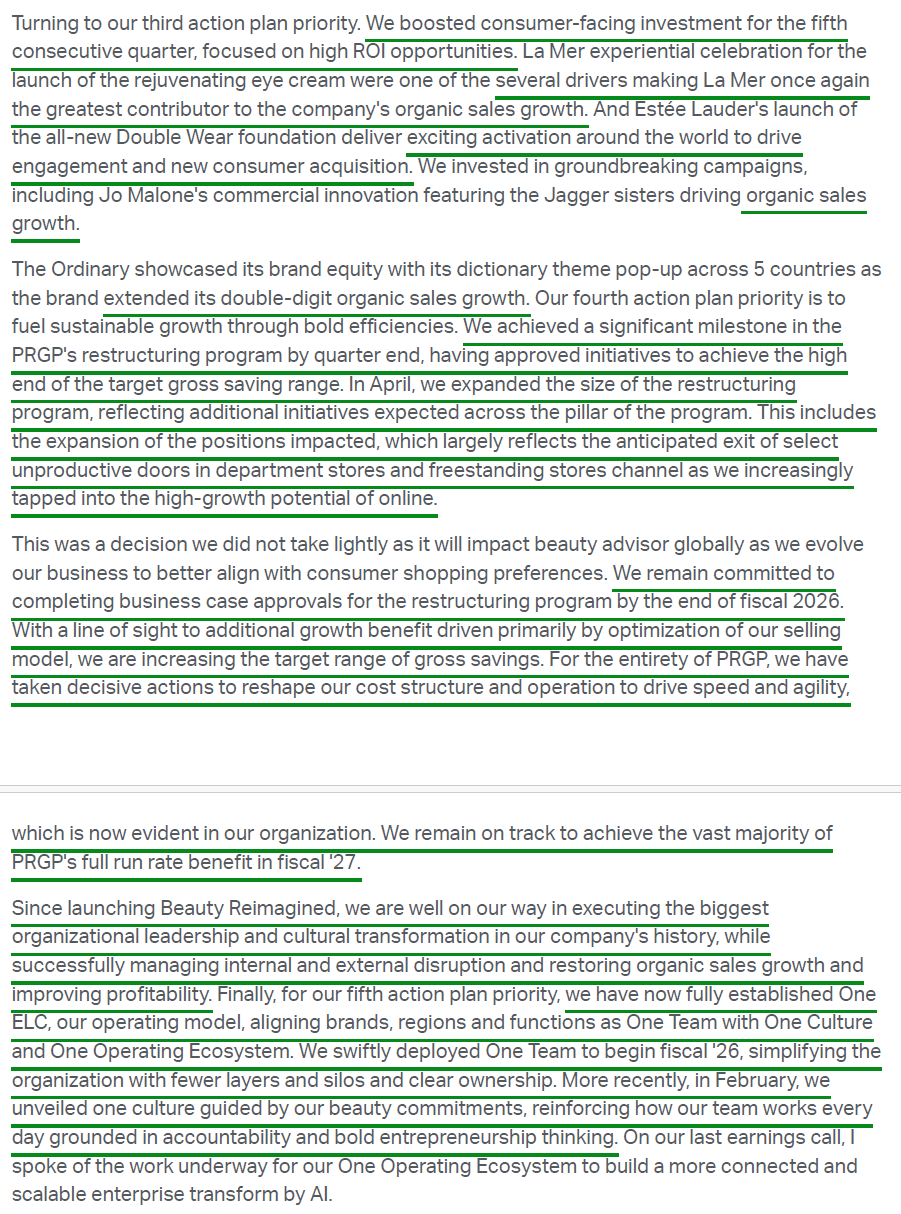
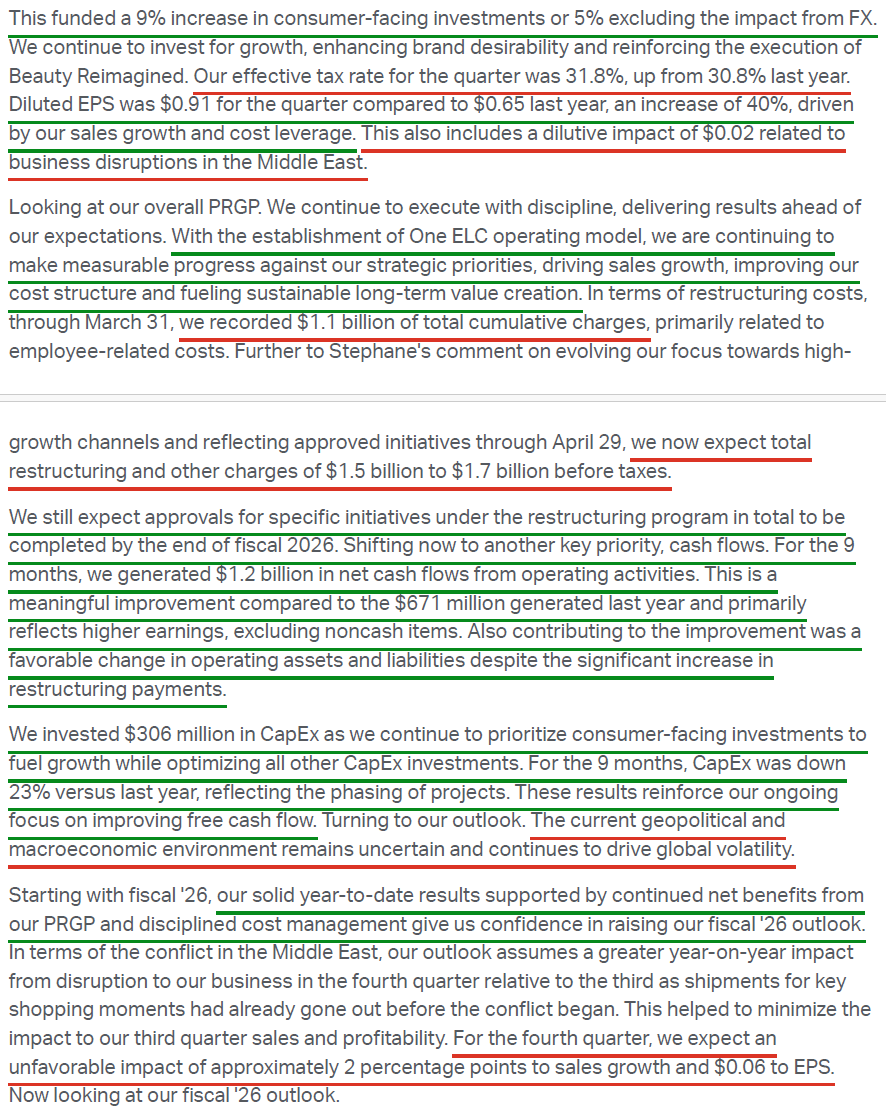
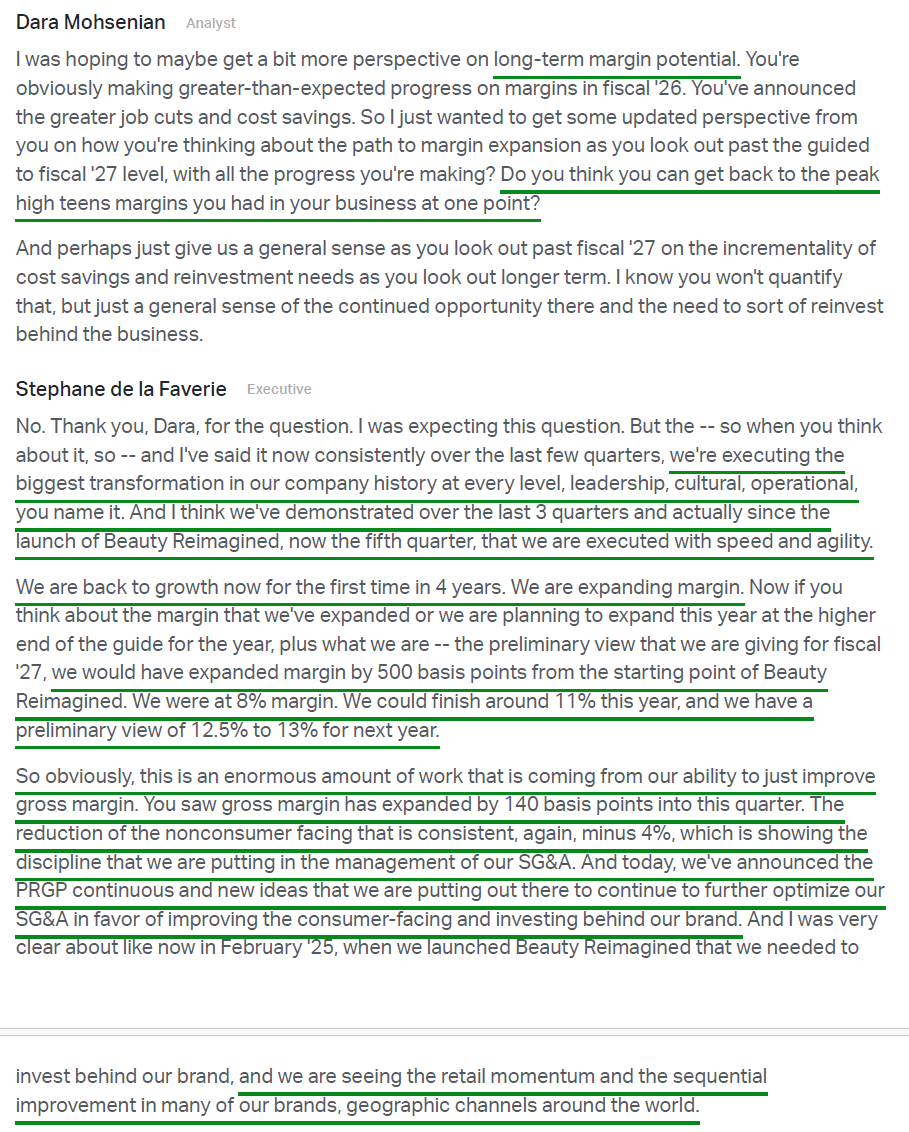
3) Adjusted operating income jumped 38% to $557M, lifting adjusted operating margin to 15.0% (vs. consensus ~11%) from 11.4% a year ago and bringing YTD adjusted operating margin to 12.4% from 9.2%. PRGP net benefits and tighter investment allocation drove a 4% reduction in non-consumer-facing expenses, even with the normalization of employee incentive costs, which in turn funded a 9% increase in high-ROI consumer-facing investment (5% ex-FX), marking the fifth consecutive quarter of stepped-up brand spending.
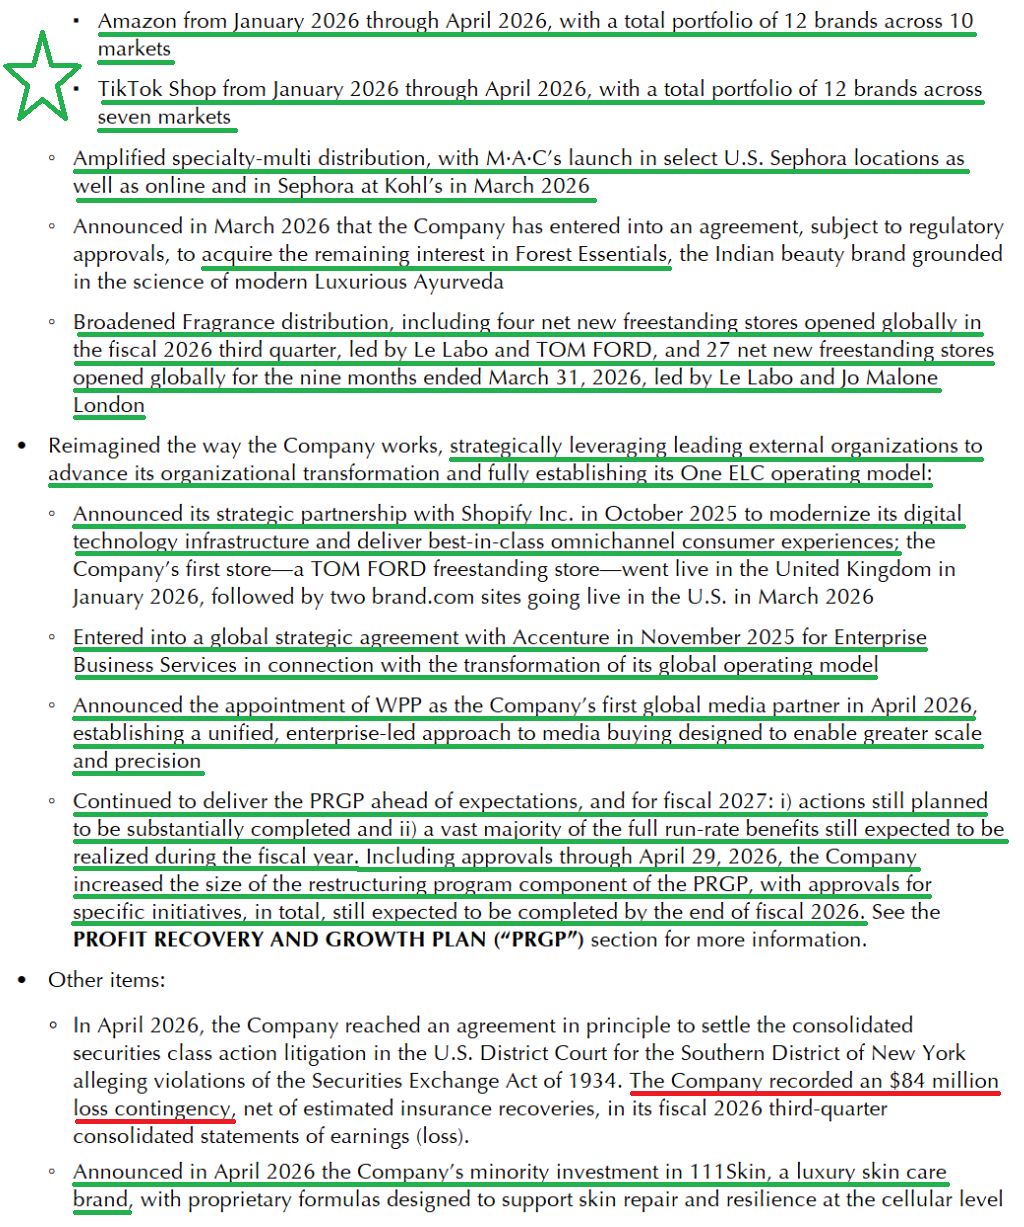
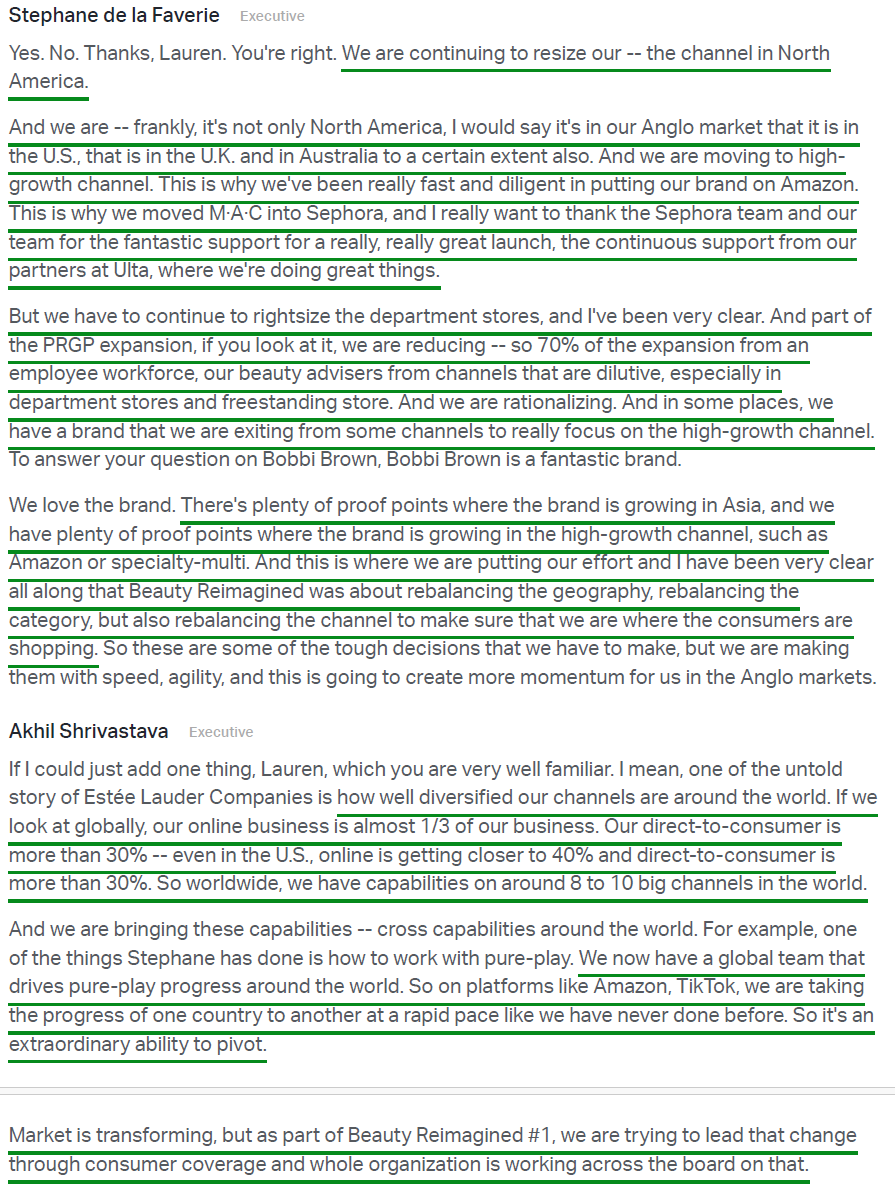
4) Management continues to execute against the PRGP ahead of expectations and materially expanded the program during the quarter. The net position reduction target was raised to 9,000–10,000 from the prior 5,800–7,000, with more than 70% of the increase tied to point-of-sale demonstration roles at unproductive department store and freestanding doors, as EL pivots toward high-growth channels. Annual gross savings were raised to $1.0–$1.2B from $0.8–$1.0B, while restructuring charges are now expected at $1.5–$1.7B from $1.2–$1.6B. Cumulative charges reached $1.1B through March, with approvals on track for completion by the end of FY26 and the vast majority of full run-rate benefits still expected in FY27.
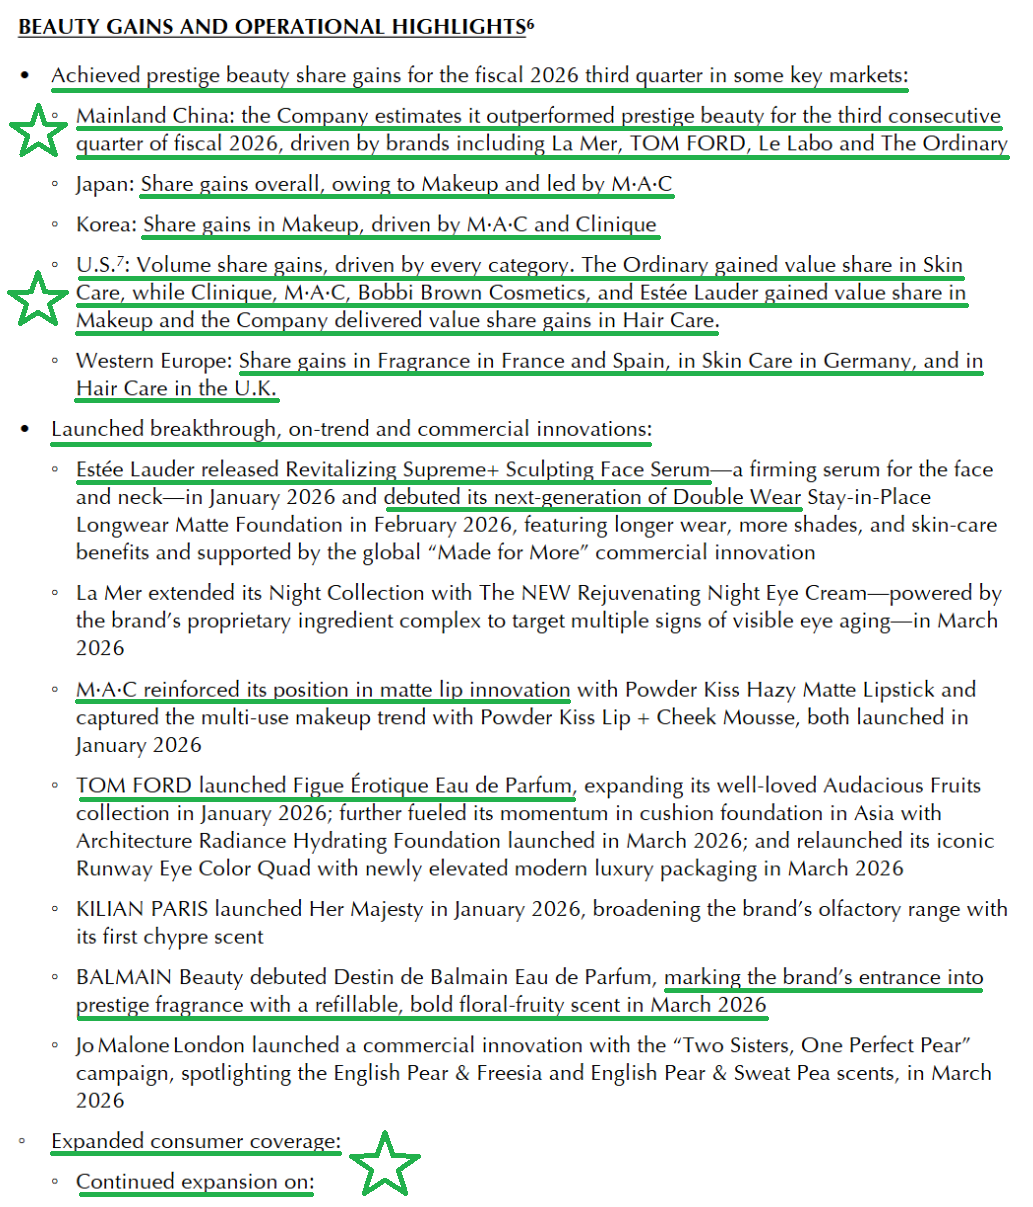
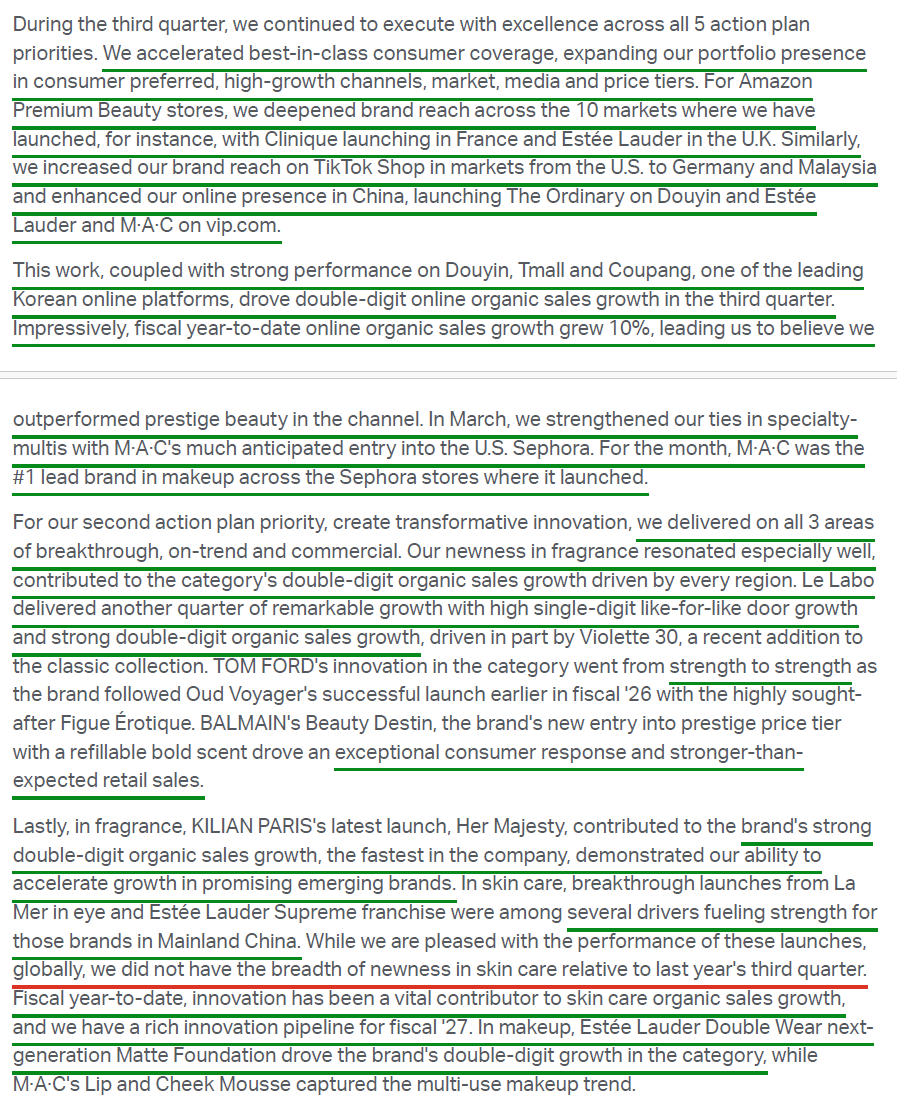
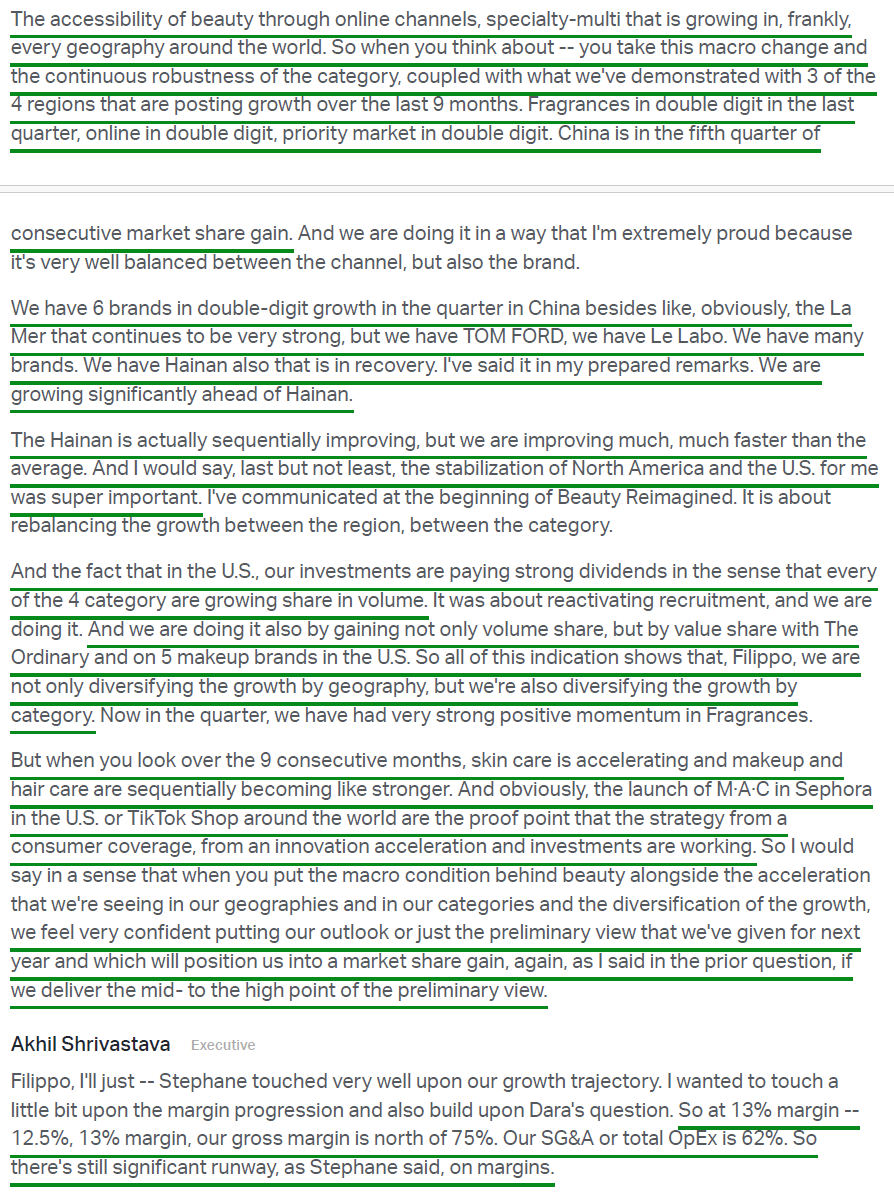
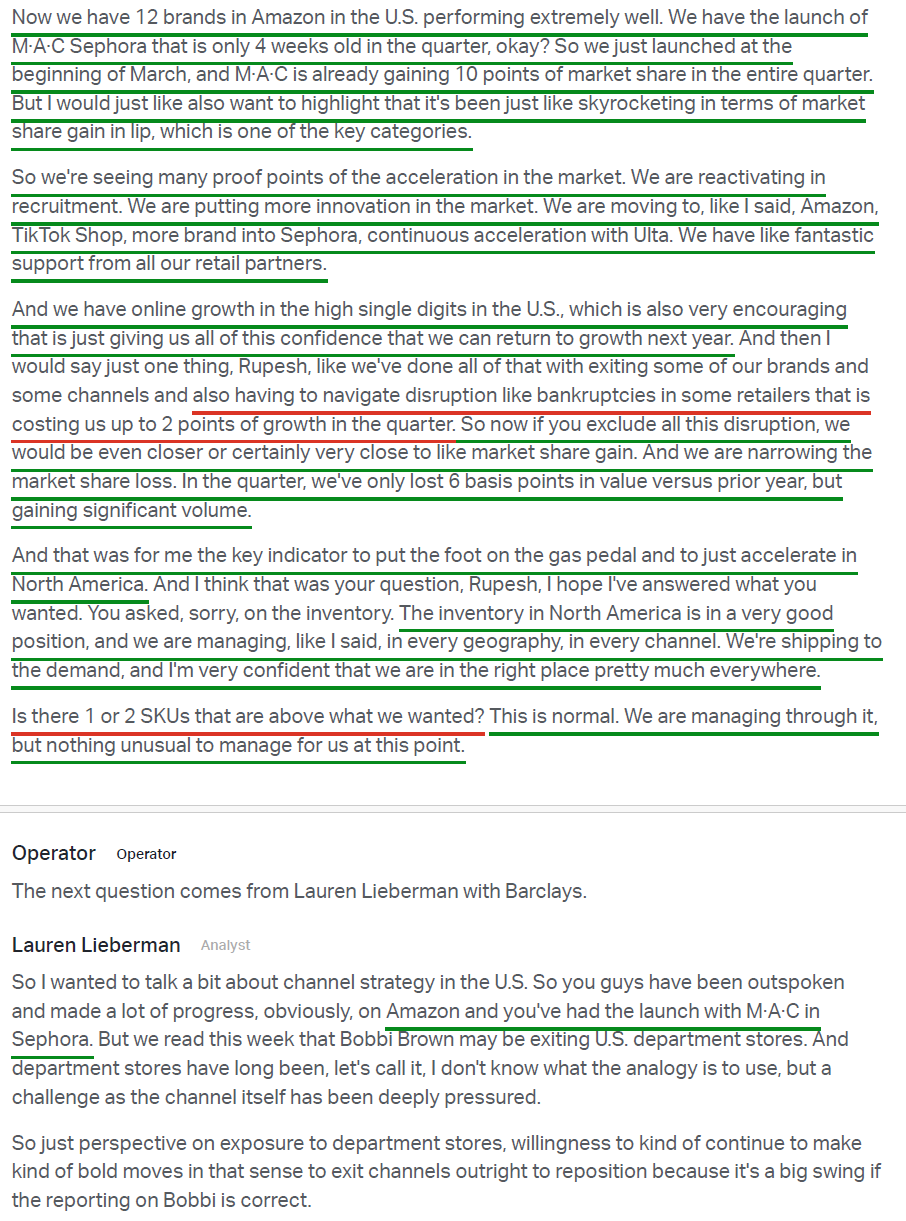
5) Online organic sales grew double digits in the quarter and ~10% YTD, with EL believing it outperformed prestige beauty in the channel. Amazon now spans 12 brands across 10 markets, and TikTok Shop spans 12 brands across 7 markets, with online now representing ~one-third of the global business and an even higher mix in the U.S. (~40%). Beyond digital, EL continued expanding across other high-growth channels, with the headline move being M·A·C’s much-anticipated entry into U.S. Sephora in March, where the brand was the #1 makeup brand at launched doors within its first month and gained ~10 points of share in the quarter.
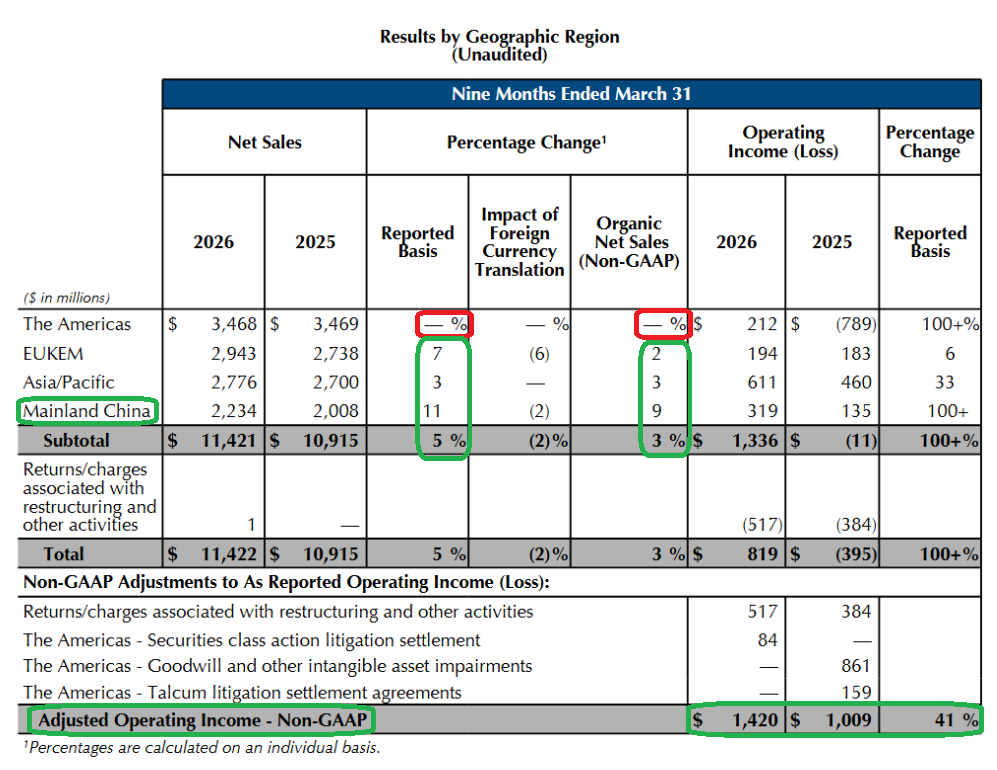
6) Mainland China sales rose 6% organic and 11% reported to $774M (~21% of total net sales), with EL estimating it outperformed prestige beauty for the third consecutive quarter amid improving consumer confidence. Six brands grew double digits, including Estée Lauder, La Mer, Jo Malone London, Clinique, M·A·C, and Bobbi Brown Cosmetics. Travel Retail also returned to low-single-digit growth, a sequential improvement, with Hainan retail sales up over 30% in the quarter, as Lunar New Year activation drove a strong performance well ahead of the broader channel.
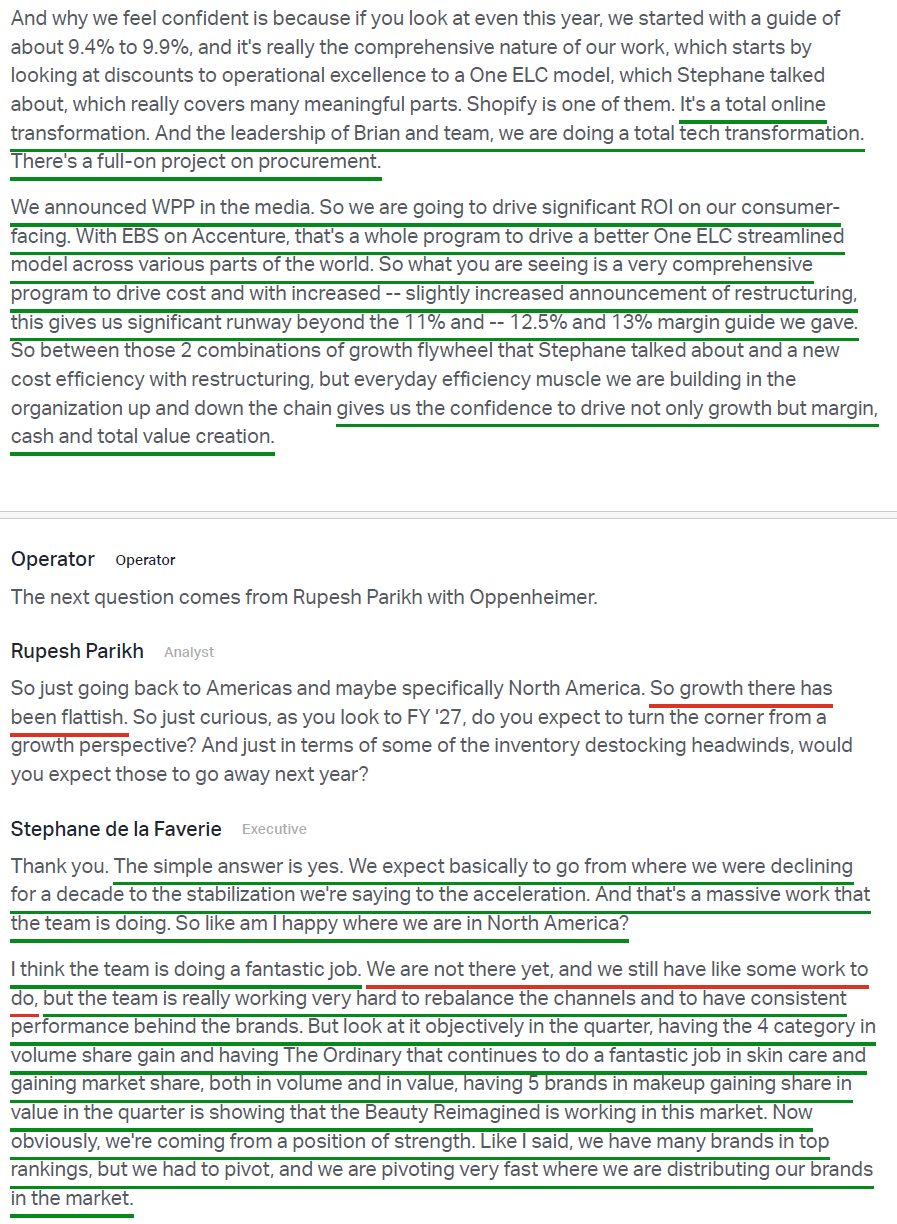
7) Americas net sales were $1.08B (~29% of total net sales), up 1% reported and flat organically. North America remained the weak spot, with sales down low single digits on continued brick-and-mortar pressure, including retailer bankruptcies and shop-in-shop closures that cost up to 2 points of growth in the quarter. That said, management pointed to several green shoots across the business, with U.S. retail sales growing mid-single digits as EL gained volume share in total prestige beauty across every category, picked up value share via The Ordinary in skin care and five makeup brands, and narrowed its value share loss to just 6 bps. Encouragingly, U.S. online sales grew high single digits, a key factor behind management’s confidence that North America can move from a decade of decline through the current stabilization and return to growth in FY27.
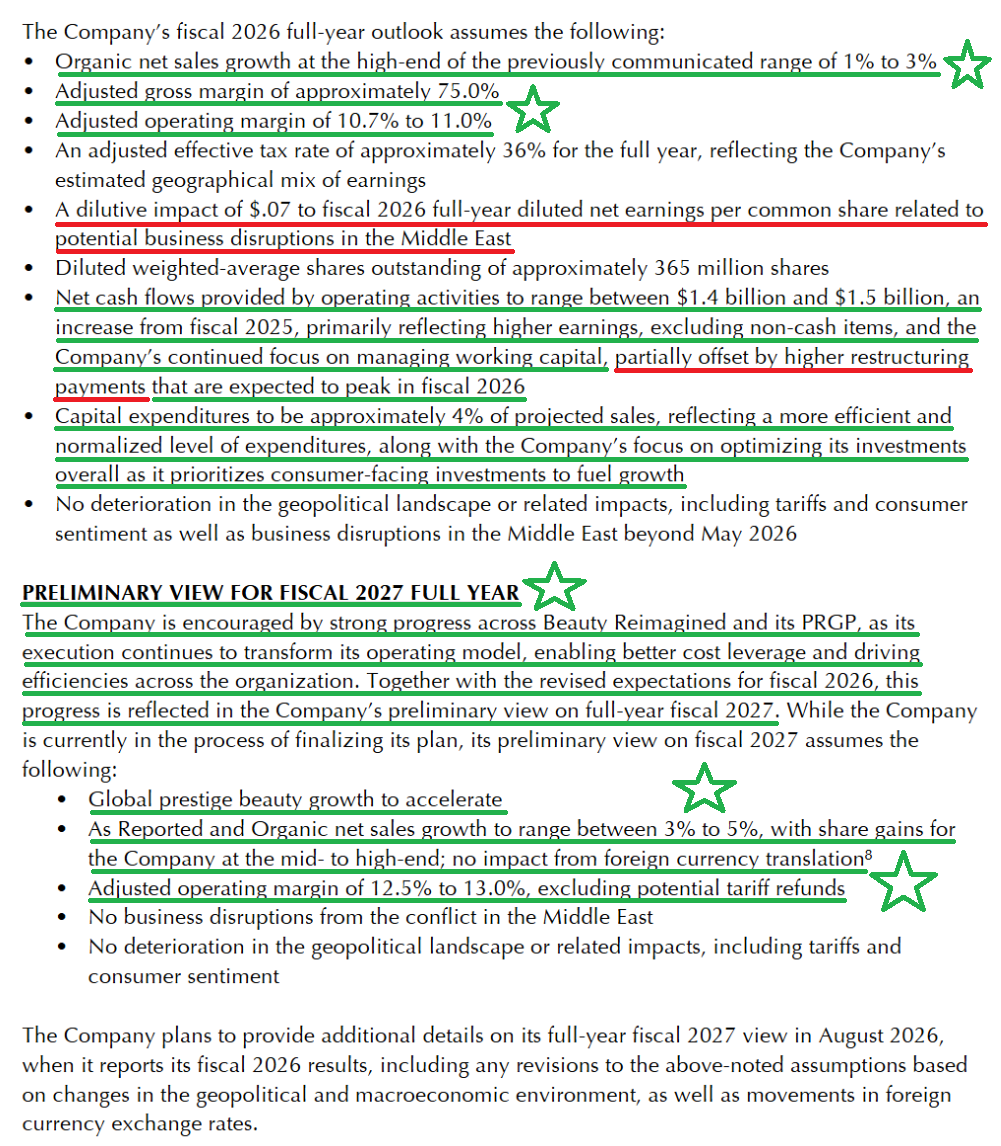
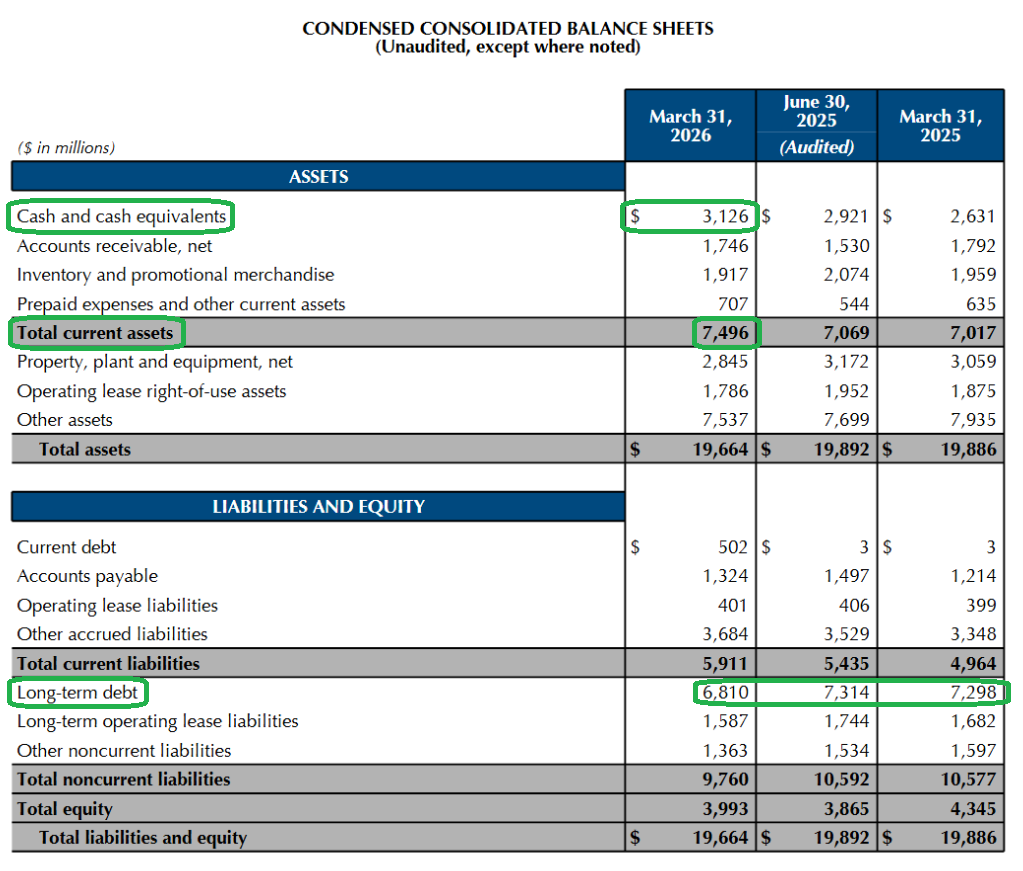
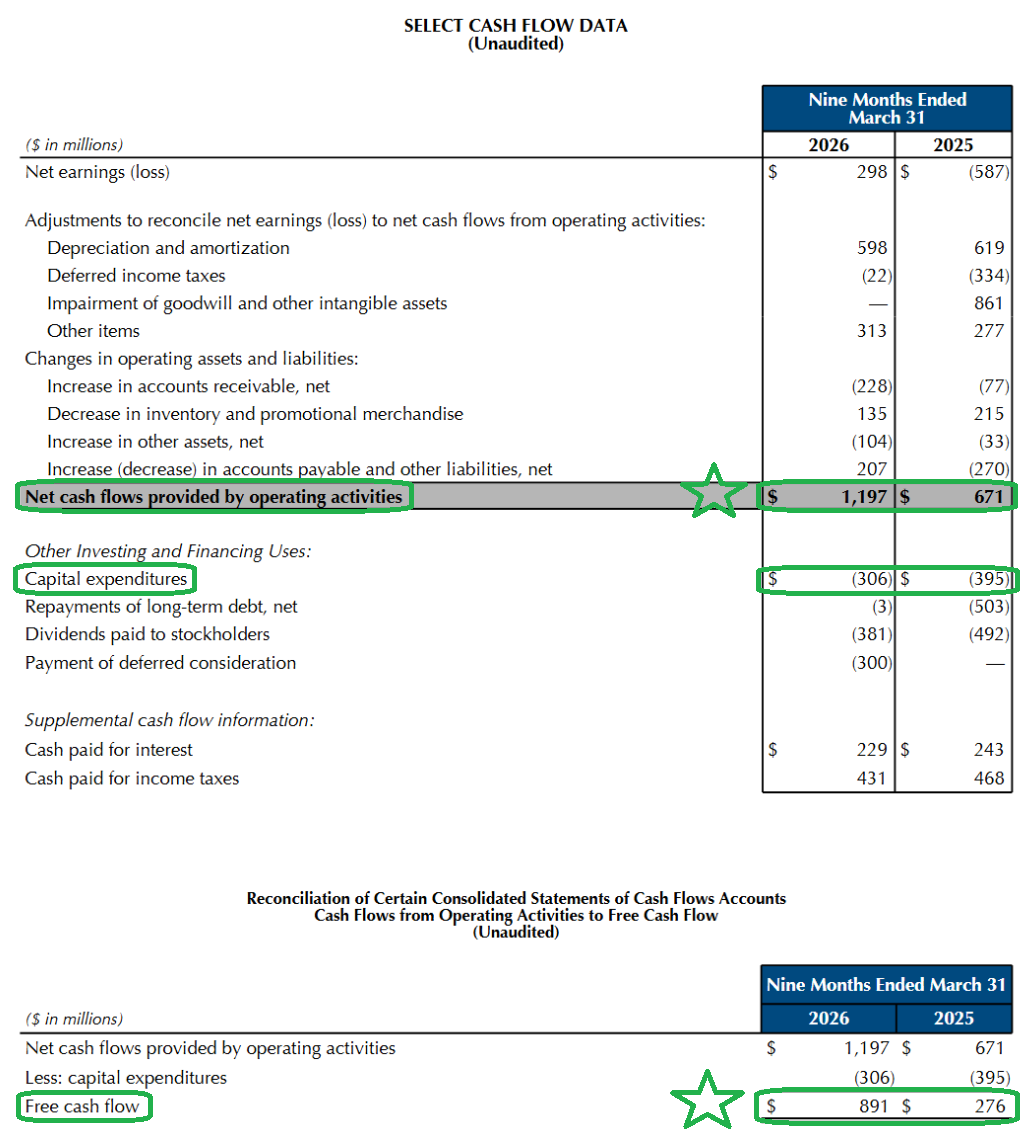
8) YTD free cash flow reached $891M versus $276M a year ago, a more-than-3x improvement driven by higher earnings and continued capital discipline. Operating cash flow rose to $1.2B from $0.7B, while capex fell 23% Y/Y to $306M as management continues to prioritize higher-ROI, consumer-facing investment over capacity expansion. Full-year capex is guided to ~4% of sales, with operating cash flow expected at $1.4–$1.5B.
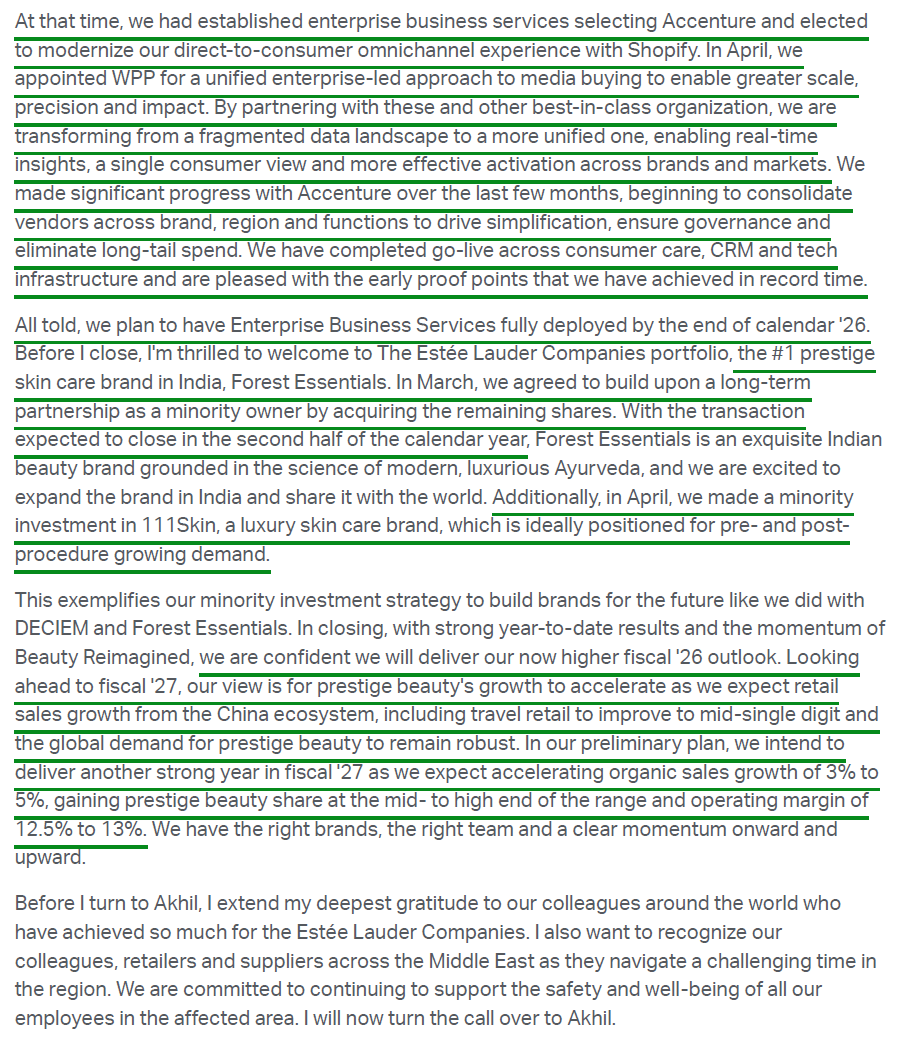
9) EL continues to actively manage and make targeted investments across its portfolio of 20+ brands, agreeing to acquire the remaining interest in Forest Essentials, the #1 prestige skincare brand in India, with the deal expected to close in the second half of the calendar year, while also making a minority investment in 111Skin during the quarter, a luxury brand positioned in the growing pre- and post-procedure category. The key question mark remains the potential Puig merger, on which management declined to comment, saying it would not provide further information ahead of any official announcement.
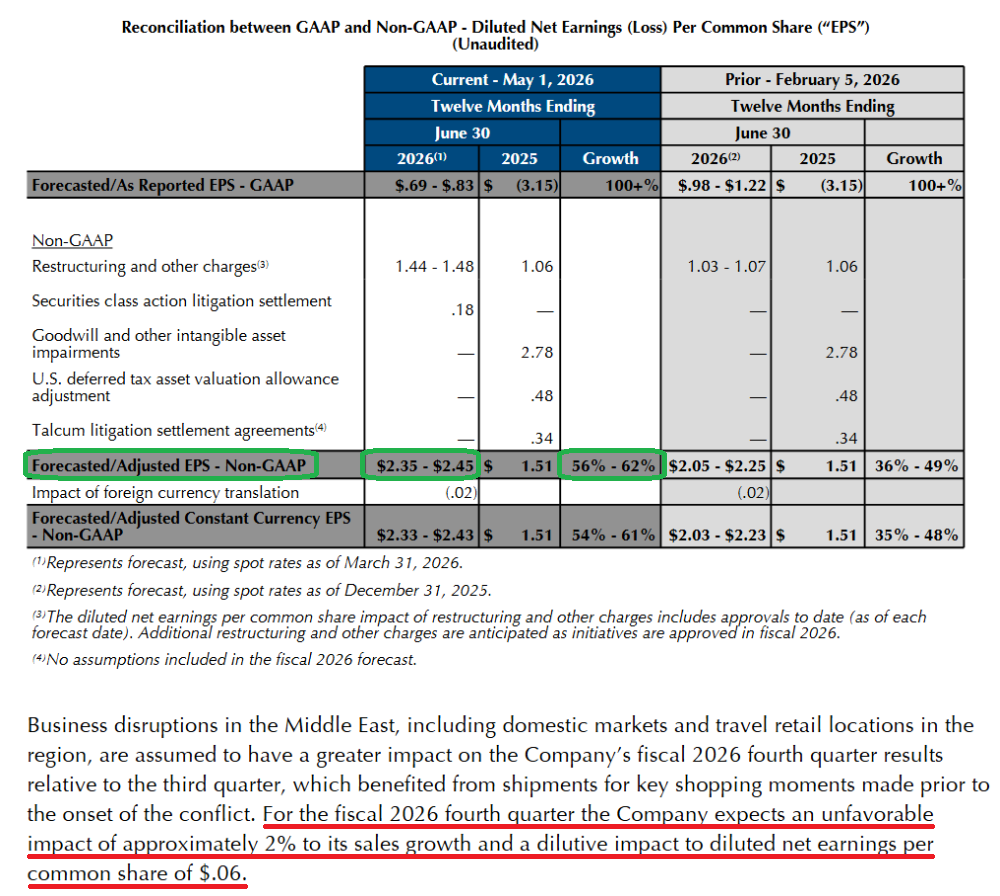
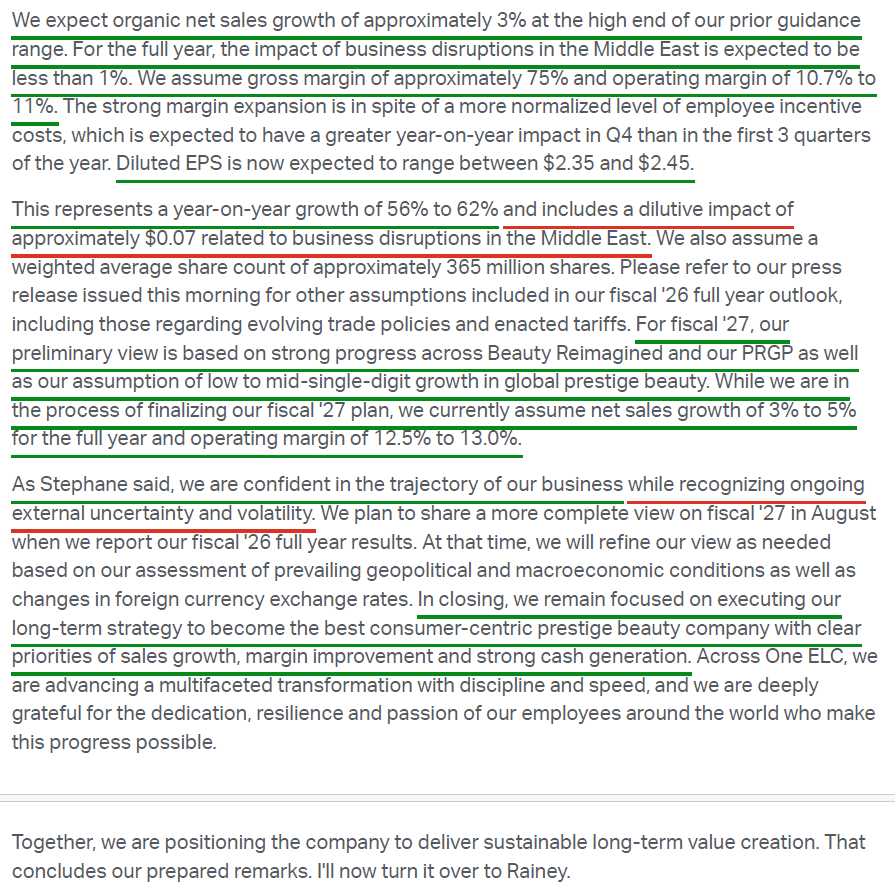
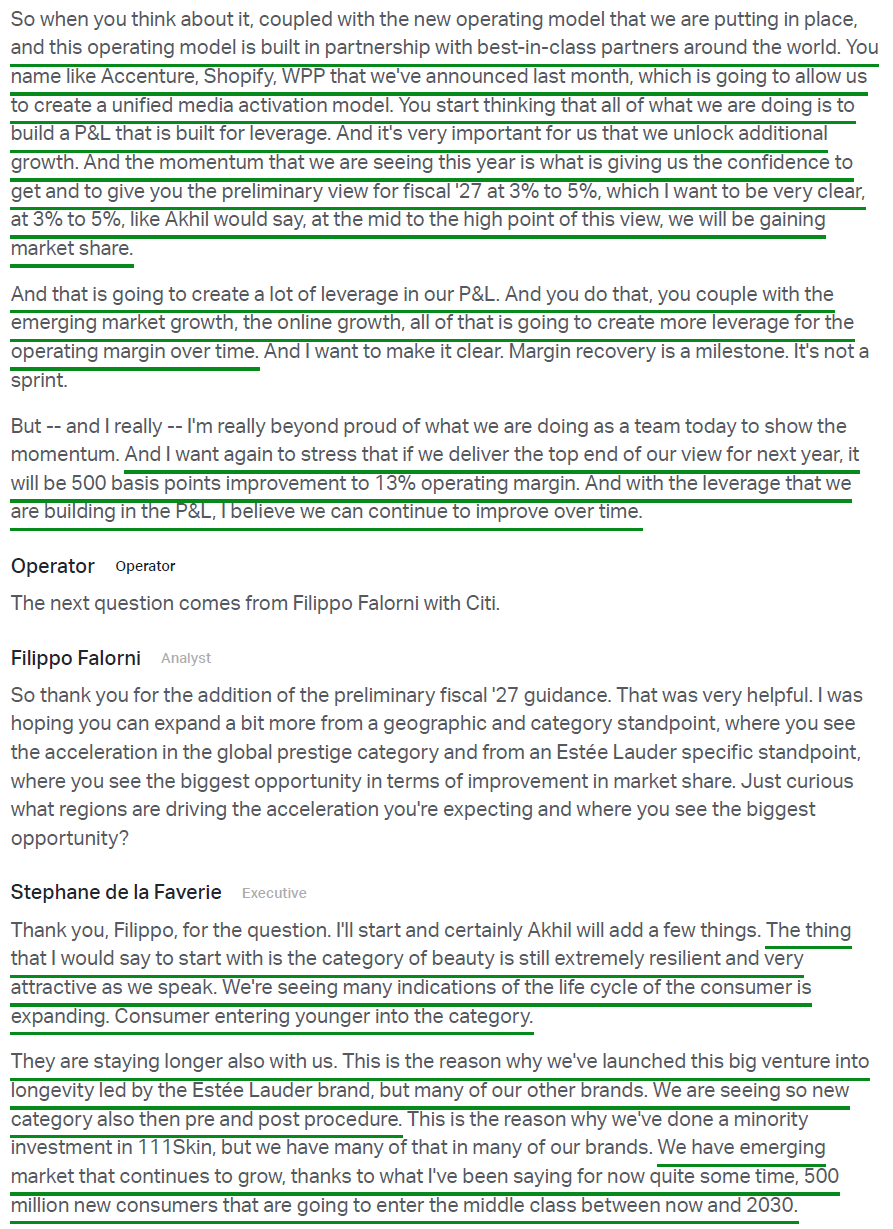
10) EL raised FY26 guidance across the board: organic growth narrowed to ~3% (high end of the prior 1–3% range), adjusted operating margin was lifted to 10.7–11.0% from a prior midpoint of 10% and now sits well above FY25’s 8%, while adjusted EPS was raised to $2.35–$2.45 (+56–62% Y/Y) versus consensus of ~$2.22 and prior guidance of $2.05–$2.25. More importantly, management provided its first preliminary FY27 view: organic growth accelerating to +3–5% (versus analyst consensus of ~3.7%), with prestige beauty share gains at the mid-to-high end, and adjusted operating margin of 12.5–13.0%. At the top end, FY27 would mark 500 bps of margin expansion since the launch of Beauty Reimagined, with management flagging significant runway beyond that, noting OpEx at ~62% still leaves room as the P&L is rebuilt for leverage.
Earnings Call Highlights
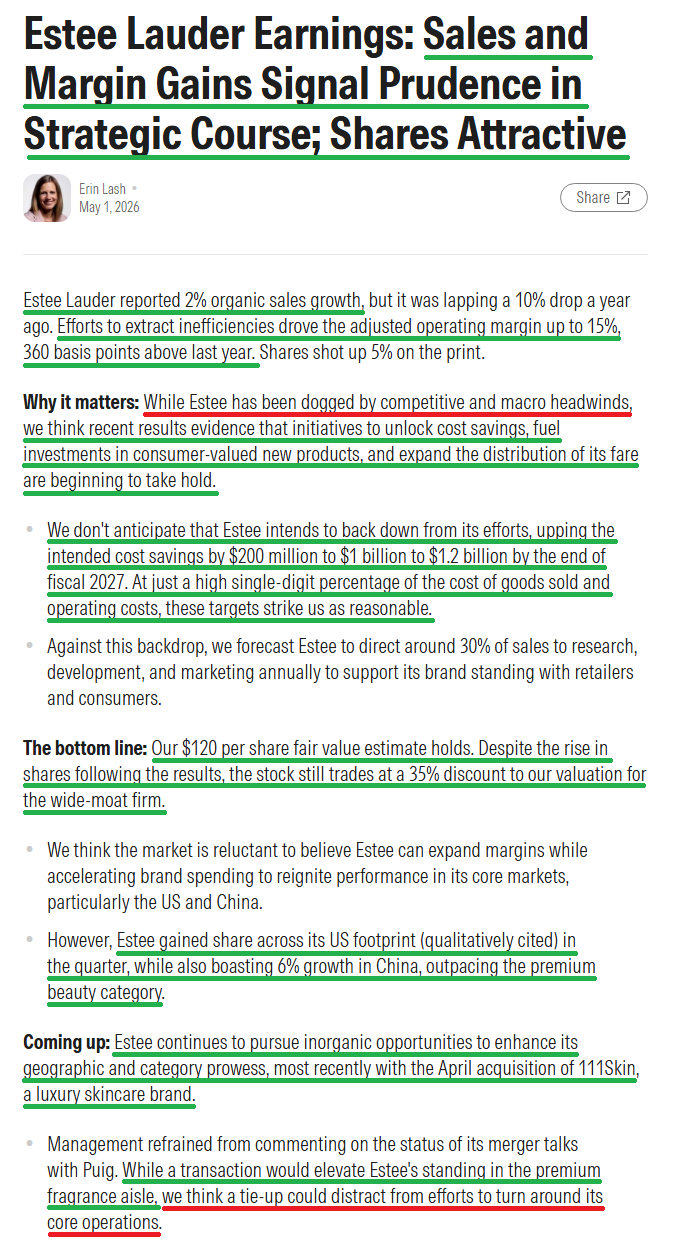
Morningstar Analyst Note
General Market
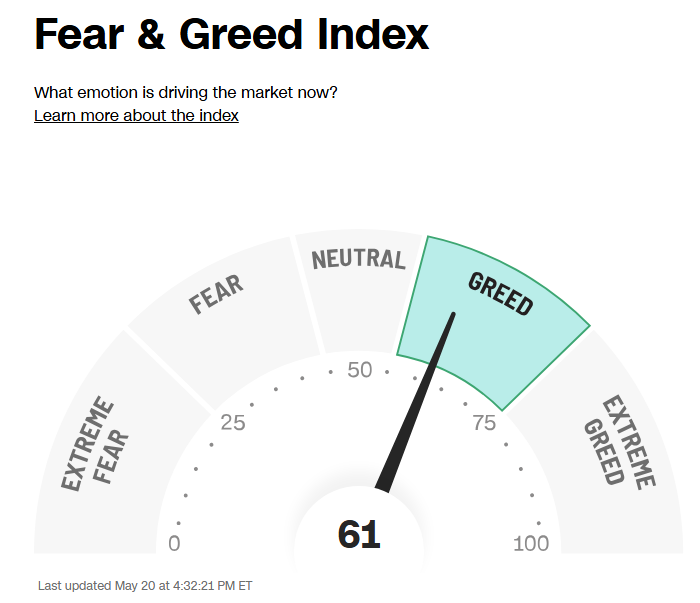
The CNN “Fear and Greed Index” ticked down to 61 this week from 64 last week. You can learn how this indicator is calculated and how it works here: (Video Explanation)
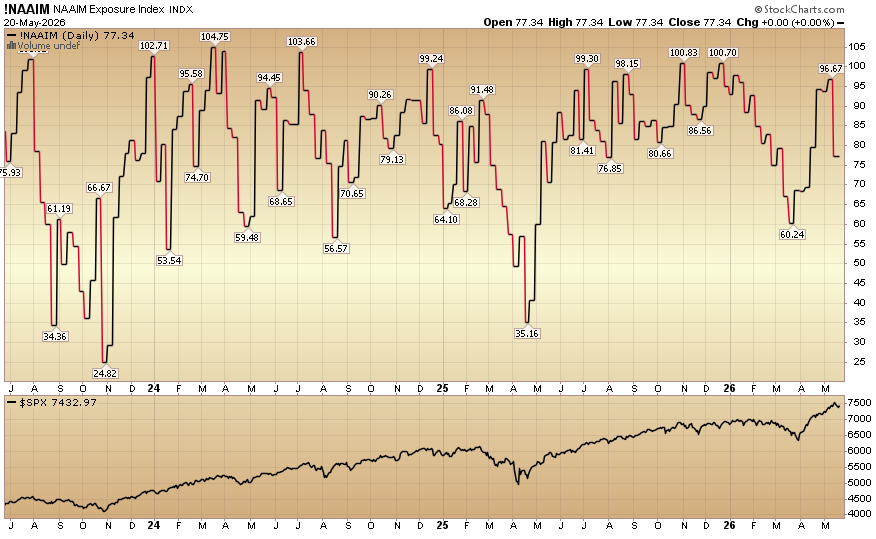
The NAAIM (National Association of Active Investment Managers Index) (Video Explanation) fell to 77.34% equity exposure this week from last week’s 96.67%.


Comments
Log in or sign up to join the conversation.