

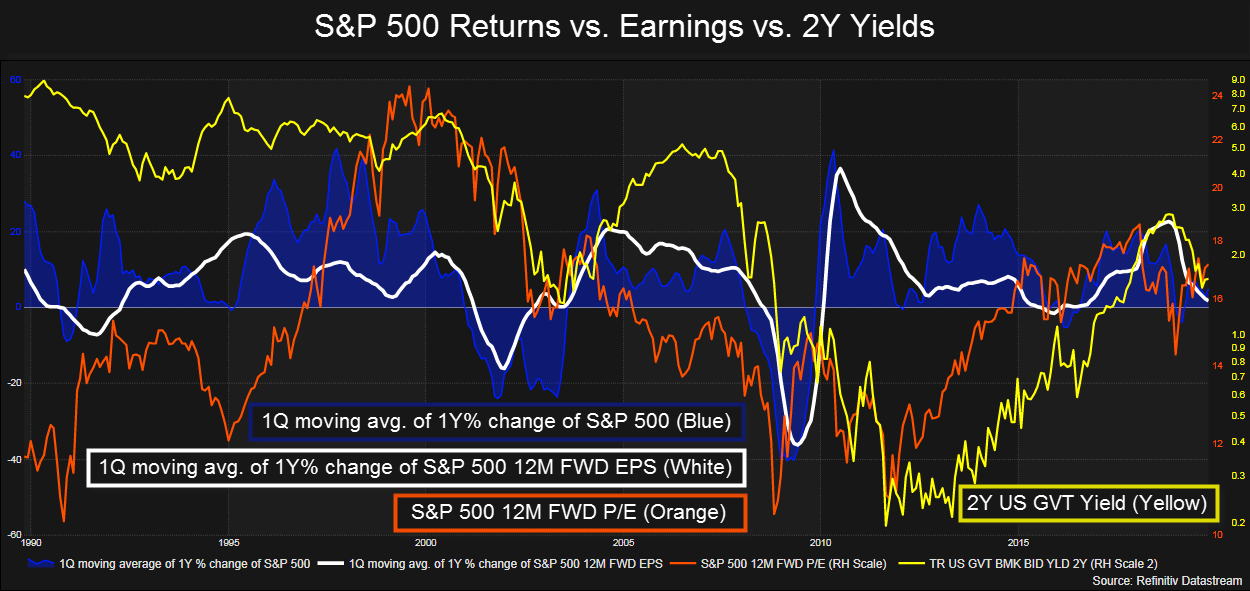
The S&P 500’s 12-month forward (12M FWD) P/E, shown in orange, tends to follow the U.S. 2 year treasury government benchmark yield (2Y), shown in yellow. However, since hitting 14.3 on Dec. 28, 2018, the FWD 12M P/E ratio has increased to 17.2 while the 2Y has come down to 1.64% from 2.54%. This is largely due to multiple expansion, which may be concerning for some, given that year-over-year (YoY) S&P 500 12M FWD EPS has flattened out.
Quarterly average YoY returns for the S&P 500, shown in blue, tend to trend in the direction of quarterly average YoY changes in S&P 500’s 12M FWD EPS, shown in white. Currently, the S&P 500’s 12M FWD EPS is 1.06% higher than a year ago. However, next year, analysts anticipate that the current 12M FWD EPS will increase by approximately 9.5%. This, along with market expectations for the latest Fed Funds Rate 25 basis point cut, along with the resultant lower yields on the 2Y, maybe what investors have built into their outlooks to support the multiple expansion.
(Click on image to enlarge)



Comments
Log in or sign up to join the conversation.