

Image Source: Pexels
The graph says it all.
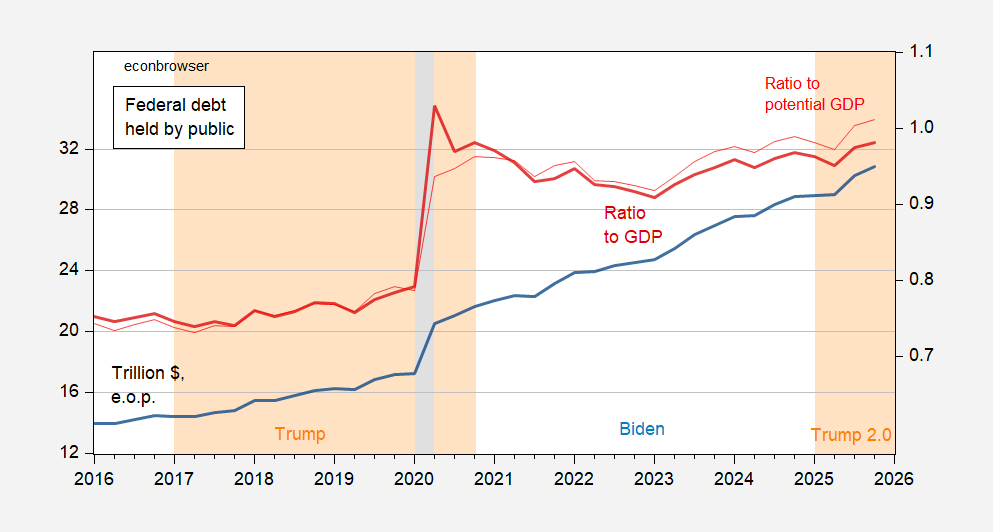
Figure 1: Federal debt held by the public, trn $, end-of-period (blue, left log scale), ratio to nominal GDP (red, right scale). 2025Q4 nominal GDP uses September CBO Economic Outlook projection growth rate. Source: FYGFDPUN from Treasury, BEA via FRED, Treasury, CBO and author’s calculations.
Total increase in debt 2017Q1-2020Q4: $7.3 trillion, 22.5 ppt of potential GDP
Total increase in debt 2025Q1-2025Q4 (only 3 quarters): $3.2 trillion, 3.1 ppt of potential GDP
Total increase in debt 2021Q1-2024Q4: $6.9 trillion, 2.8 ppt of potential GDP
More By This Author:
Accelerating Deterioration In Manufacturing Employment, Post-“Liberation Day”The Average Effective Tariff Rate Thru October
ADP Implied Private NFP, Philly Fed Early Benchmark, Etc.


Comments
Log in or sign up to join the conversation.