

There are four magic words that are the only way to make money in the financial markets.
Buy low, sell high.
Unfortunately, many investors especially those who are new in the market have a tendency to enter when markets are 'hot' and exit when they're not.
That said, there's been a lot of chatter lately about how institutional investors may be using this dip in crypto prices as an opportunity to buy in cheap. Of course, it would be very difficult to prove but this theory really rings true for me.
If Bitcoin was worth $20,000 in December how are so many analysts bearish at $3,700? Especially as there have been no fundamental changes to the landscape in that time.
The question then comes, if large players are accumulating, why are prices dropping?
For experts in the market, it's actually much easier than it might seem to be on the buy side without affecting prices. As I stated before, this is a buyers market. Here's a current example of a whale who is currently accumulating massive amounts of Basic Attention Tokens (BAT) on the down-low.
In any case, increased volumes over the last two weeks in the bitcoin future on the CBOE and CME exchanges suggest that the futures market on Wall Street are participating in the volatility.
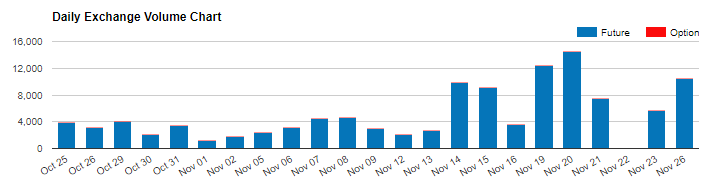
Still, the volumes in the futures contracts are still only a fraction of the market. However, on November 20th they peaked at 87,278 BTC, which is about 8% of the volumes recorded on the crypto exchanges.
All this really tells us is that they're trading more when prices are moving and we've seen that before. Whether they're secretly accumulating through OTC deals and using the futures to hedge remains to be seen.
Traditional Markets
Stock markets are up today and managing to stay afloat after yesterday's rally, despite some negative sentiment surrounding recent statements from Donald Trump. In an interview with the Wall Street Journal the US President, among other things, suggested that he could add a 10% tariff on iPhones coming from China and that the US consumer could bear it.
Trump is set to have a face to face meeting with Chinese President Xi Jinping at the G20 meetings this weekend. Though some are hopeful that we'll see some sort of agreement, the above-linked transcript makes this seem unlikely.
We are talking about Trump though and given how he likes to be unpredictable, we can never really be too sure.
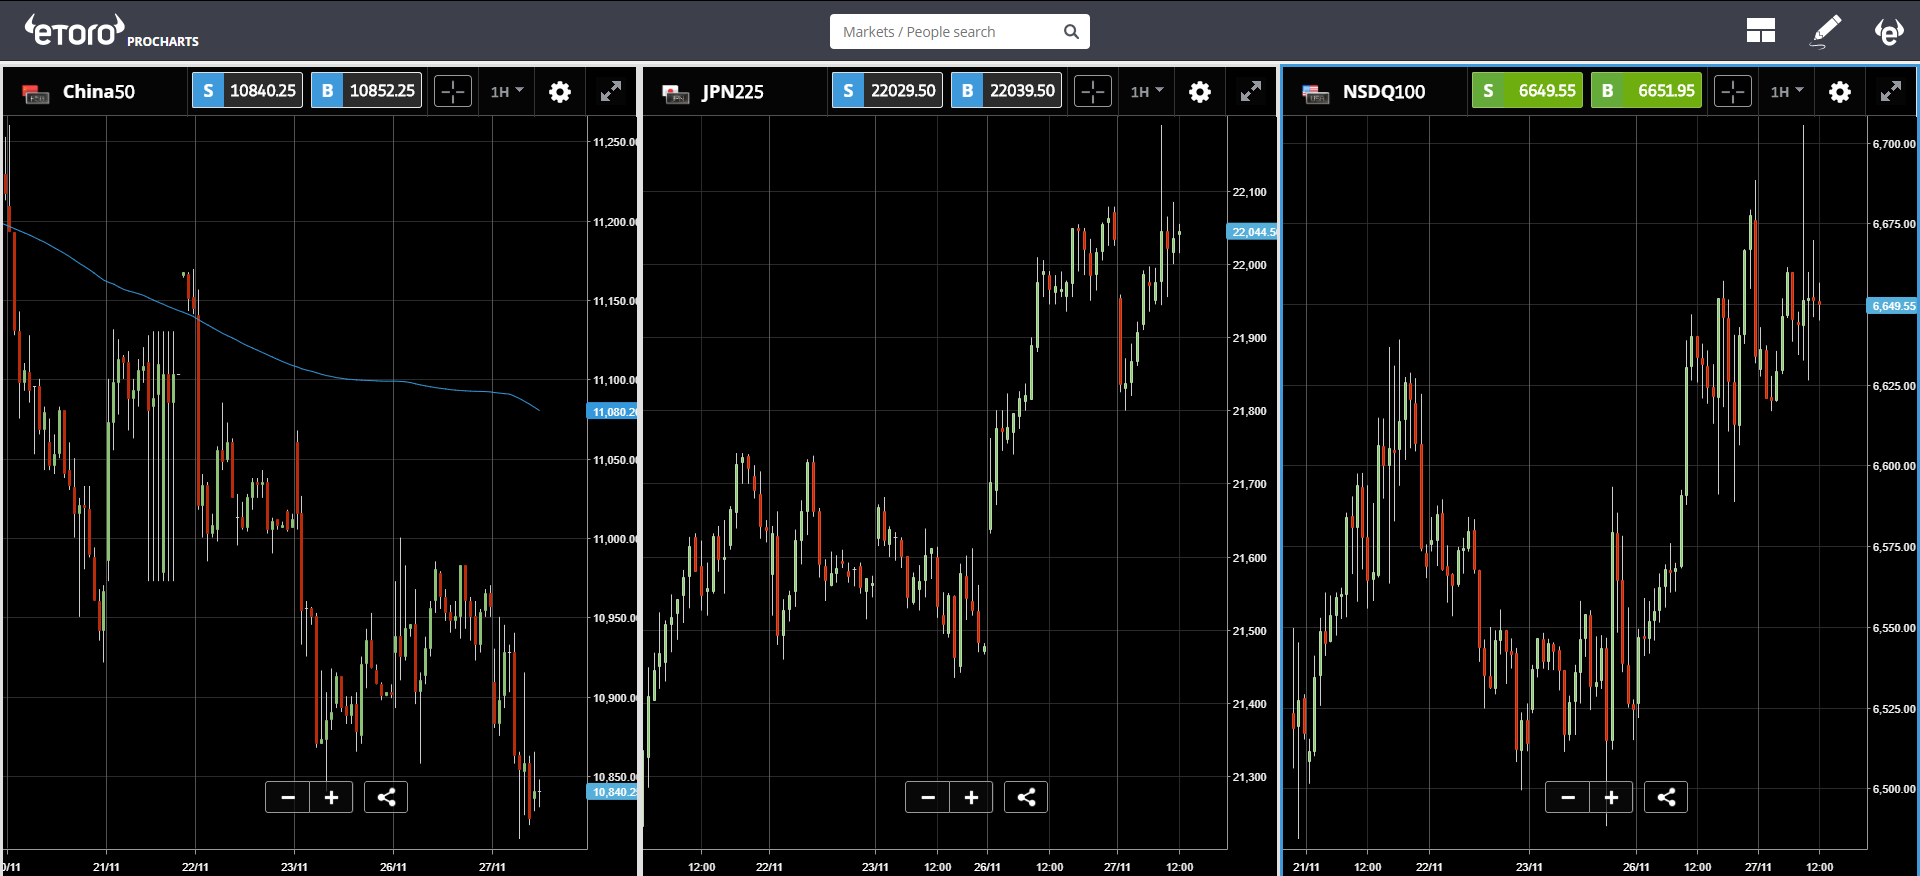
Shares in the China 50 are breaking new lows but markets in the rest of the world still seem largely optimistic.
Brexit Tour
Prime Minister Theresa May will be traveling around the UK in an attempt to garner support for her Brexit deal, which will be voted on in Parliament on December 11th, just two weeks from today.
The outlook seems grim and at this point, with many pundits wondering if she'll even be able to maintain her role as PM, let alone get a deal with the European Union passed through a hostile government.
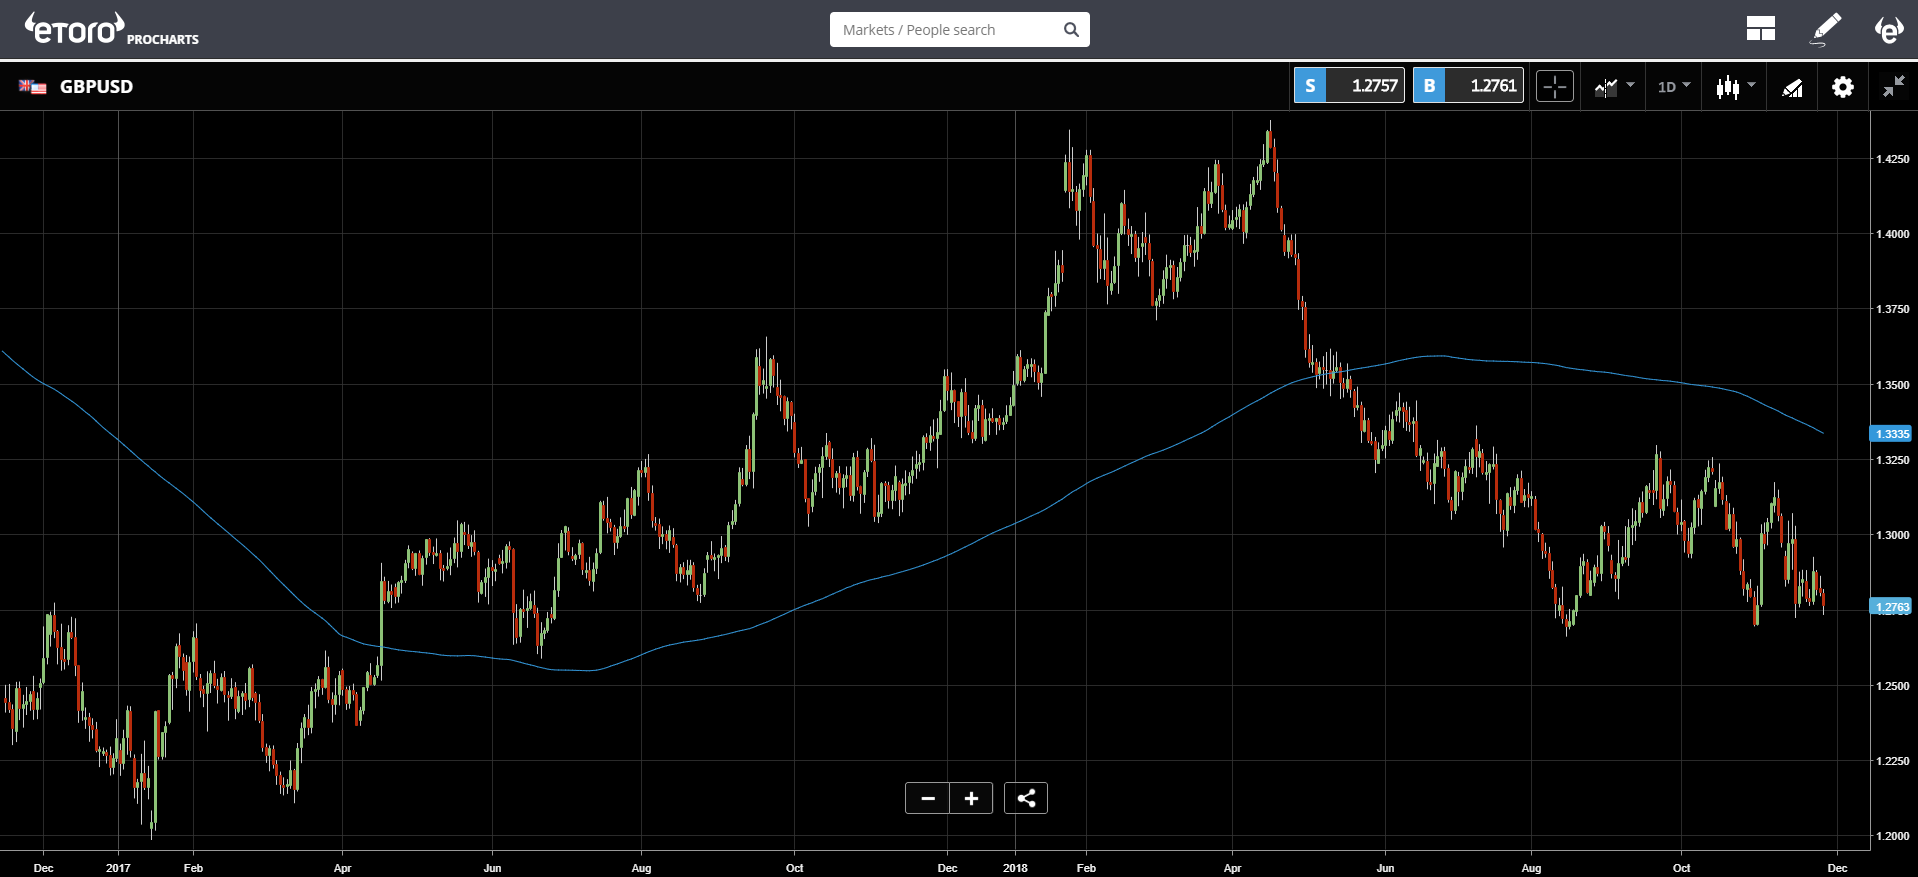
The Pound Sterling is looking quite low at the moment but the downside might be limited. At this point, many investors have already priced in the worst, so if things do start to deteriorate, it could go a bit lower. However, should the situation improve there's plenty of room to appreciate.
Watching the Crypto Prices
As with previous bitcoin cycles, the bearish period is a time when developers build up the infrastructure of the industry and beginners increase their knowledge base.
One of those areas that should not be taken for granted is technical analysis. The art of looking at price charts to understand patterns. Even though past performance is not an indication of future results, price history is still one useful method we have for analyzing many markets, including cryptos.
However lately, I've seen too many beginners taking things like trendlines and treating them as if they're a perfect indicator of what's about to happen. This is plain wrong.
For example, this log scale bitcoin graph has come up a few times in the last week.
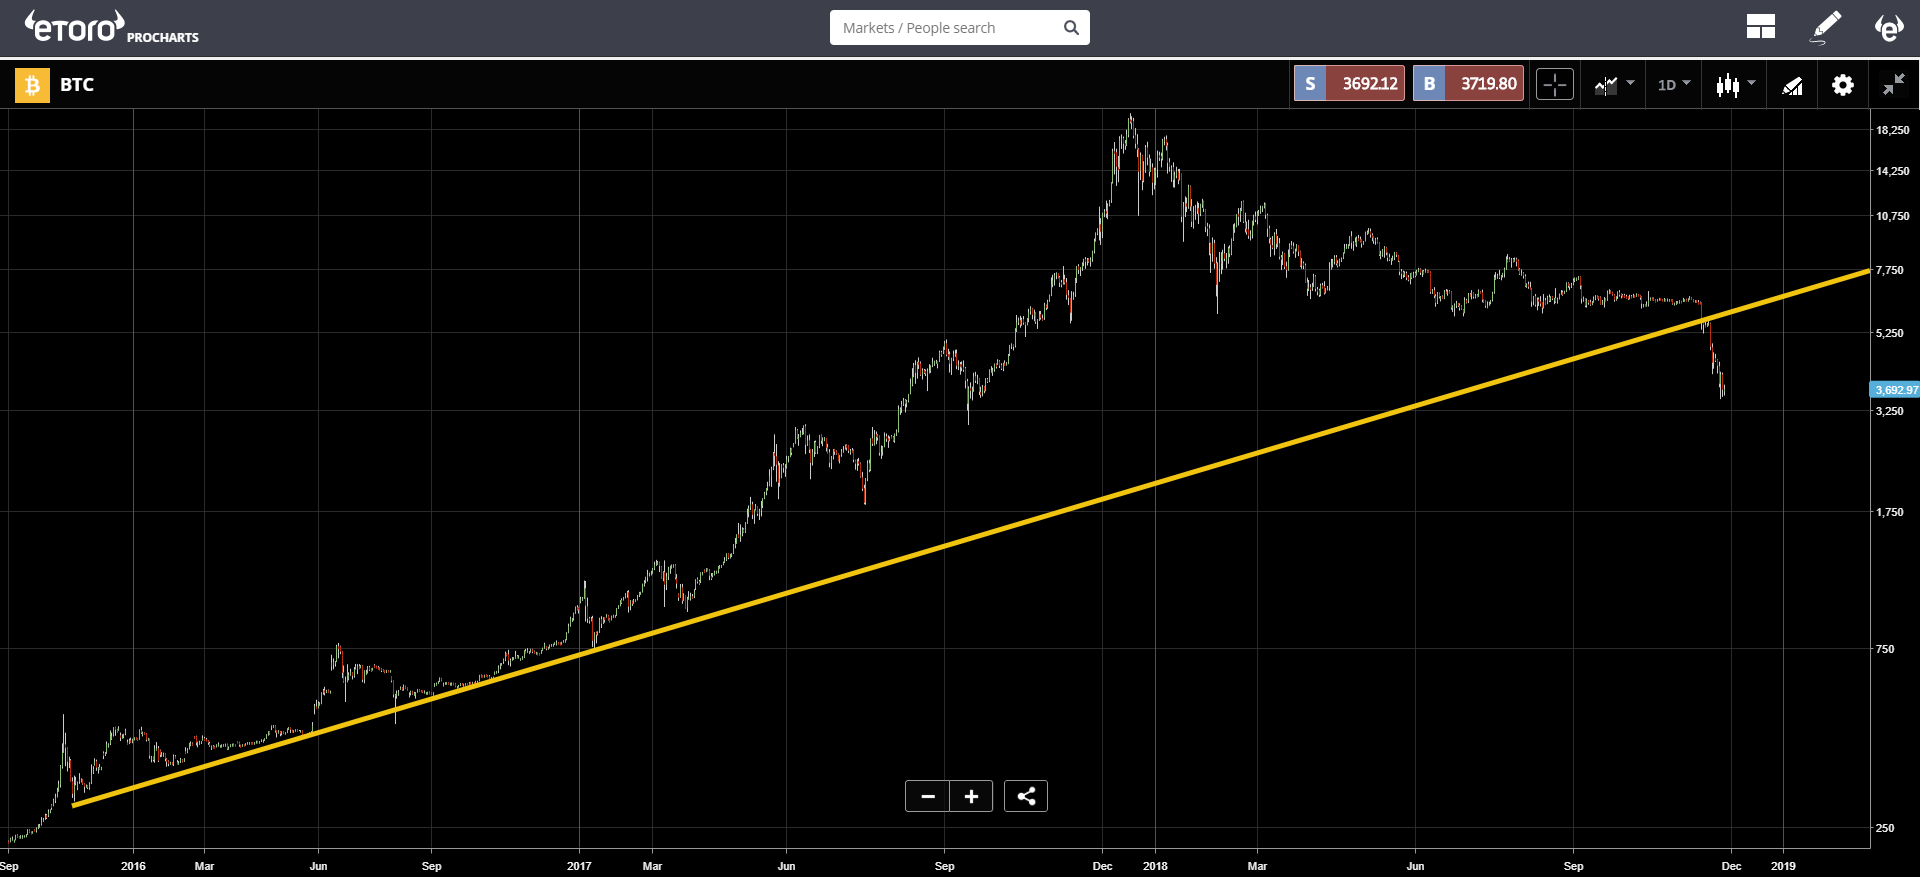
it does show a break below the long-term trendline, however, for those of you who are new at this stuff, a break below a trendline doesn't indicate that the trend is over.
Take this chart as a perfect example. Notice how in early October the US Dollar broke strongly above its downward trendline, only to continue downward and test that same trendline in January.
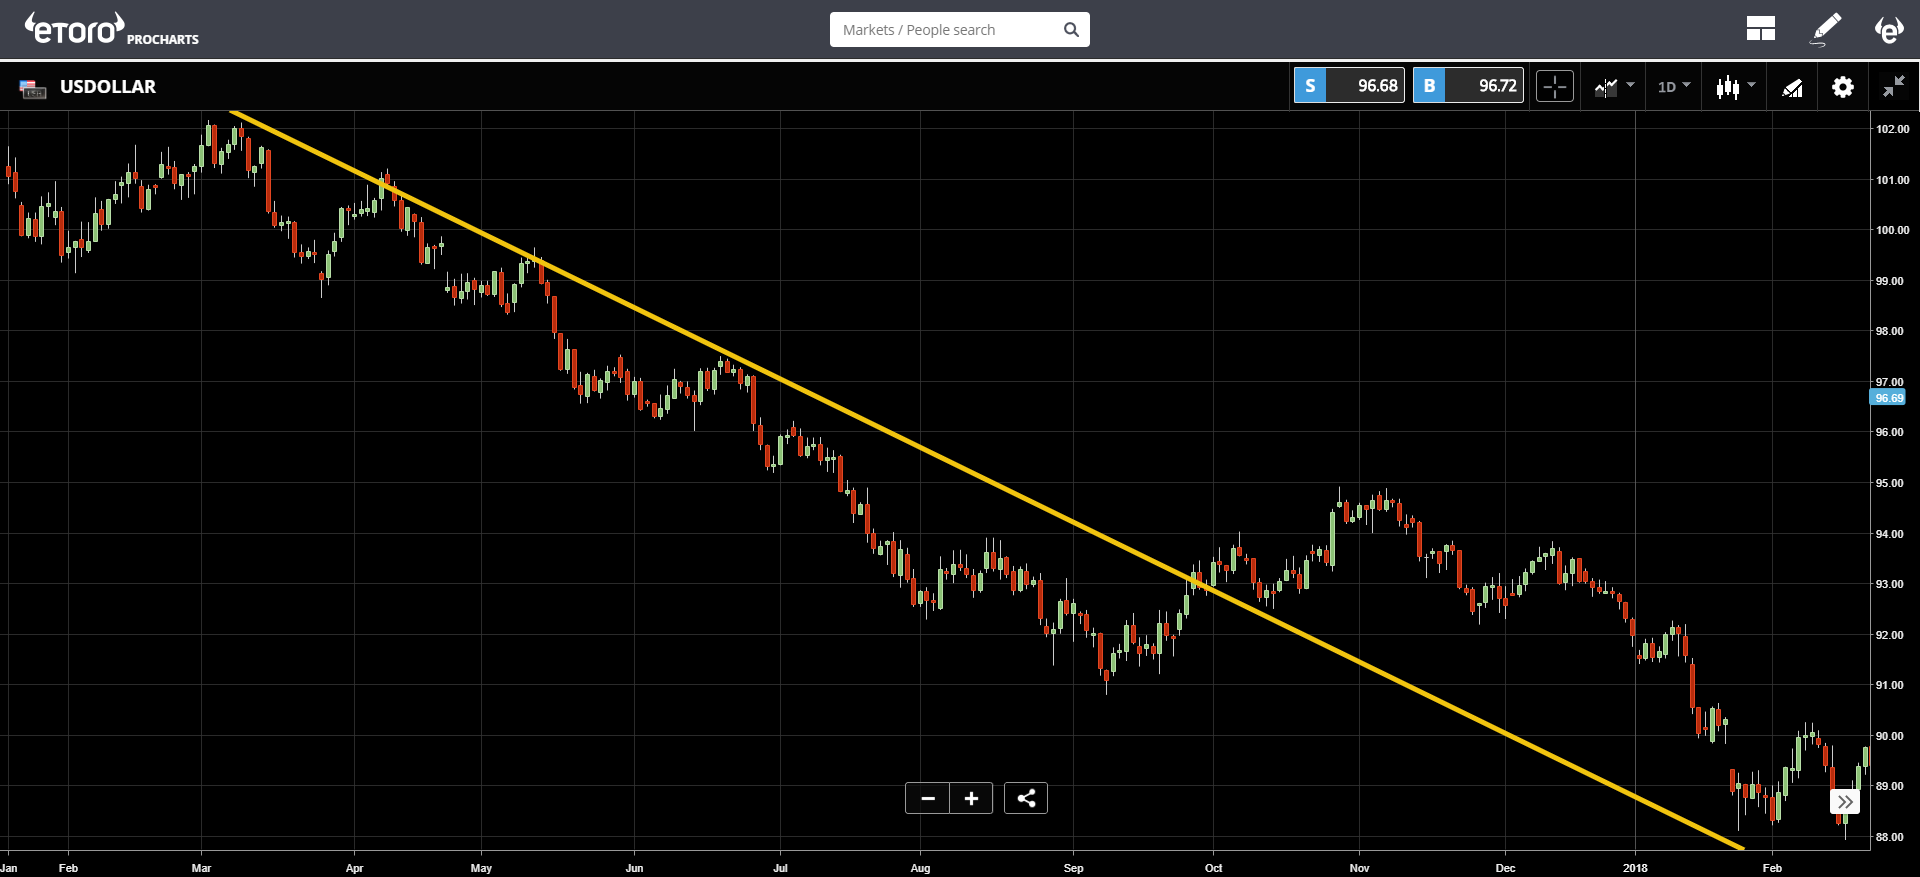
The key here is to take these type of things in stride and not to place too much weight on a single breakout or indicator.
For example when we say that the next area of support is between $3,000 to $3,500 it doesn't mean that this is the bottom and it also doesn't mean that the markets necessarily need to go that far down. It's just one indicator and should be seen in the context of a greater story that includes both technical and fundamental analysis.
Let's have an amazing day ahead!


Comments
Log in or sign up to join the conversation.