

Image Source: Unsplash
Here’s a picture of the key indicators followed by the NBER Business Cycle Dating Committee used in their business cycle chronology:
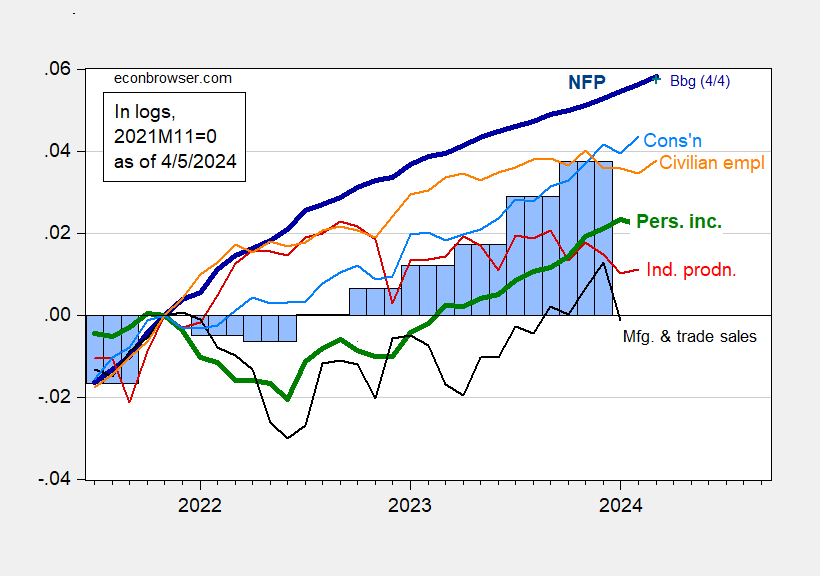
Figure 1: Nonfarm Payroll employment from CES (bold blue), from Philadelphia Fed early benchmark (teal), civilian employment (orange), industrial production (red), personal income excluding current transfers in Ch.2017$ (bold green), manufacturing and trade sales in Ch.2017$ (black), consumption in Ch.2017$ (light blue), and monthly GDP in Ch.2017$ (pink), GDP, 3rd release (blue bars), all log normalized to 2021M11=0. Source: BLS via FRED, Federal Reserve, BEA 2023Q4 2nd release, S&P Global Market Insights (nee Macroeconomic Advisers, IHS Markit) (3/1/2024 release), and author’s calculations.
We can be fairly sure that employment growth is positive. See alternative indicators in this post.
Here are some alternative indicators of economic activity.
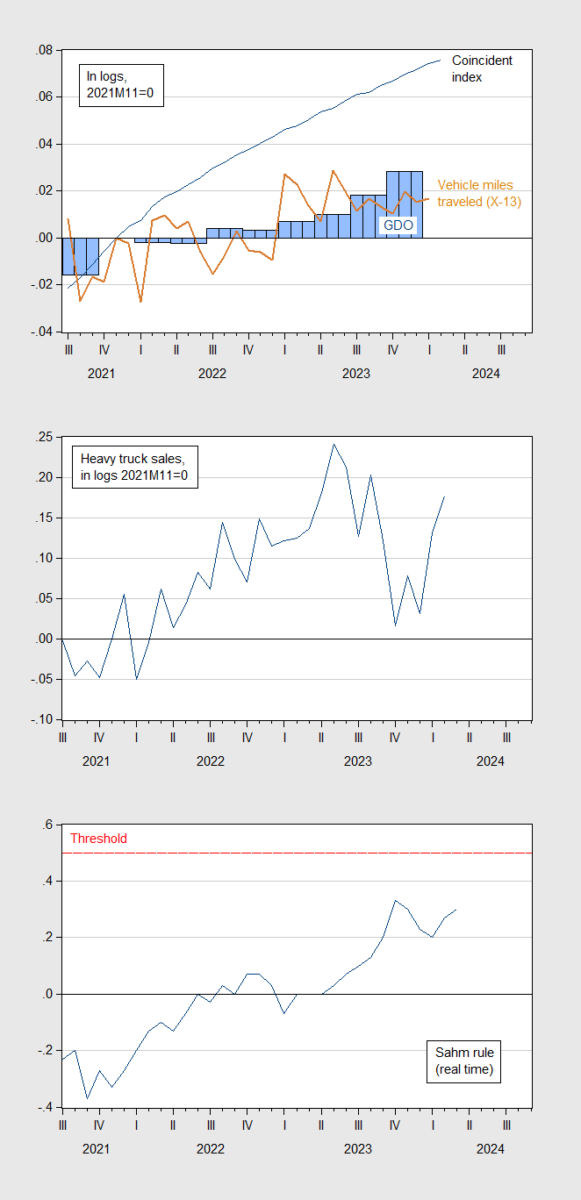
Figure 2: Top panel: GDO (blue bar), coincident index (blue line), and vehicle miles traveled seasonally adjusted by author using X-13 (tan line), all in logs, 2021M11=0; Middle panel: Heavy truck sales, SAAR, (blue line), all in in logs, 2021M11=0; Bottom panel: Real time Sahm rule (blue), and recession threshold (red dashed line). Source: BEA, Philadelphia Fed, NHTSA, Census, FRED, and author’s calculations.
None of the indicators clearly signal the onset of a recession, although vehicle miles traveled has flattened out, with y/y growth in January -0.8 %.
More By This Author:
March Employment Indicators for Nonfarm Payroll
A Really Very Long Series On The Real Rate
2023Q4 GDP Advances In All 50 States; Real Personal Income Declines In 5


Comments
Log in or sign up to join the conversation.