

Image source: Pixabay
The employment surprise in context.
(Click on image to enlarge)
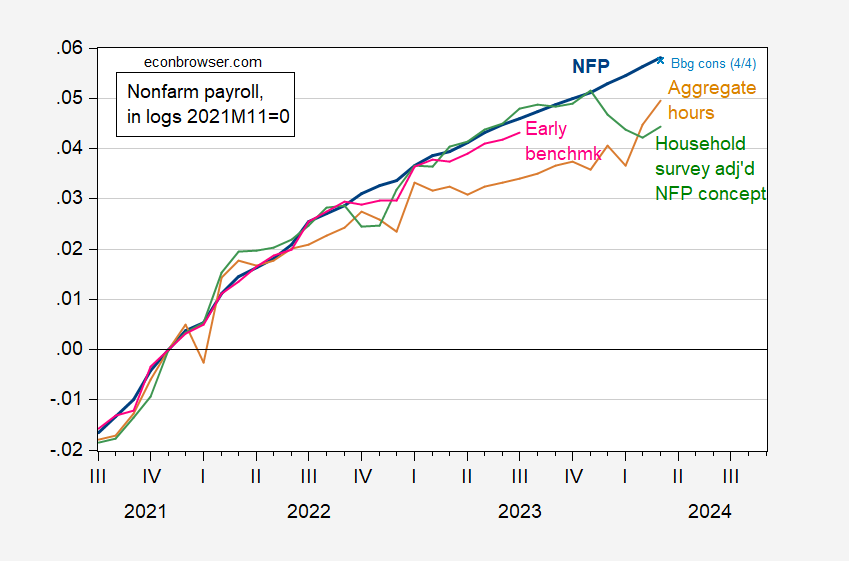
Figure 1: NFP (bold blue), Bloomberg consensus of 4/4 (light blue x), household series adjusted to NFP concept (green), Philadelphia Fed early benchmark (pink), aggregate weekly hours index of private production & nonsupervisory workers (tan), all in logs, 2011M11=0. Source: BLS via FRED, Philadelphia Fed, Bloomberg, and author’s calculations.
More By This Author:
A Really Very Long Series On The Real Rate2023Q4 GDP Advances In All 50 States; Real Personal Income Declines In 5
An Event Study: News And Trump Media And Technology Group, Monday, April 1


Comments
Log in or sign up to join the conversation.