

Image Source: Pexels
With the monthly GDP reported today, we have the following picture of the economy.
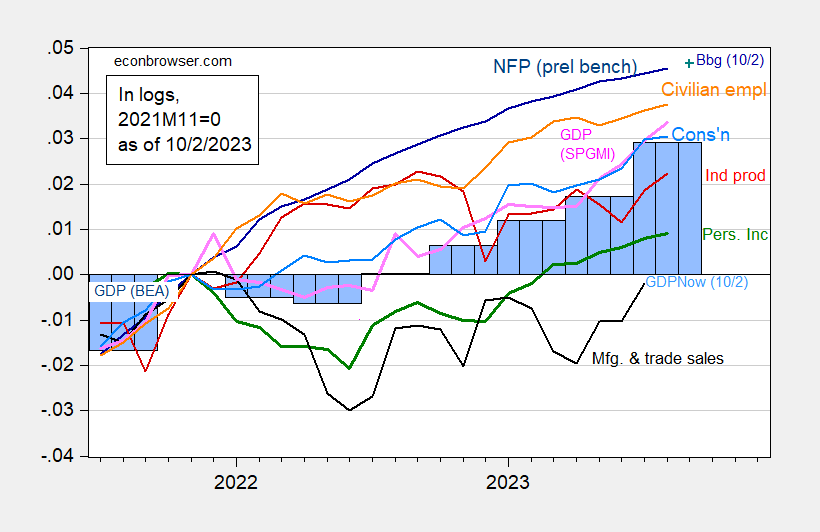
Figure 1: Nonfarm Payroll employment incorporating preliminary benchmark (dark blue), implied September NFP incorporating Bloomberg 10/2 consensus (blue +), civilian employment (orange), industrial production (red), personal income excluding transfers in Ch.2017$ (green), manufacturing and trade sales in Ch.2017$ (black), consumption in Ch.2017$ (light blue), and monthly GDP in Ch.2017$ (pink), GDP (blue bars), all log normalized to 2021M11=0. Source: BLS via FRED, BLS preliminary benchmark, Federal Reserve, BEA 2023Q2 second release via FRED, S&P Global/IHS Markit (nee Macroeconomic Advisers, IHS Markit) (10/2/2023 release), Atlanta Fed (10/2/2023 release), and author’s calculations.
Commentary from SPGMI:
Monthly GDP rose 0.4% in August following a 0.5% increase in July
(unrevised). The increase in August extended a run of robust monthly
gains that began in May. Over this four-month span, monthly GDP rose at an annual rate of 5.7%. The increase in August was fully accounted for by increases in net exports and nonfarm inventory investment; domestic final sales were essentially flat in August. The level of monthly GDP averaged over July and August was 4.6% above the second-quarter average at an annual rate. Implicit in our latest tracking estimate of 4.8% GDP growth in the third quarter is a slight (0.1%) decline in monthly GDP in September.
More By This Author:
GDP And Nowcasts: Continued Growth In Q3Business Cycle Indicators, Pre- And Post-Comprehensive Revision
Recession Forecasts With And Without Debt-Service Ratio


Comments
Log in or sign up to join the conversation.