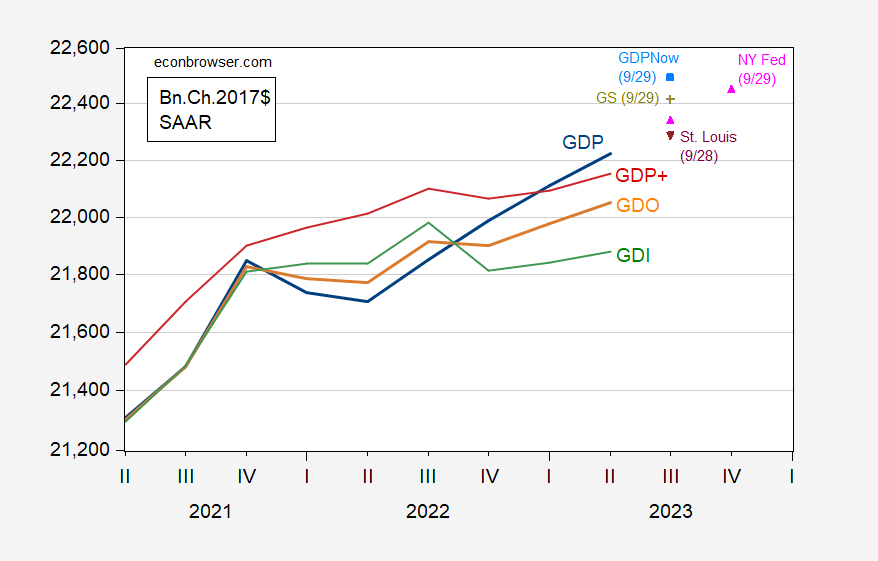
GDP And Nowcasts: Continued Growth In Q3

Image Source: Pixabay
As of today:
Figure 1: GDP (bold blue), GDI (green), GDO (orange), GDO+ (red), GDPNow of 9/29 (light blue square), NY Fed nowcast as of 9/29 (pink triangles), St. Louis Fed news index as of 9/28 (inverted purple triangle), Goldman Sachs tracking as of 9/29 (chartreuse +), all in bn. Chained 2012$ SAAR. GDP+ based on 2019 GDP level. Source: BEA 2023Q2 3rd release/comprehensive revision, Atlanta Fed, NY Fed, St.Louis Fed, Philadelphia Fed, Goldman Sachs, and author’s calculations.
GDP+ is now much closer to GDP than in the pre-revision data (see this post for comparison of levels pre- and post-comprehensive revision). All the nowcasts tabulated in Figure 1 indicate continued growth in Q3.
Lewis-Mertens-Stock Weekly Economic Index (NY Fed) is at 1.89% y/y growth, using data through 9/232. As late as week ending 5/13, it was as low as 0.74%.
More By This Author:
Business Cycle Indicators, Pre- And Post-Comprehensive RevisionRecession Forecasts With And Without Debt-Service Ratio
The Comprehensive Revisions: Little Change In Trajectory


