

Market Rally Gains Steam
Last week, we discussed that further upside would be challenging with the market hitting new highs. As noted:
“Not surprisingly, the market didn’t make much headway this past week, given the current extended and overbought conditions. For now, ‘buy signals’ remain intact, which likely limits the downside over the next week. However, a retest of the 50-dma is certainly not out of the question.”
This week, such was again much the same. The market did register new highs but only by a small fraction. What is important to note is that these incremental gains are burning through buying power. Such leaves the markets increasingly vulnerable to a correction, given the proper catalyst.
However, for now, with volatility very compressed, there seems to be little to worry about. Despite falling consumer confidence, strong inflation readings, and weaker economic growth, the “bulls” continue to push risk on expectation the “Fed has their back.”
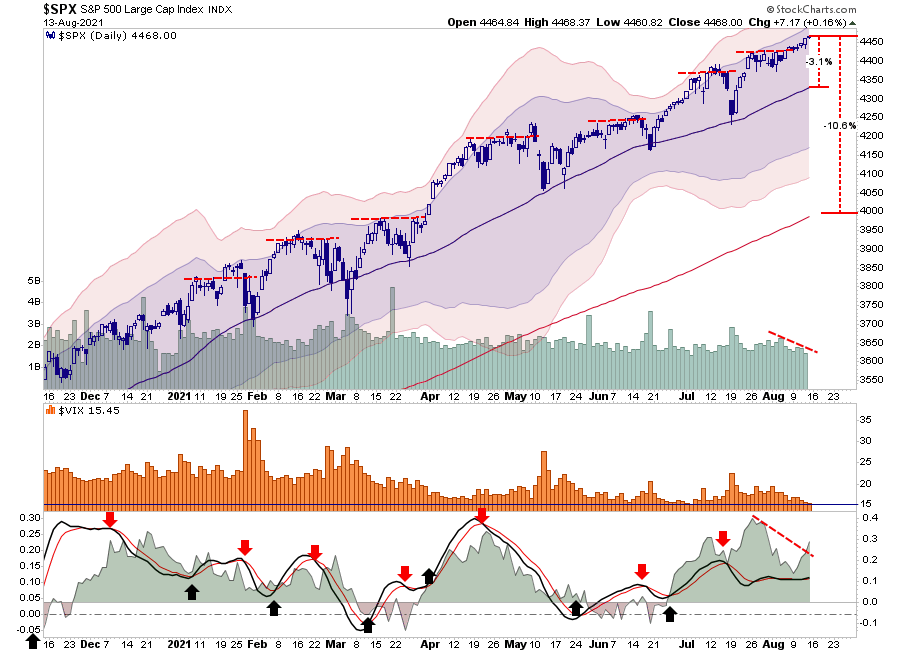
With volatility currently at the lows of its recent range, a pick-up in volatility would not be surprising. Over the last 6-months, corrections remain range-bound to the 50-dma which is currently 3% lower than closing levels.
However, as noted last week, a retest of the 200-dma should not be dismissed which is roughly 11% lower. While such a decline is well within the norms of a correction in any given market year, the low levels of volatility will make it “feel” worse than it is.
While the data currently suggests risks are somewhat mitigated momentarily, such does not mean it should be ignored. It is this view that drives our current view on portfolio positioning which we discuss below.
A Note On Inflation
This past week we saw the latest CPI print, which showed a modest drop in the annual rate of change in the index. Notably, while inflation weakened slightly, it is still running well above the pre-covid trend and well above the Fed’s inflation target of 2%.
As Michael Lebowitz noted for our RIAPRO Subscribers (Try Risk-Free For 30-Days):
“The graphs and tables below, breaking down 153 of the components of inflation, provide a broader analysis of Wednesday’s July CPI data as compared to June.
At the headline level, monthly CPI fell to 0.5% from 0.9%. The average price of the 153 goods comprising CPI fell from 0.63% to 0.42%. However, the median price rose by 0.20% to 0.50%. Further, in June nearly 70% of the goods saw percentage price increases less than the CPI rate. In July that number fell to just under 50%.
Also note, the average and median increases in the year-over-year changes rose significantly from June to July. The headline CPI number is supportive of those in the transitory inflation camp, but the underlying data is not as clear. Yesterday’s PPI data provides further concern that inflation may not have peaked yet.”
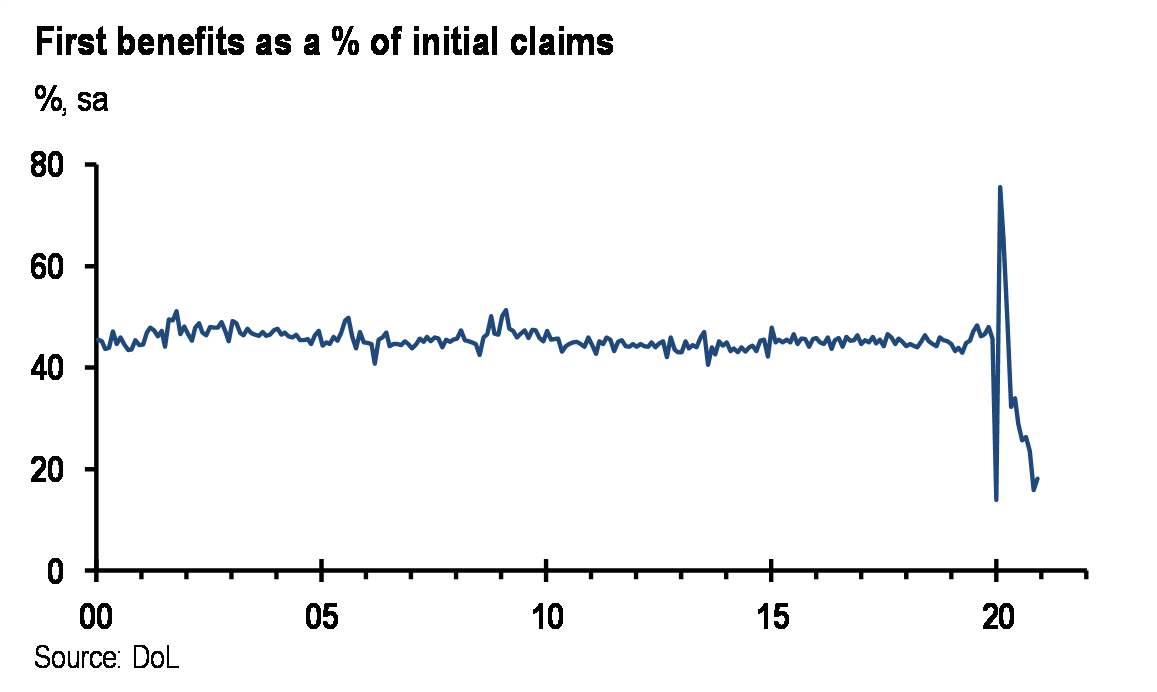
Between inflation, pressure from Congress, and robust employment reports, the Fed is getting pushed towards tapering current monetary policy. With numerous Fed speakers eluding to needing to taper and raise rates sooner than expected, we suspect Powell could make comments as early as the end of the month.
The Fed’s monetary accommodation continues as the primary market support. Therefore, it is worth noting a potential reversal.
Market Internals Continue To Deteriorate
As noted, the market rallied nicely to marginal new highs this past week, but market internals remains relatively weak. Moreover, money flows continue to slow.

Notably, despite a market trading at all-time highs, the number of stocks trading above the 50-dma is feeble.
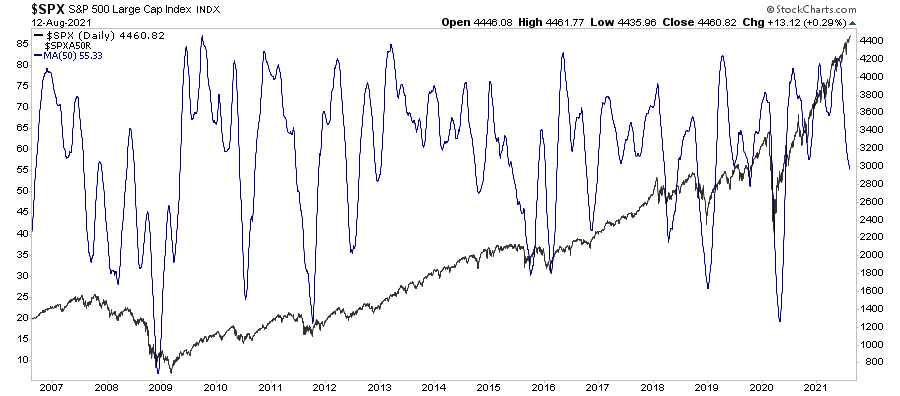
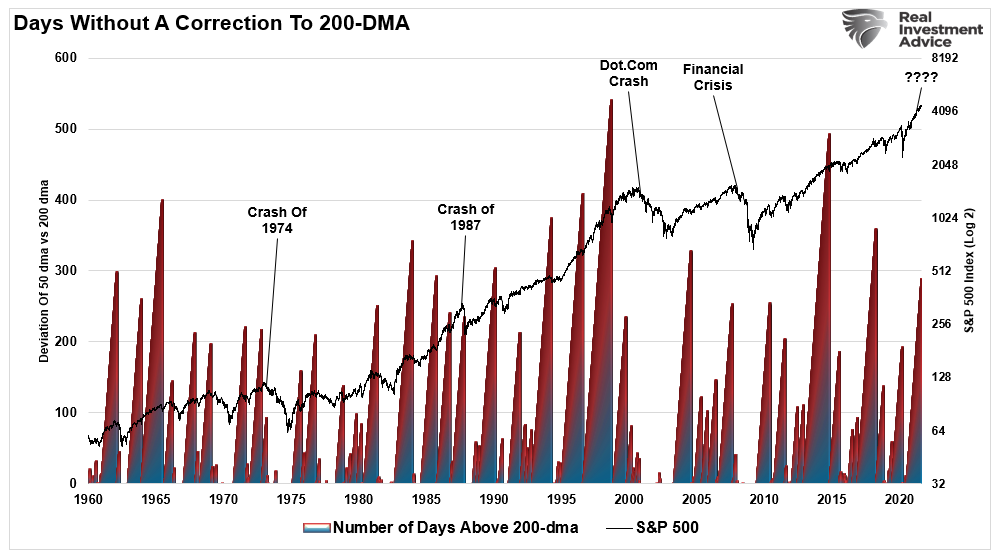
Furthermore, deviations from long-term moving averages continue to get more extreme. As noted this past week, the deviation from the 200-dma poses a credible threat in terms of magnitude and duration.
“’If the SPX stays above its 200-day, 2021 would mark the 14th year it did so since 1929.‘
In other words, it is possible the S&P could remain above the 200-dma for the rest of the year. The visualization of such deviations suggests an elevated risk it won’t.
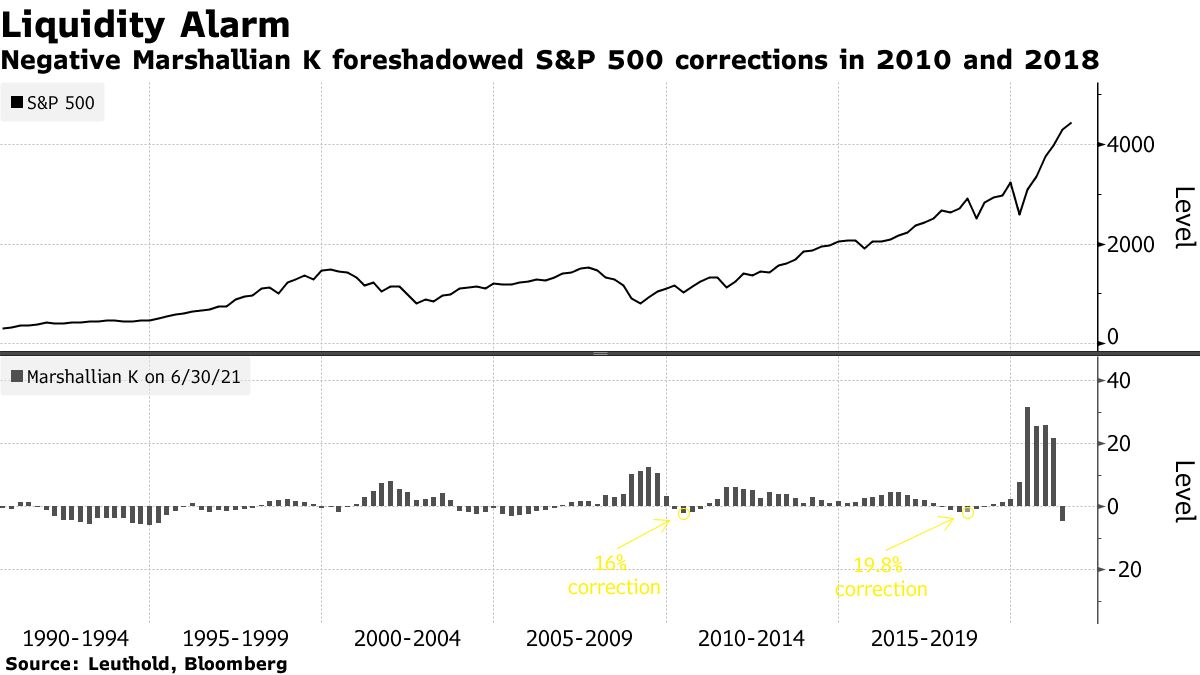
Furthermore, as noted by Bloomberg, liquidity is evaporating from the market even as investors continue to chase stocks higher. To wit:
“‘Put another way, the recovering economy is now drinking from a punch bowl that the stock market once had all to itself,’ Doug Ramsey, Leuthold Group’s chief investment officer, wrote in a note last week.
How big a threat is this? While stocks kept rising during frequent negative Marshallian K readings in the 1990s, the pattern since the 2008 global financial crisis, a period when the central bank was in what Ramsey calls a ‘perpetual crisis mode,’ begs for caution.”
Nonetheless, bullish sentiment remains robust, with investor allocations remaining at record highs. Moreover, the market seems to think all of these issues are only temporary anomalies.
But such is the result of more than a decade of monetary interventions that have left investors with very few choices.


Comments
Log in or sign up to join the conversation.