

Consumer spending accounts for nearly 70% of US GDP, so the consumer sector is a critical driver for both the economy in general and the stock market in particular. Importantly, the consumer discretionary and consumer staples sector are two very different segments of the consumer space, and they have dissimilar implications for the markets.
By watching the relative performance of the Consumer Discretionary Select Sector SPDR ETF (XLY) versus the Consumer Staples Select Sector SPDR ETF (XLP), we can gain some valuable insights about the main economic trends and the changes in investor risk appetite over time.
Consumer Discretionary And Consumer Staples
When discussing the consumer sector, the distinction between consumer discretionary and consumer staples is of utmost importance, because the two consumer sectors have different implications for the economy.
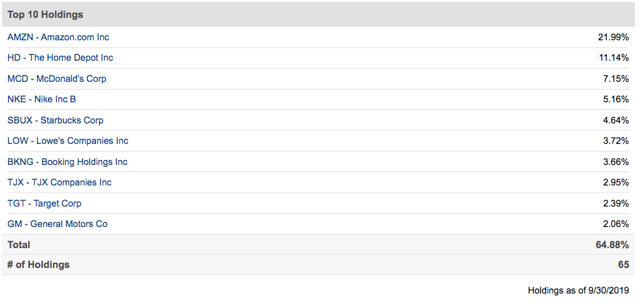
Discretionary products and services are considered non-essential, but desirable when consumers have enough extra money to pay for them. This includes restaurants, apparel, entertainment, and automobiles, among others.
For illustrative purposes, the table below shows the top 10 holdings in XLY.
Source: Seeking Alpha
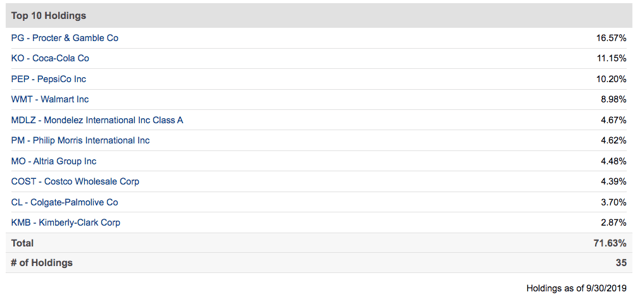
In stark contrast, the consumer staples sector is mostly focused on essential items, such as food, beverages, tobacco, and household products. Most people are unable or unwilling to reduce spending on consumer staples sectors, even under tough economic conditions.
Looking at the top 10 holdings in XLP, it's easy to see how the two ETFs are very different in their composition.
Source: Seeking Alpha
In simple terms, the consumer discretionary sector is far more cyclical and depending on economic activity, while the consumer staples sector is more defensive and stable. Besides, companies in the consumer staples sector tend to pay higher dividend yields, so they benefit more when the economy is slowing down and interest rates are declining, because their dividend yields become more attractive in comparison to fixed-income yields.
When risk appetite is rising and investors expect the economy to remain strong, chances are that the consumer discretionary sector will deliver bigger gains than the consumer staples sector. Conversely, when investors are getting pessimistic and risk appetite is declining, markets tend to gravitate towards consumer staples stocks.
Reading The Consumer
The following quantitative system basically reads the signals from the consumer discretionary and consumer staples sectors in order to make decisions in the stock market based on how risk appetite is evolving. The main idea is having a data-driven tool to measure how risk appetite is being reflected in different consumer sectors and manage risk exposure accordingly.
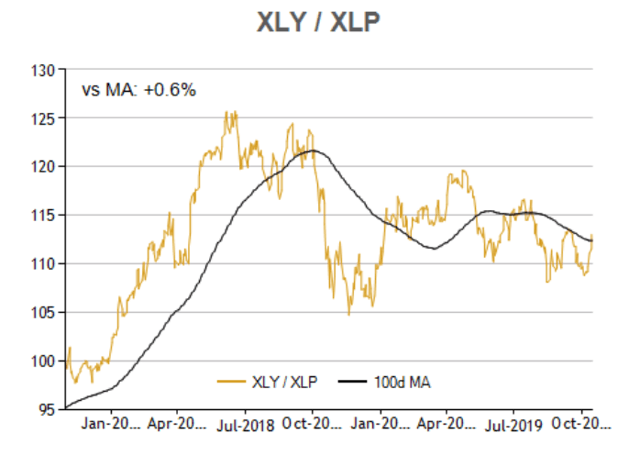
The system is based on a ratio that measures the relative performance of XLY versus XLP.
When this ratio is rising, it means that consumer discretionary stocks are outperforming consumer staples stocks, so risk appetite is increasing among market participants. Conversely, when the ratio is declining, this means that money is flowing away from risky stocks and towards safer alternatives in the consumer staples space.
Source: ETFreplay
When the consumers versus staples ratio is above the 100-day moving average, meaning that risk appetite is rising, the system is invested in the Invesco QQQ ETF (QQQ). Conversely, when the ratio is below the 100-day moving average, the system buys the iShares 20+ Year Treasury Bond ETF (TLT) for portfolio protection.
The main logic behind the strategy is actually quite simple: When the consumer sector is sending a risk-on signal, the strategy is allocated to stocks with above-average risk levels. Alternatively, when the consumer sector is sending a risk-off signal, the strategy runs for safety by investing in long-term Treasury bonds via TLT.
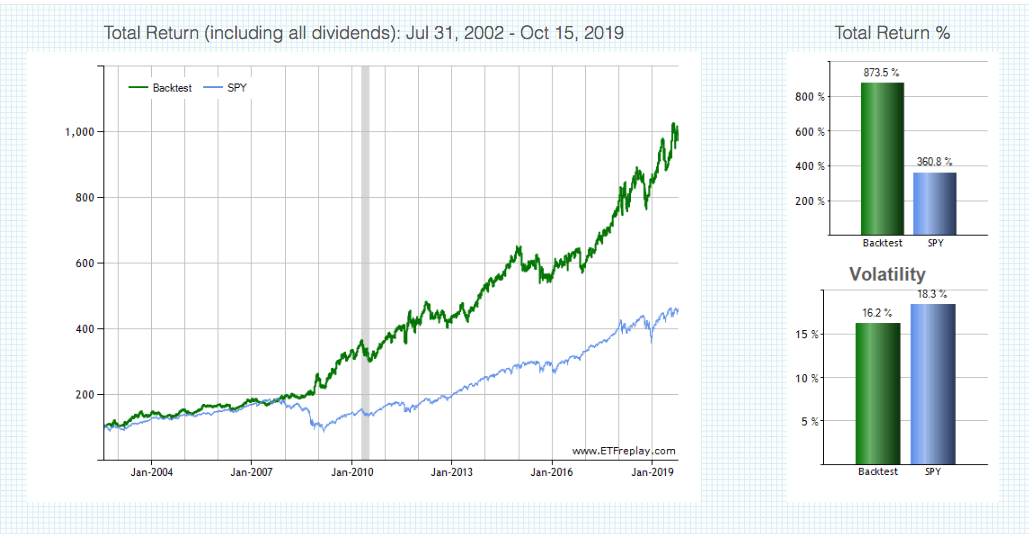
The chart shows the backtested performance statistics for the quantitative strategy versus a buy-and-hold position in the SPDR S&P 500 Trust ETF (SPY). Not only has the strategy produced superior returns, but also much smaller drawdowns.
(Click on image to enlarge)
Source: ETFreplay

Source: ETFreplay
The backtesting starts on July 31, 2002, because that is the first full month in which all of the ETFs are available for trading. Since then, the quantitative strategy has gained 873.5%, more than double the 360.8% produced by a buy-and-hold position in SPY.
More importantly, the quantitative strategy has a maximum drawdown - meaning maximum capital loss over the period - of 17.9% versus a much larger drawdown of 55.2% SPY over the backtesting period.
In other words, the strategy is not only effective in terms of increasing returns, but the main benefit is that it does a great job in terms of risk reduction.
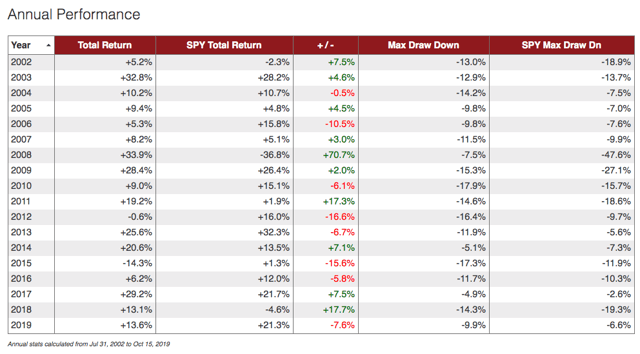
If we look at the annual performance statistics, we can see that the quantitative strategy is far from perfect or infallible. In 2015, for example, the strategy had a particularly rough year, since it had some false signals in the first quarter of the year, rotating in and out of stocks at the wrong time.
Source: ETFreplay
This is arguably the main disadvantage of this kind of strategy based on price trends. When risk appetite is moving sideways and changing abruptly, the strategy will generate lots of false signals and, ultimately, disappointing returns.
On the other hand, a strategy such as this one can make a huge difference in a deep bear market such as 2008. While SPY lost 36.8%, the quantitative strategy actually gained 33.9% during the financial crisis in 2008 by protecting the portfolio in February 2007.
In other words, the strategy tends to do well either when risky assets are booming or when risky assets are crashing, and the fact that it does not care about the direction of the market is a big advantage. However, performance tends to suffer when the market trends are weak and unstable.
Looking At The Data
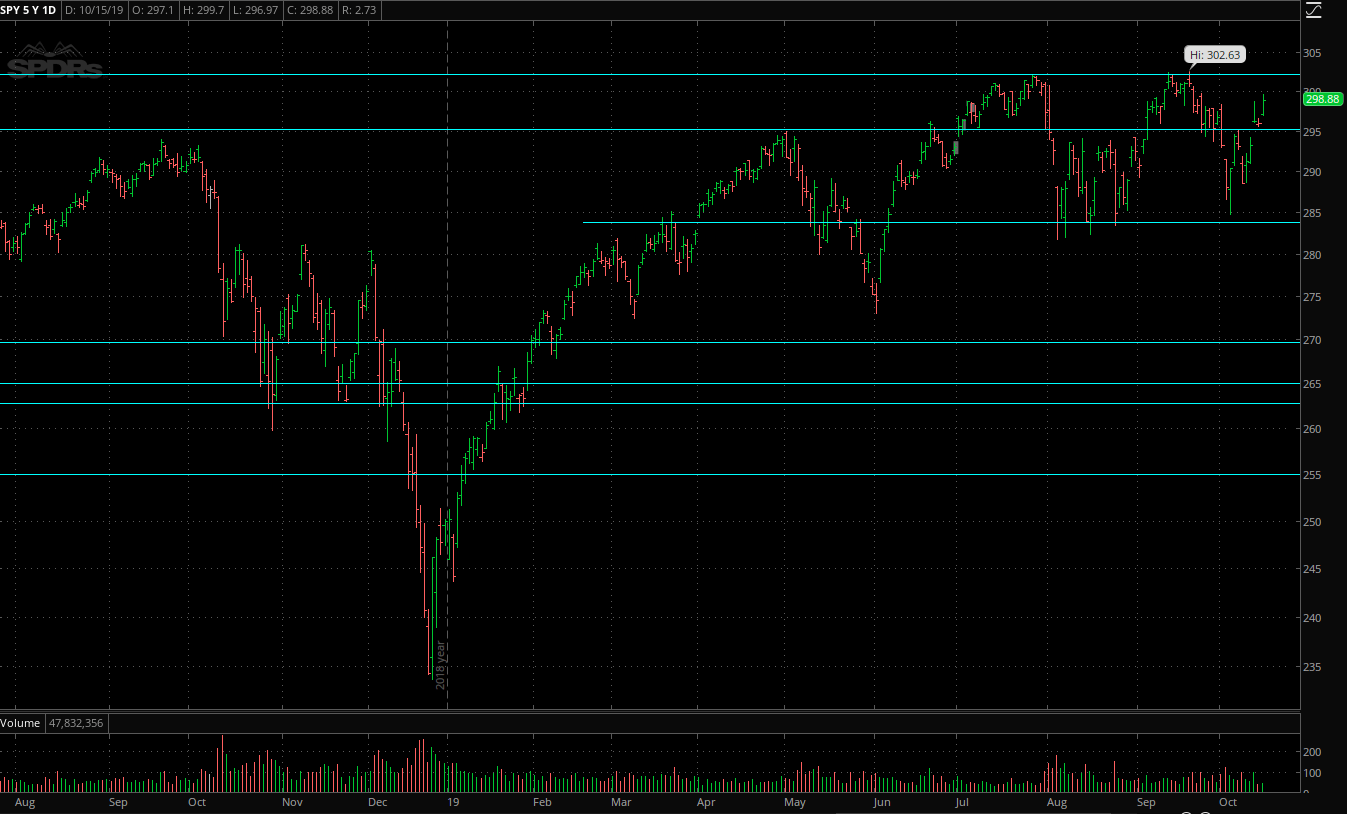
The past several months have been quite particular in the market, with some key market benchmarks approaching critical levels. SPY is once again reaching the $300 level, a key price zone that has provided resistance in the past.
(Click on image to enlarge)
Source: Thinkorswim
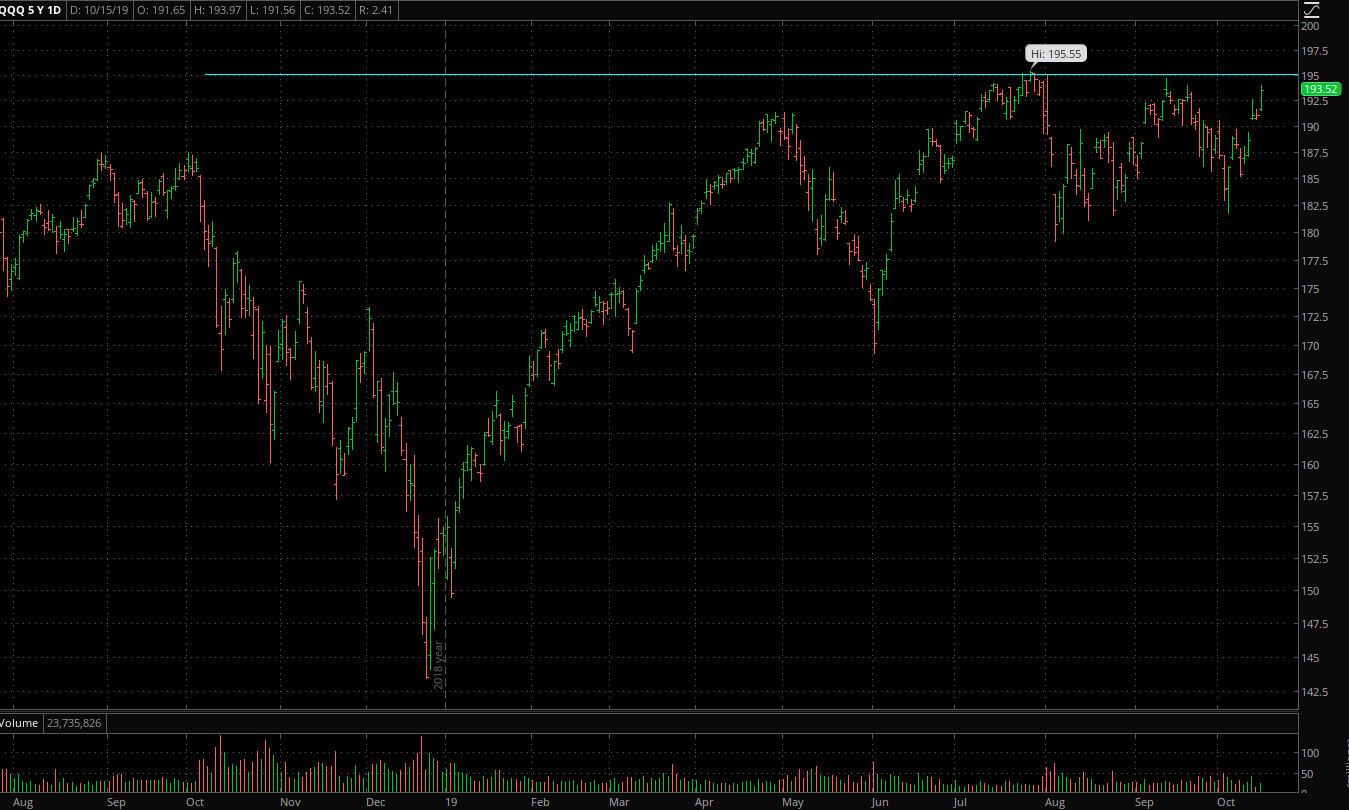
QQQ is also facing a crucial level in the area around $195 per share.
(Click on image to enlarge)
Source: Thinkorswim
Since markets have failed at these levels in recent months, investors have reasons to wonder if this time we are going to get a successful breakout to new highs or just another failed attempt. We can never know for sure, but we can take a look at the evidence from different sources in order to assess the probabilities of different outcomes. The fact that the consumer discretionary to the consumer staples sector has turned a risk-on signal is a bullish data point to consider.
Source: ETFreplay
This is just one piece of a big puzzle, and whatever happens to risky assets in the future will depend on a multiplicity of variables, both related to the economic fundamentals and to investor sentiment.
That said, an investment approach supported by hard data evidence is clearly superior to one based on opinions and subjectivities. The consumer discretionary versus consumer staples ratio is currently sending a bullish signal for stocks, and this is a relevant piece of evidence that deserves to be acknowledged.



Comments
Log in or sign up to join the conversation.