

SPX Monitoring purposes; Long SPX on 4/8/26 at 6782.81.
Our gain 1/1/24 to 12/31/24 = 29.28%; SPX gain 23.67%
Our Gain 1/1/23 to 12/31/23 SPX= 28.12%; SPX gain 23.38%
Monitoring purposes GOLD: Long GDX at 75.76; 9/29/25
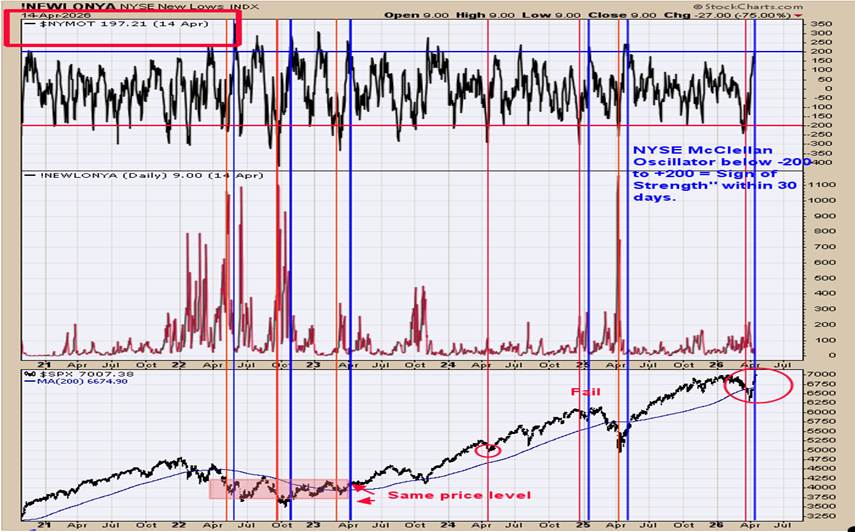
The bottom window is the SPX going back to 2021, the top window is the NYSE McClellan Oscillator. A bullish intermediate-term signal for the market is generated when the NYSE McClellan Oscillator reaches below -200 (selling climax) and then rallies to +200 (sign of Strength) in 30 days or less. We noted the times when the Oscillator reached below -200 with the red line and the blue lines when it reached above +200, all within 30 days. Notice that at the 2022 low, there were three signals all near the same price levels. On March 20, the Oscillator reached -234, and yesterday's close came in at +197.21. With today’s rally, the odds are high that the Oscillator will be over +200 and, in turn, trigger a bullish signal.
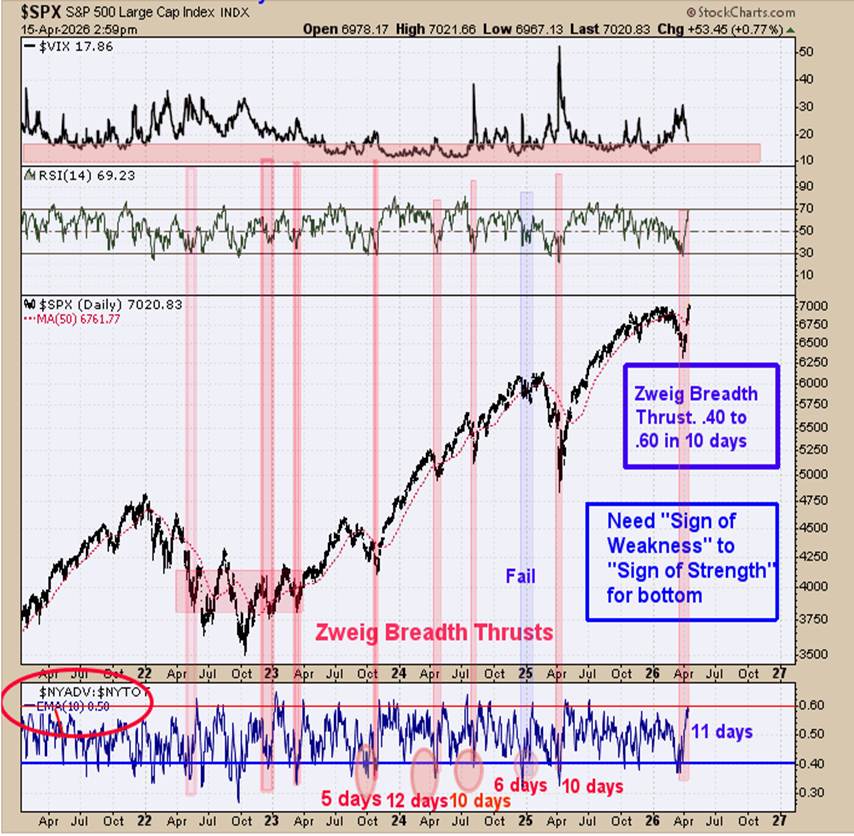
This chart goes along with the chart on page one. It's another indicator showing a “Selling Climax” to a “Sign of Strength”, which is what happens with significant lows in the market. Yesterday’s commentary still applies: “The bottom window is the Zweig Breadth Thrust indicator (ZBT). For a bullish setup, the ZBT would need to go from .40 to .60 in ten trading days. March 27, the ZBT reached .41 (close enough?), and today’s close is .60 (eleven trading days). The ZBT did not match the definition exactly, but came close and does warrant consideration. We noted the previous signal shaded in pink.” Adding to the bullish picture, the 10-day TRIN stands at 1.26 and the 5-day TRIN at 1.36, showing panic and bullishness.
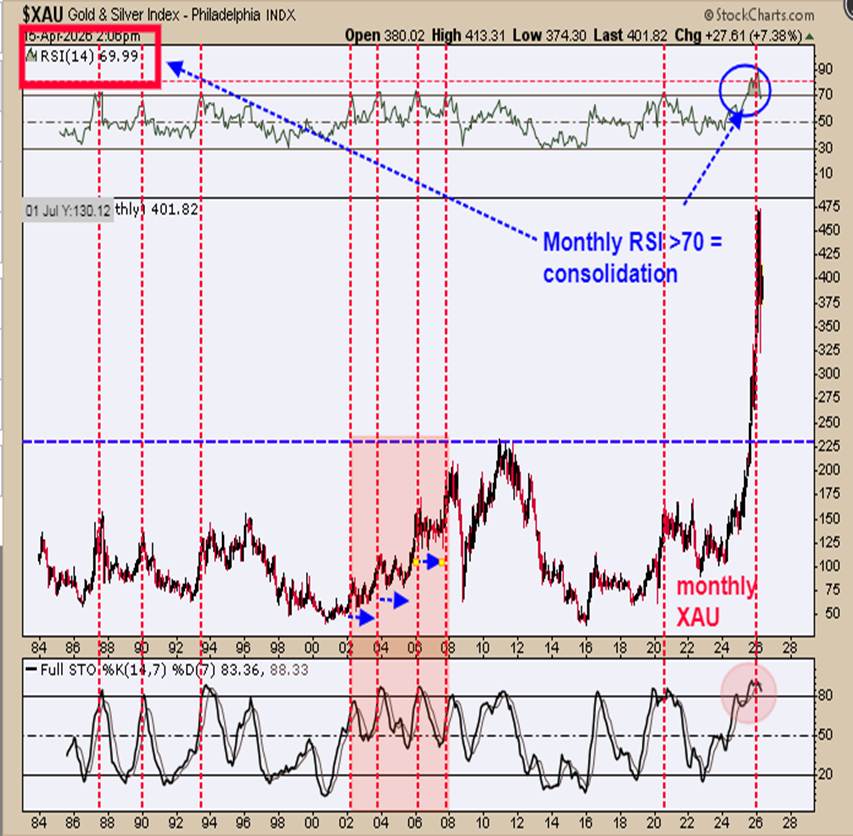
On yesterday’s report, we pointed out the likelihood of a trading range developing on GDX, where the 80.00 range is support and the 117.00 range is resistance. Above is the monthly XAU going back to 1984; the bottom window is the monthly full stochastic, and the top window is the monthly RSI for the XAU. We noted the times with red dotted lines when both the RSI and full stochastic reached overbought and turned down. Notice that both indicators have reached overbought levels and have turned down. There are similarities between and the 2000 low. We are expecting a consolidation that can last several months, which may look similar to the consolidation periods between 2000 and 2008 (shaded in pink with the blue arrow to note consolidations). Long GDX 9/29/25 at 75.76.

Comments
Log in or sign up to join the conversation.