


How Market Weakness Developed
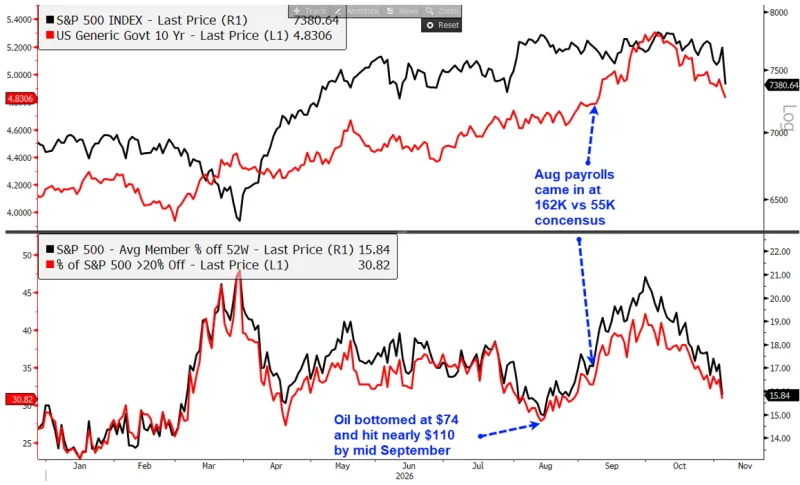
The S&P 500 reached a new all-time high in August 2026, and at first glance the economy and financial markets appeared to be on solid footing. Beneath the surface, however, warning signs were emerging. Oil prices rose from roughly $74 per barrel in mid-August to nearly $110 just a month later. Then, on September 4, the August nonfarm payroll report showed 162,000 jobs added, well above the consensus estimate of 55,000. Together, higher oil prices and stronger-than-expected employment data pushed Treasury yields higher and increased expectations for additional Federal Reserve rate hikes. Although the S&P 500 remained relatively stable, strength in a handful of technology stocks masked weakness across much of the broader market.
The first chart illustrates this divergence. In the top panel, the 10-year U.S. Treasury yield (red line) rose sharply in September as the S&P 500 (black line) stalled. In the bottom panel, the average S&P 500 stock moved increasingly far below its 52-week high, reaching nearly 21% below that high in early October (black line). In other words, while the headline index was near record levels, the average constituent had already experienced a decline consistent with bear-market territory.
The AI Trade Begins to Unwind
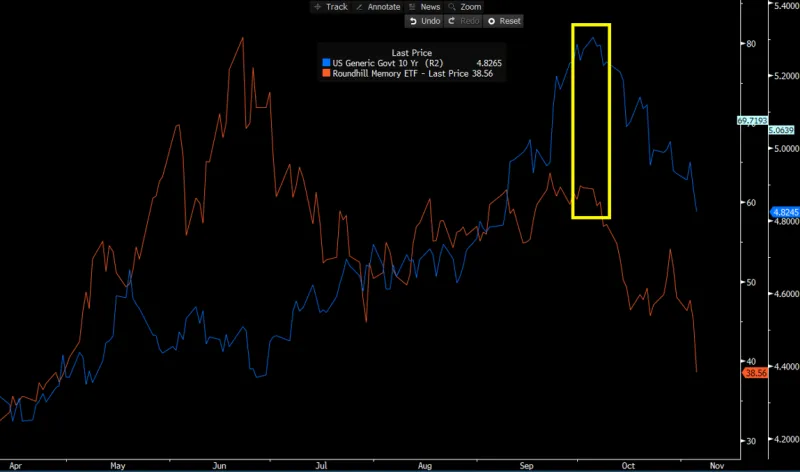
The market’s focus shifted in October toward the durability of the artificial intelligence (AI) capital spending cycle and the pace of data center construction. Concerns surrounding CoreWeave, memory stocks and semiconductor companies added to the pressure on AI-related shares. Investors increasingly sought safety in U.S. Treasuries, pulling yields lower. The chart below shows the 10-year Treasury yield (blue line) peaking around the time memory-related stocks (orange line) began to weaken sharply. Importantly, the market was not simply selling everything: capital also rotated into sectors outside technology. As the first chart shows, the share of S&P 500 stocks more than 20% below their highs declined from approximately 42% in early October to about 31% at the time of this writing (red line, bottom panel in figure above).
Lessons From the 2000 Technology Bust
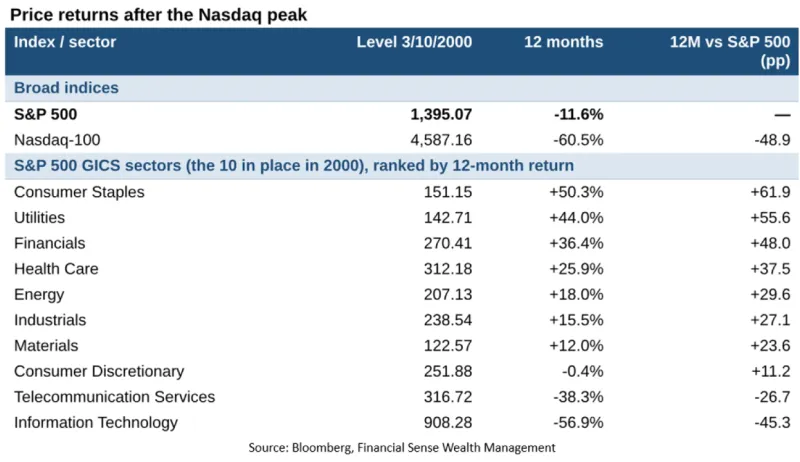
One risk we are considering is whether the current reassessment of AI spending could develop into a broader unwinding of technology valuations. Policy uncertainty following the Democratic sweep in the midterm elections may be contributing to these concerns, although it is too early to establish a direct causal relationship. The technology, media and telecommunications (TMT) bust of 2000 offers a useful historical comparison—not a forecast. Following the Nasdaq’s March 2000 peak, defensive sectors held up substantially better than technology and the broader market, as the chart below illustrates.
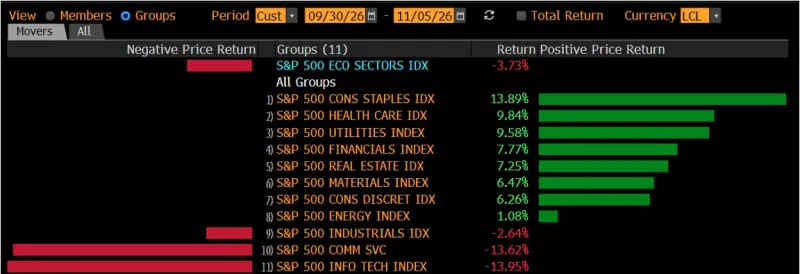
We have seen a similar leadership pattern since the end of September 2026. Consumer staples, health care, utilities and financials have outperformed, while information technology and communication services have lagged. This shift suggests that investors are favoring more defensive and value-oriented areas of the market as enthusiasm for AI-related growth stocks cools.
Credit Markets Flash a Warning
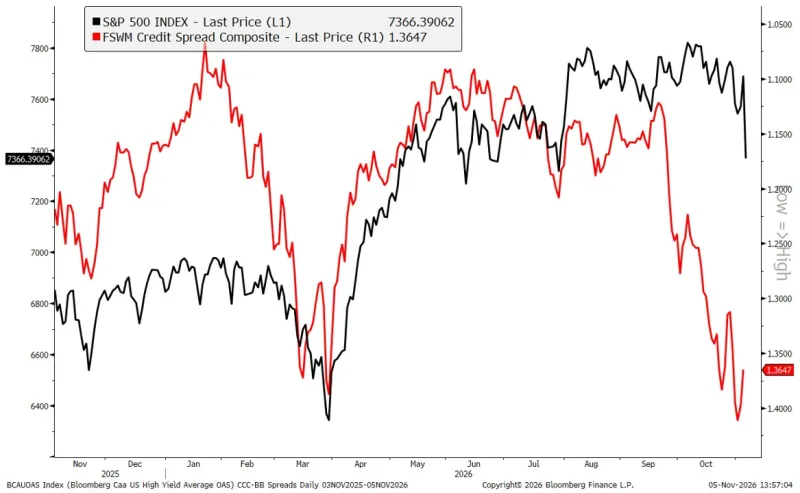
Another warning sign is the widening of credit spreads—the additional yield investors demand to own riskier corporate bonds rather than safer government bonds. Our proprietary credit-spread composite (red line, inverted in the chart below) began to deteriorate noticeably after the Federal Reserve’s September 16 rate hike, even as the S&P 500 traded largely sideways. Widening spreads can signal growing concern about financing conditions and the economic outlook.
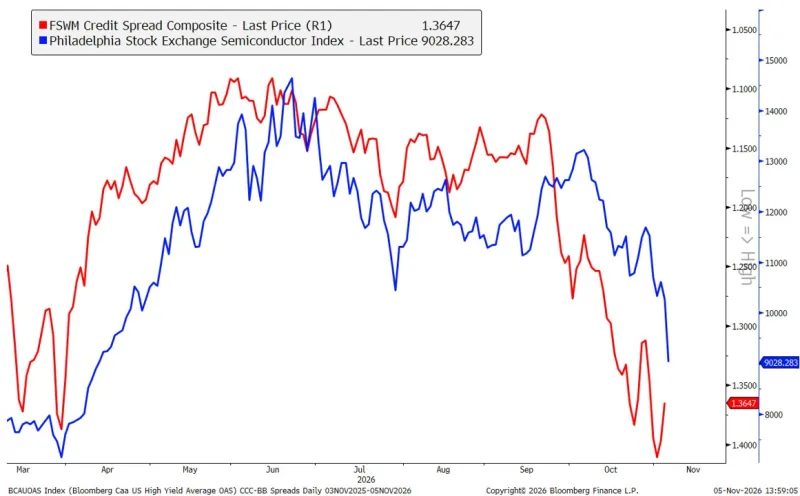
For much of this period, the stress was concentrated in technology-related investments rather than spread evenly across the market. The following chart compares our credit-spread composite (red line, inverted) with the Philadelphia Semiconductor Index (blue line). Their close relationship this year underscores how the deterioration in credit conditions has coincided with weakness in semiconductor stocks.
Could Data Center Spending Slow?
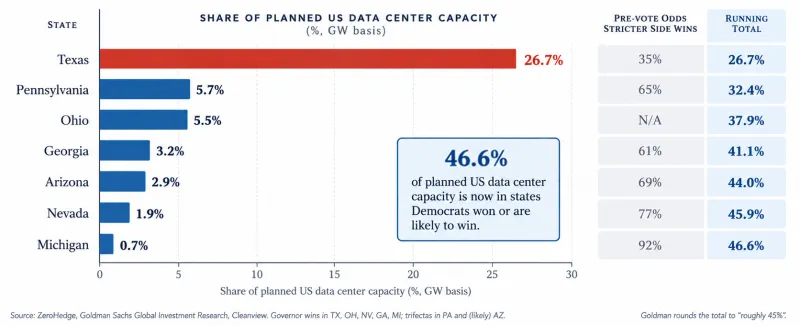
A central question is whether AI-related capital expenditures—and particularly data center construction—will slow materially. Research cited by ZeroHedge and Goldman Sachs suggests that almost half of proposed U.S. data center capacity is located in states affected by the changed political landscape. The accompanying chart highlights the geographic concentration of planned capacity. The investment implications depend on actual policy decisions, permitting, power availability and corporate spending plans; a change in political control alone does not establish that projects will be halted.
The Near-Term Catalyst: Employment Data
Where does the market go from here? As long as investors continue rotating among sectors, the broader market may remain relatively resilient. That was largely the story in October, when money moved from technology and growth shares toward value and defensive sectors. The selling on November 5, however, was far more widespread and appeared to reflect a rush to cash.
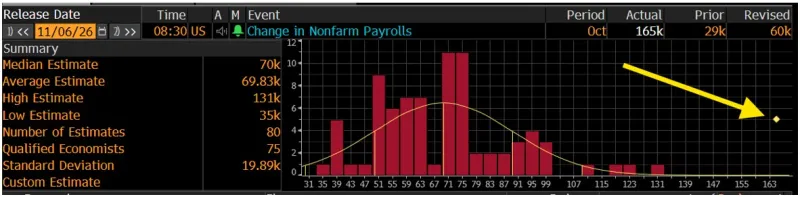
Bloomberg’s consensus estimate for the October jobs report was a gain of 65,000 jobs. The actual result was 165,000—above all 80 estimates submitted to Bloomberg. Not only was the October payroll figure a blowout, but the prior two months were revised higher by a combined 84,000 jobs, and hourly wages rose to a 3.1% annual growth rate. The strong jobs data increased the odds of a Fed rate increase next month from 68% to 78%.
For now, the resilient labor market lessens the odds of a recession, which means the market should stay afloat as investors rotate into other sectors. It is only when a recession appears likely that investors stop rotating among sectors and move to cash—and that is what sinks the stock market.
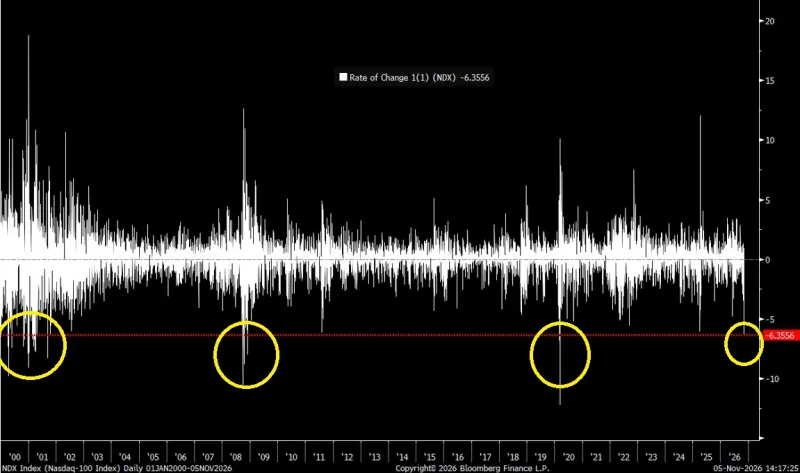
The Nasdaq 100 fell 6.36% on November 5, an unusually sharp one-day loss. Declines of this magnitude are more commonly associated with major periods of market stress, including the 2000–2001 technology bust, the 2008 financial crisis and the 2020 pandemic selloff. Markets typically rebound following similarly abrupt declines, which has been the case today despite the strong job’s report raising odds of a Fed rate hike next month.
What Could Support a Rebound?
There are also reasons not to become excessively bearish. Before this week, positioning among commodity trading advisors (CTAs)—systematic institutional managers whose strategies often respond to market trends—was already extremely negative. Citadel’s positioning measure was more than three standard deviations below its historical average, approaching the depressed levels seen in April following the initial outbreak of the Iran war. Such light positioning can create room for a rebound if selling pressure eases.
A second potential source of support is corporate buybacks. As earnings-related trading restrictions expire, more companies are able to resume buying back their own shares. Currently, buyback authorizations are at record levels. As Citadel research shows, October brought approximately $166 billion in new authorizations, more than twice its historical average. November and December have historically been strong consecutive months for actual repurchases. Authorizations do not guarantee execution, but they indicate a potentially meaningful source of demand as year-end approaches.
Seasonality following U.S. midterm elections provides another constructive historical perspective. Since 1950, the S&P 500 has been higher both six and twelve months after every midterm election, with a median gain of 14.5% at the twelve-month mark. Historical patterns are worth monitoring, although they do not guarantee similar results in this cycle.
Portfolio Positioning and the 2018 Comparison
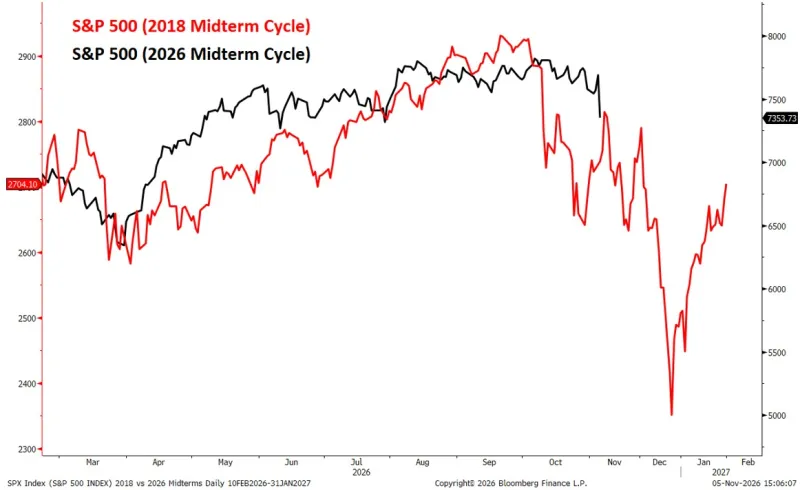
Taken together, these considerations argue against becoming overly bearish after a sharp selloff. Our portfolios are already positioned near the defensive end of our target ranges. That positioning helps manage downside exposure, but it also creates an important trade-off: a powerful market rally could cause defensive portfolios to lag. We are therefore weighing the risks of further weakness against the possibility of missing a meaningful recovery. The current market pattern also bears some resemblance to the 2018 midterm cycle: an initial, early-year decline, a recovery into late summer, early fall, and renewed fourth-quarter selling against a backdrop of Fed tightening and widening credit spreads. In December 2018, the Fed raised rates and stocks declined sharply; by January 2019, Fed communication had become more accommodative, with rate cuts following later that year. The comparison is instructive, but the present cycle may unfold differently.
Geopolitical Risks and Our Outlook
A final wildcard is the risk of renewed military escalation involving Iran. The conflict may have influenced voter sentiment in the midterm elections, but it would be difficult to attribute the election outcome to any single factor. With the elections behind us, we are monitoring the possibility that President Trump could intensify military operations. A renewed escalation could push oil prices higher, complicate the Federal Reserve’s inflation outlook and further disrupt business confidence at a time when AI-related capital spending has been an important support for growth. Our overweight position in energy could provide a partial hedge against higher oil prices, although it would not eliminate broader market risk. If geopolitical tensions, tighter financial conditions, and weaker AI spending begin reinforcing one another, recession risks could increase. We will continue monitoring these developments closely, reassessing portfolio positioning as conditions change, and keeping advisors and clients informed.



Comments
Log in or sign up to join the conversation.