


AUD/USD attracts sellers on Wednesday as softer-than-expected Australian inflation data weighs on the Australian Dollar (AUD), while persistent uncertainty surrounding a potential US-Iran peace deal keeps the US Dollar (USD) supported. At the time of writing, the pair is trading around 0.7136, down nearly 0.44% on the day.
Data released earlier on the day showed Australia’s Consumer Price Index (CPI) eased to 4.2% YoY in April from 4.6% in March, missing market expectations of 4.4%. Meanwhile, the Reserve Bank of Australia’s (RBA) closely watched Trimmed Mean CPI accelerated to 3.4% YoY from 3.3%, matching market forecasts.
The softer headline inflation reading, along with recent soft labor market data, prompted traders to scale back bets on near-term RBA rate hikes and reinforced expectations of a prolonged pause in the central bank’s tightening cycle.
On the geopolitical front, mixed signals surrounding ongoing US-Iran negotiations continue to keep broader market sentiment cautious, limiting downside pressure on the US Dollar.
Earlier in the day, Iran’s State TV reported that Tehran and Washington had prepared an initial unofficial framework for a memorandum of understanding (MOU). However, the United States later denied the reports, calling the alleged interim peace deal draft “a complete fabrication.”
The US Dollar Index (DXY), which tracks the Greenback’s value against a basket of six major currencies, is trading around the 99.20 mark after briefly slipping below 99.00 earlier in the European session.
Technical Analysis:
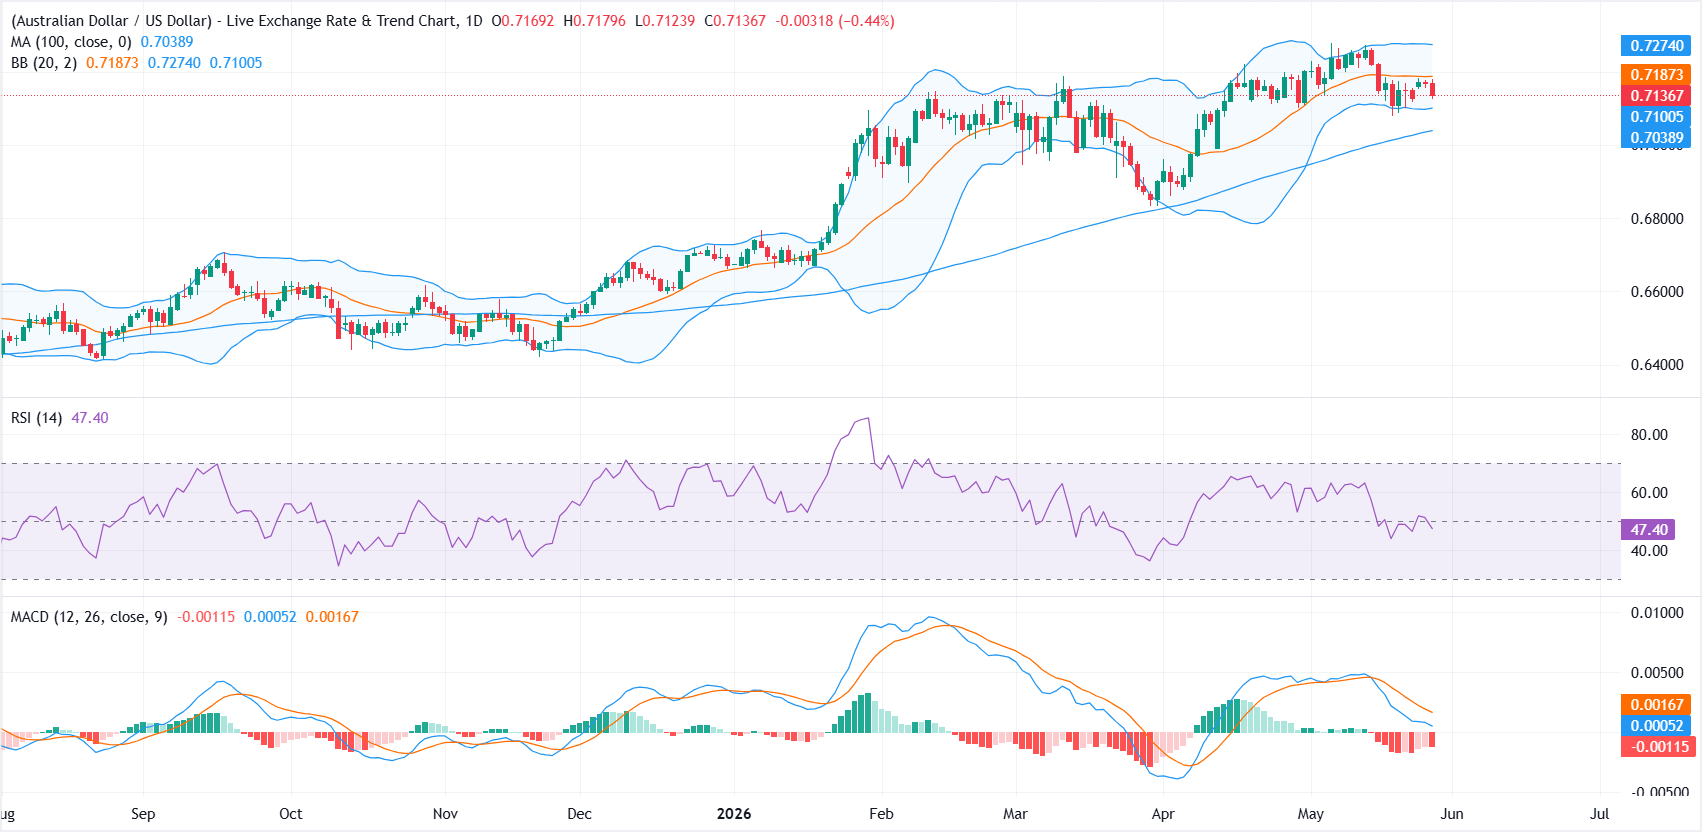
On the daily chart, AUD/USD holds under the 20‑day Bollinger Simple Moving Average (SMA) at 0.7187, leaving near‑term price action capped inside the upper half of the recent volatility envelope, while still holding above the 100‑day moving average (MA) at 0.7038.
This configuration, combined with a Relative Strength Index (RSI) easing toward the mid‑40s and a slightly negative Moving Average Convergence Divergence (MACD) reading, suggests fading upside momentum and a neutral to mildly bearish bias as buyers lose traction below short‑term dynamic resistance.
On the topside, initial resistance is located at the 20‑day Bollinger SMA around 0.7187, with a break higher exposing the upper Bollinger band near 0.7274 as the next hurdle.
On the downside, the lower Bollinger band around 0.7100 offers immediate support; a sustained move beneath this area would likely draw AUD/USD back toward the 100‑day MA near 0.7038, where broader trend support is expected to attract dip‑buyers on a first test.



Comments
Log in or sign up to join the conversation.