


The Australian Dollar (AUD) edges lower against the US Dollar (USD) on Friday, with AUD/USD extending losses for a fourth straight day as the Greenback remains broadly supported amid ongoing geopolitical tensions in the Middle East. At the time of writing, the pair is trading around 0.6866, slipping to fresh two-month lows.
The US Dollar continues to draw support from its status as the world’s primary reserve currency, with investors turning to the Greenback to meet funding needs and seek safety during periods of heightened market stress.
At the same time, rising Oil prices are indirectly boosting demand for the USD, as global crude transactions are largely priced in Dollars, leaving risk-sensitive currencies such as the Australian Dollar under sustained pressure.
The US Dollar Index (DXY), which tracks the Greenback’s value against a basket of six major currencies, is trading around 100.19 and is poised to finish the week higher by over 0.50%. In contrast, AUD/USD is heading for a weekly decline of over 2%, marking its steepest drop since October 2025.
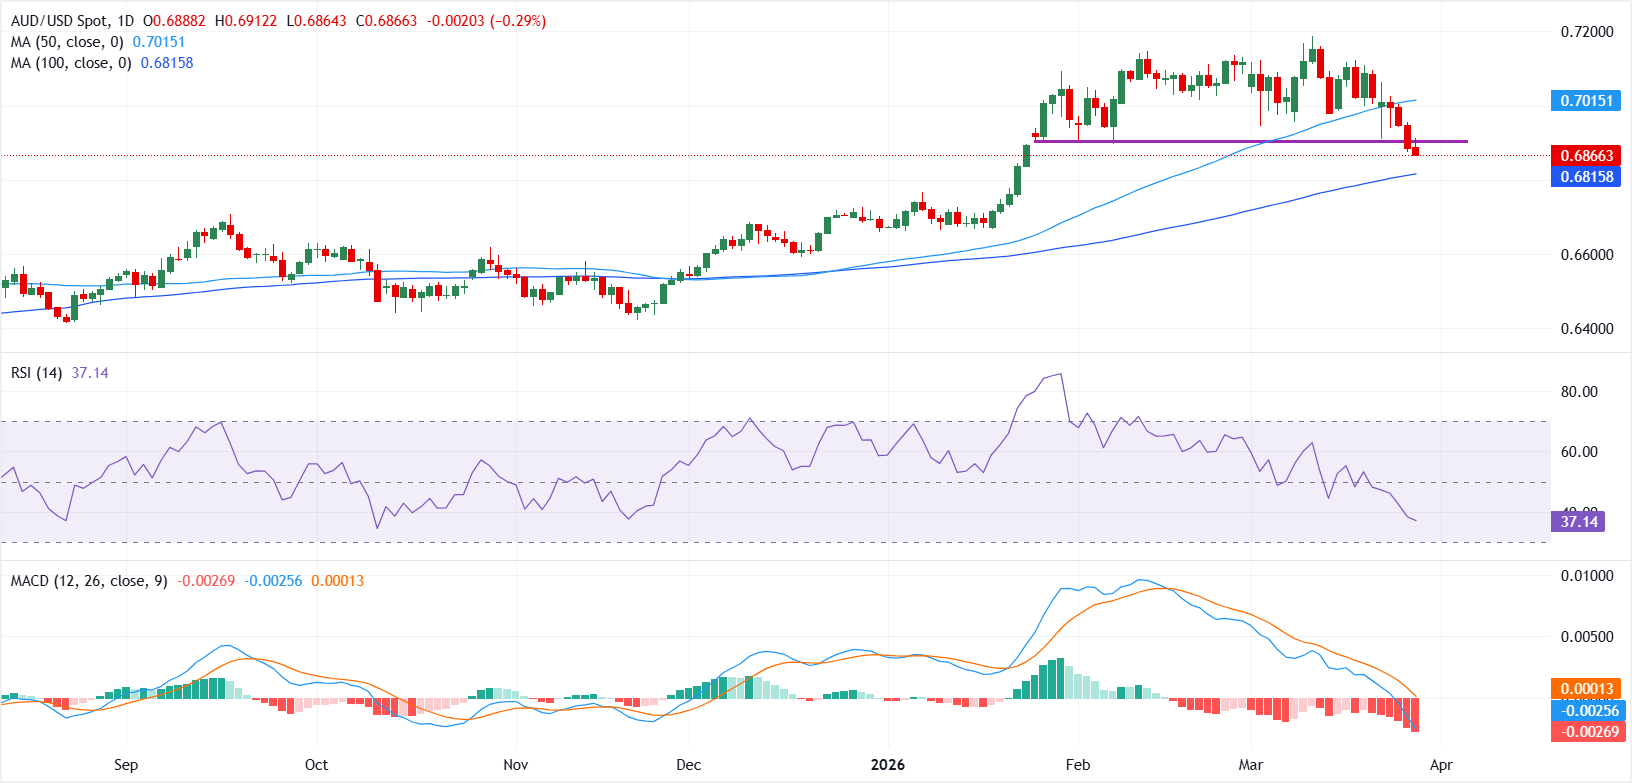
From a technical perspective, the AUD/USD outlook has turned bearish after breaking below the 0.7000 psychological level, which closely aligns with the 50-day Simple Moving Average (SMA) at 0.7015.
The latest leg lower has also driven the pair under the multi-month support zone around 0.6900, reinforcing downside pressure and signaling a shift in near-term market structure.
The Relative Strength Index (RSI) retreats toward 37, showing weakening momentum without reaching oversold territory, which suggests room for further downside pressure. The Moving Average Convergence Divergence (MACD) line remains below its signal and drifts deeper into negative territory, with a slightly expanding negative histogram, reinforcing the downside tone in the short term.
On the downside, immediate support is seen at the 100-day Simple Moving Average (SMA) around 0.6815. A daily close below this level could expose the next bearish target near the 0.6700 psychological mark, a previous breakout zone that could cap further downside.
On the upside, the 0.6900 zone now acts as immediate resistance, having previously served as a key support level. A sustained move above the 100-day SMA, around the 0.7000 handle, would be needed to ease bearish pressure and signal a continuation of the uptrend.



Comments
Log in or sign up to join the conversation.