


The AUD/USD pair oscillates in a narrow range during the Asian session on Wednesday and moves little following the release of mixed inflation figures from China. Spot prices currently trade around the 0.7025 region, nearly unchanged for the day, and remain within striking distance of a nearly two-month low set on Tuesday.
Renewed hostilities between the US and Iran temper hopes for a deal to end the over three-month-old war. This, in turn, weighs on investors' sentiment, which, along with diminishing odds of a rate hike by the Reserve Bank of Australia (RBA) in June, acts as a headwind for the risk-sensitive Aussie. The US Dollar (USD), on the other hand, remains on the back foot as bulls opt to wait for the release of the latest US consumer inflation figures before placing fresh bets, offering some support to the AUD/USD pair.
Meanwhile, concerns about the inflationary impact of surging global energy prices stemming from prolonged tensions in the Middle East resurfaced after data released from China showed that producer prices rose to the highest since July 2022. This reaffirms market expectations that major central banks, including the US Federal Reserve (Fed), will stick to a hawkish stance. The outlook, in turn, favors the USD bulls and suggests that the path of least resistance for the AUD/USD pair is to the downside.
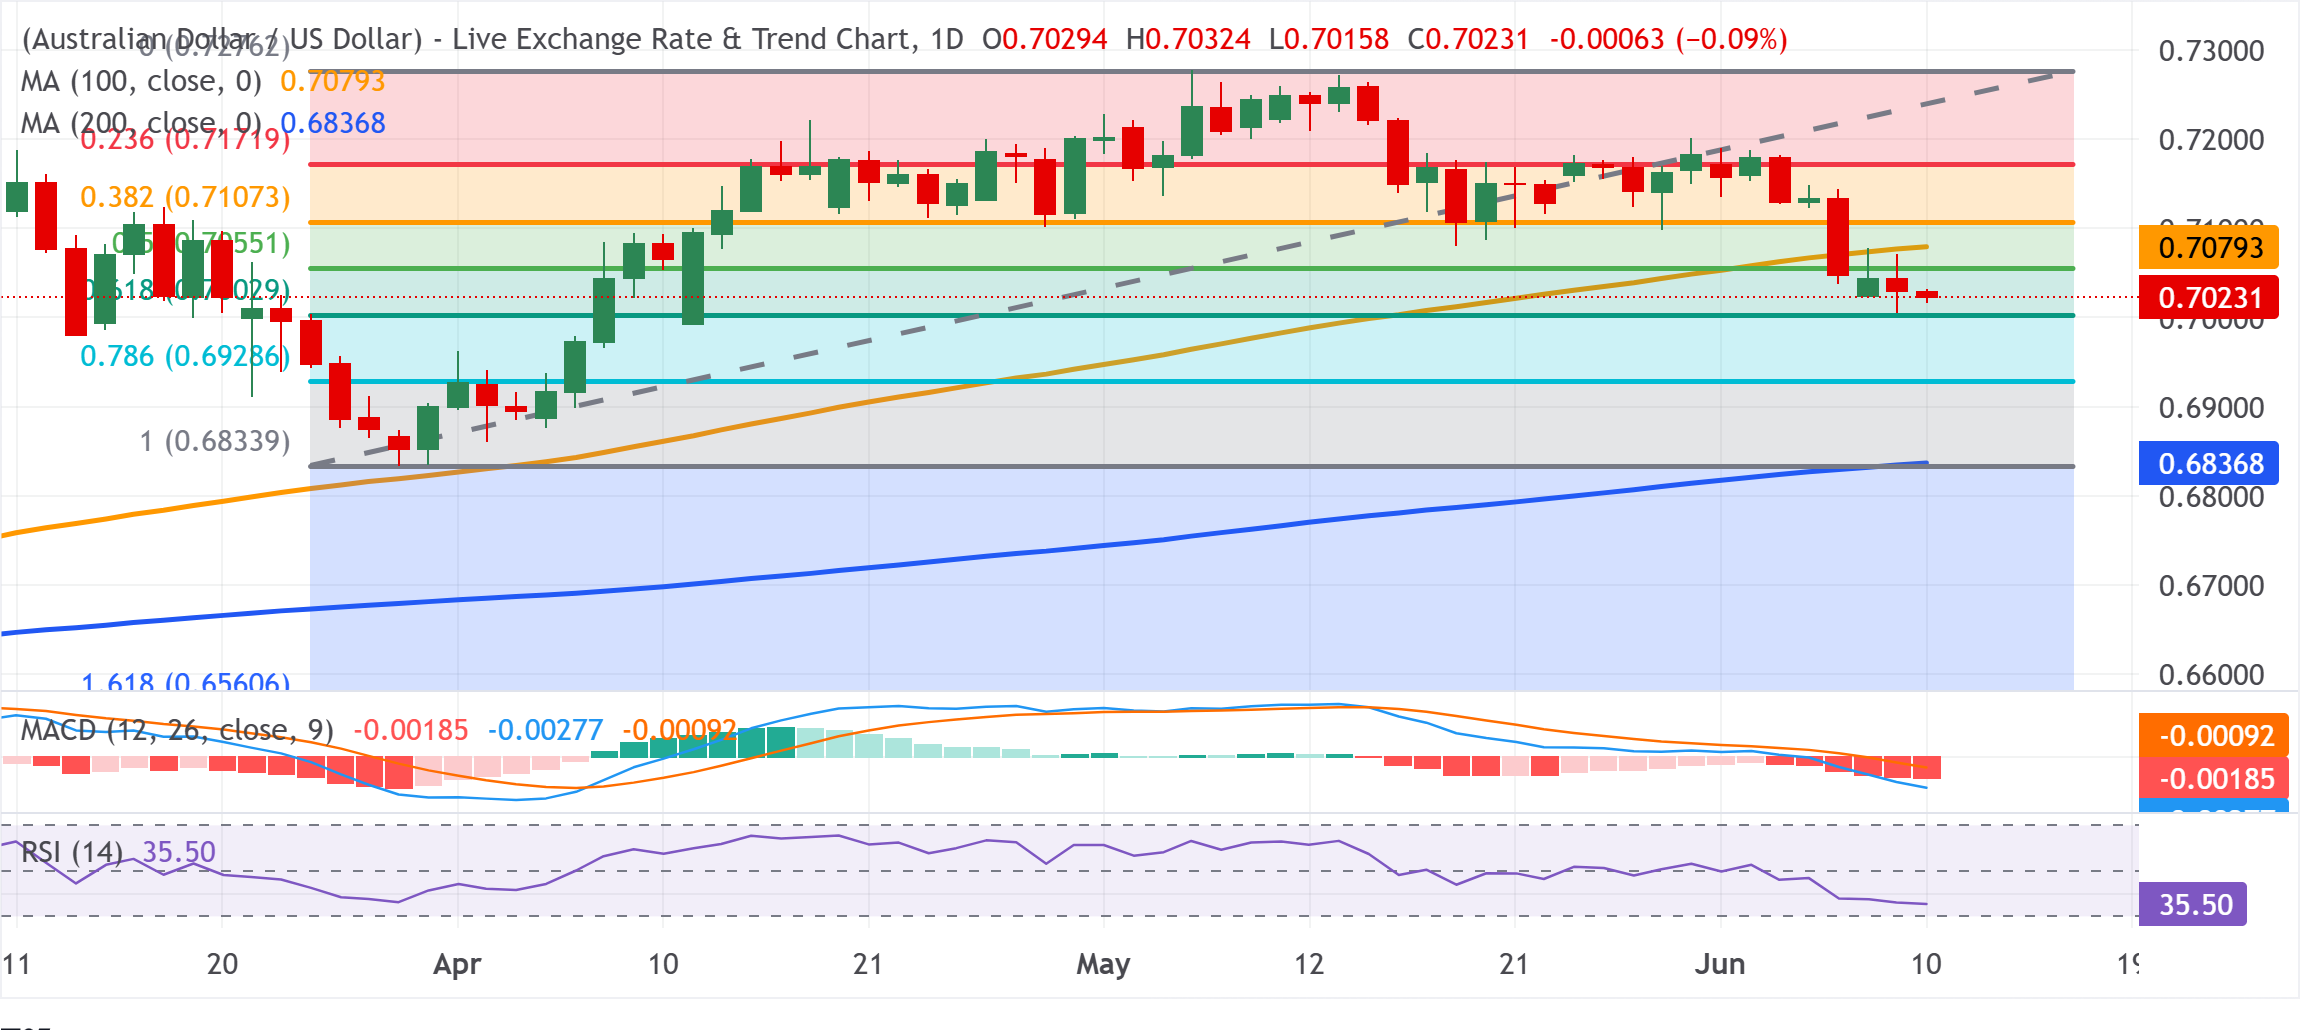
From a technical perspective, this week's repeated failures near the 100-day Simple Moving Average (SMA) support-turned-resistance validate the near-term bearish outlook. Moreover, the negative Moving Average Convergence Divergence (MACD) and a Relative Strength Index near 35 suggest downside pressure is still dominating. The AUD/USD pair, however, remains marginally above the 61.8% Fibonacci retracement level of the March-May upswing, at 0.7003, warranting caution for bears.
Hence, it will be prudent to wait for a convincing break below the said pivotal support before positioning for an extension of the fall to the 78.6% retracement at 0.6929. The downward trajectory could eventually drag the AUD/USD pair to the 200-day SMA, which coincides with the March swing low, in the 0.6837–0.6834 region.
On the topside, initial resistance is seen at the 50% retracement at 0.7055, followed by the 100-day SMA at 0.7079. A sustained break above these would open the way toward the 38.2% Fibo. level at 0.7107 and then the 23.6% retracement at 0.7172, ahead of the cycle high zone near 0.7276.
AUD/USD daily chart

Comments
Log in or sign up to join the conversation.