

Wall Street remains generally constructive on AT&T (T) heading into year-end. Investing.com shows 16 Buy, nine Hold, and one Sell rating. The average 12-month target stands near $29.05, above the recent $24.90 price. Moreover, Morgan Stanley raised its target from $27 to $28 on September 28. BNP Paribas also upgraded AT&T to Outperform and raised its target to $30. Therefore, analysts broadly expect additional upside, although some firms remain cautious.
Fundamentally, investors will focus on AT&T’s October 21 earnings and fourth-quarter cash generation. Management still expects more than $18 billion in 2026 free cash flow. Additionally, AT&T expects strong year-over-year free cash flow growth during the fourth quarter. Fiber and wireless growth should remain important catalysts, while share repurchases could provide further support. However, higher leverage and legacy-business weakness remain risks. Overall, current analyst sentiment supports the bullish technical outlook into year-end.
Elliott Wave Outlook: AT&T (T) Weekly Chart July 12th, 2026
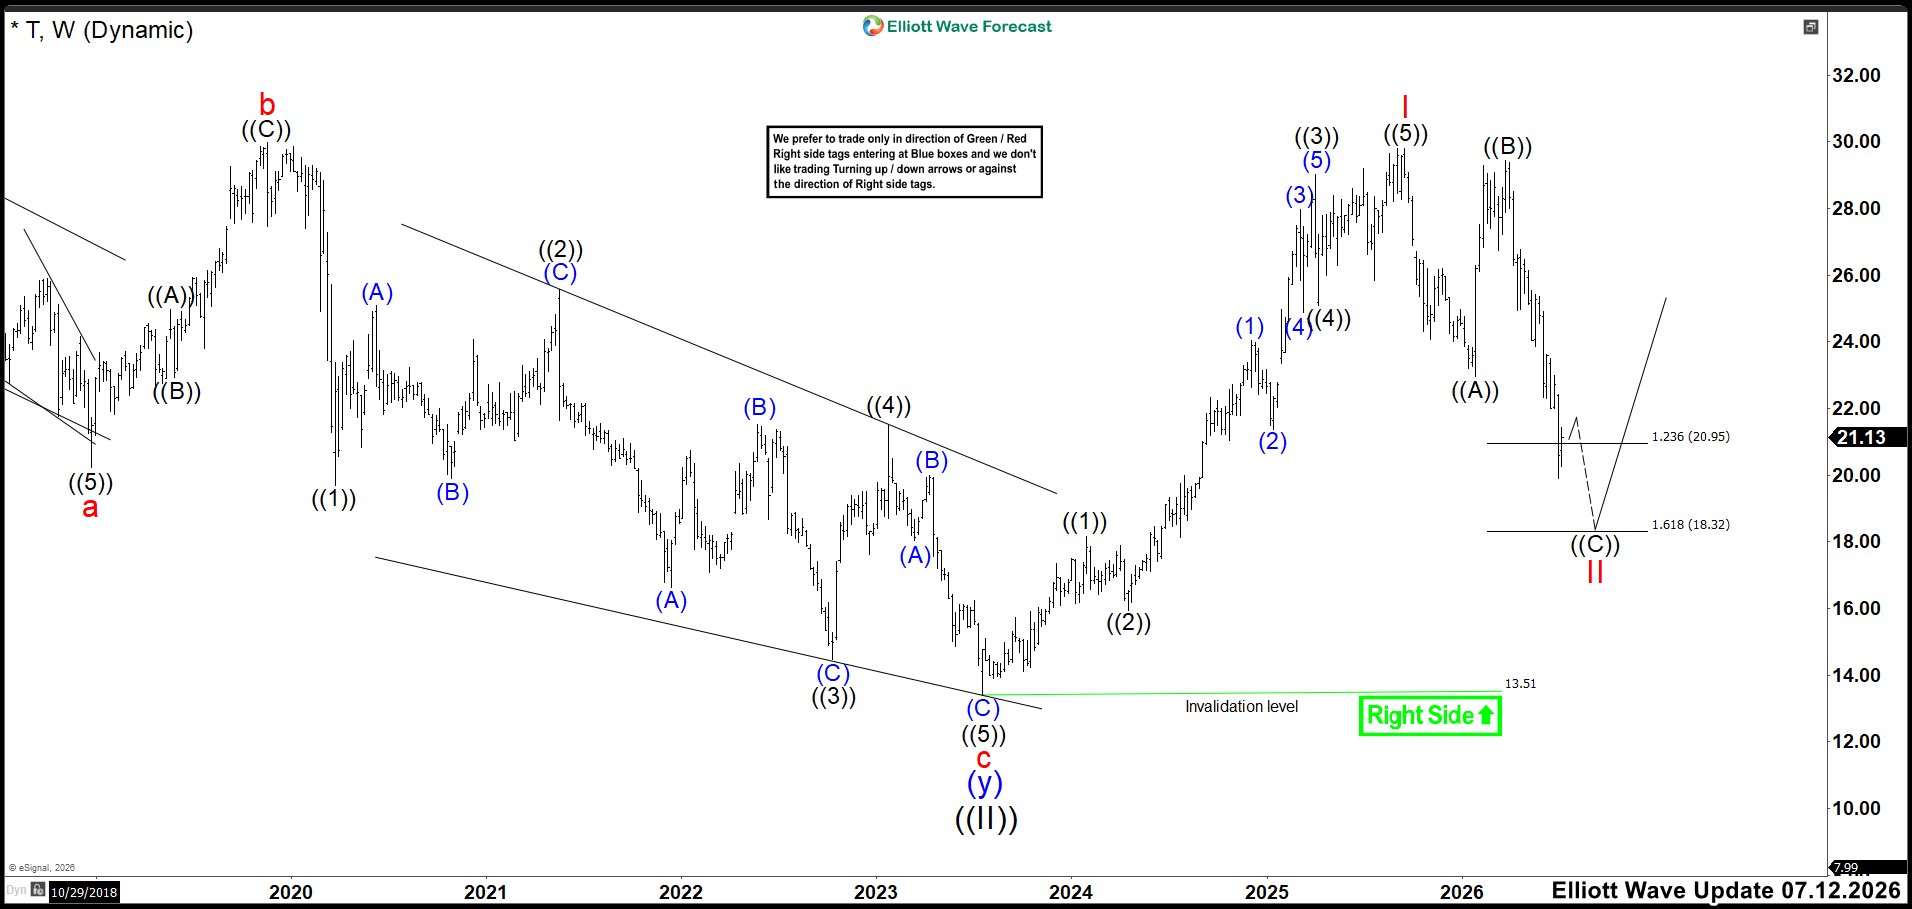
In our July forecast, we expected AT&T (T) to complete wave II within the 20.95–18.32 support area. We also expected that zone to provide the base for the next bullish move. However, we noted that the flat correction could extend deeper before turning higher. Therefore, a decline toward the 1.618 extension at 18.32 remained possible.
Elliott Wave Principle Behind the Market Structure
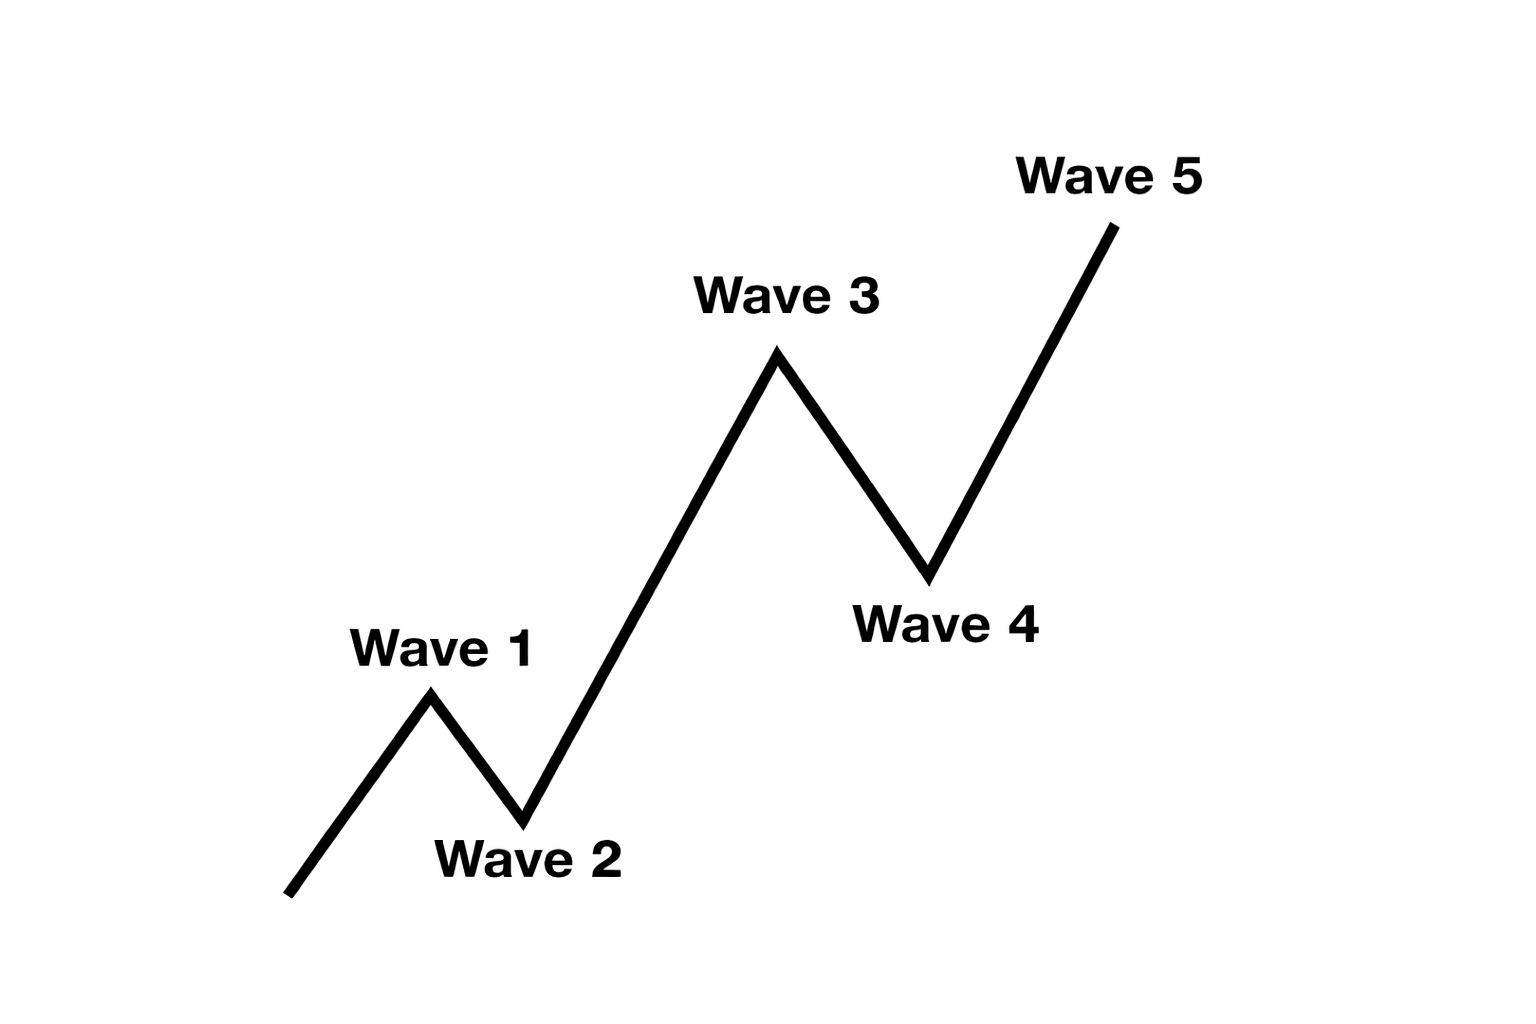
Impulse
An impulse is a clean 5‑wave pattern that drives the trend forward.
Waves 1‑3‑5 are strong and directional.
No overlap between waves 1 and 4.
Wave 3 is usually the strongest.
Structure is clear, with increasing momentum.
Elliott Wave Outlook: AT&T (T) Weekly Chart September 28th 2026
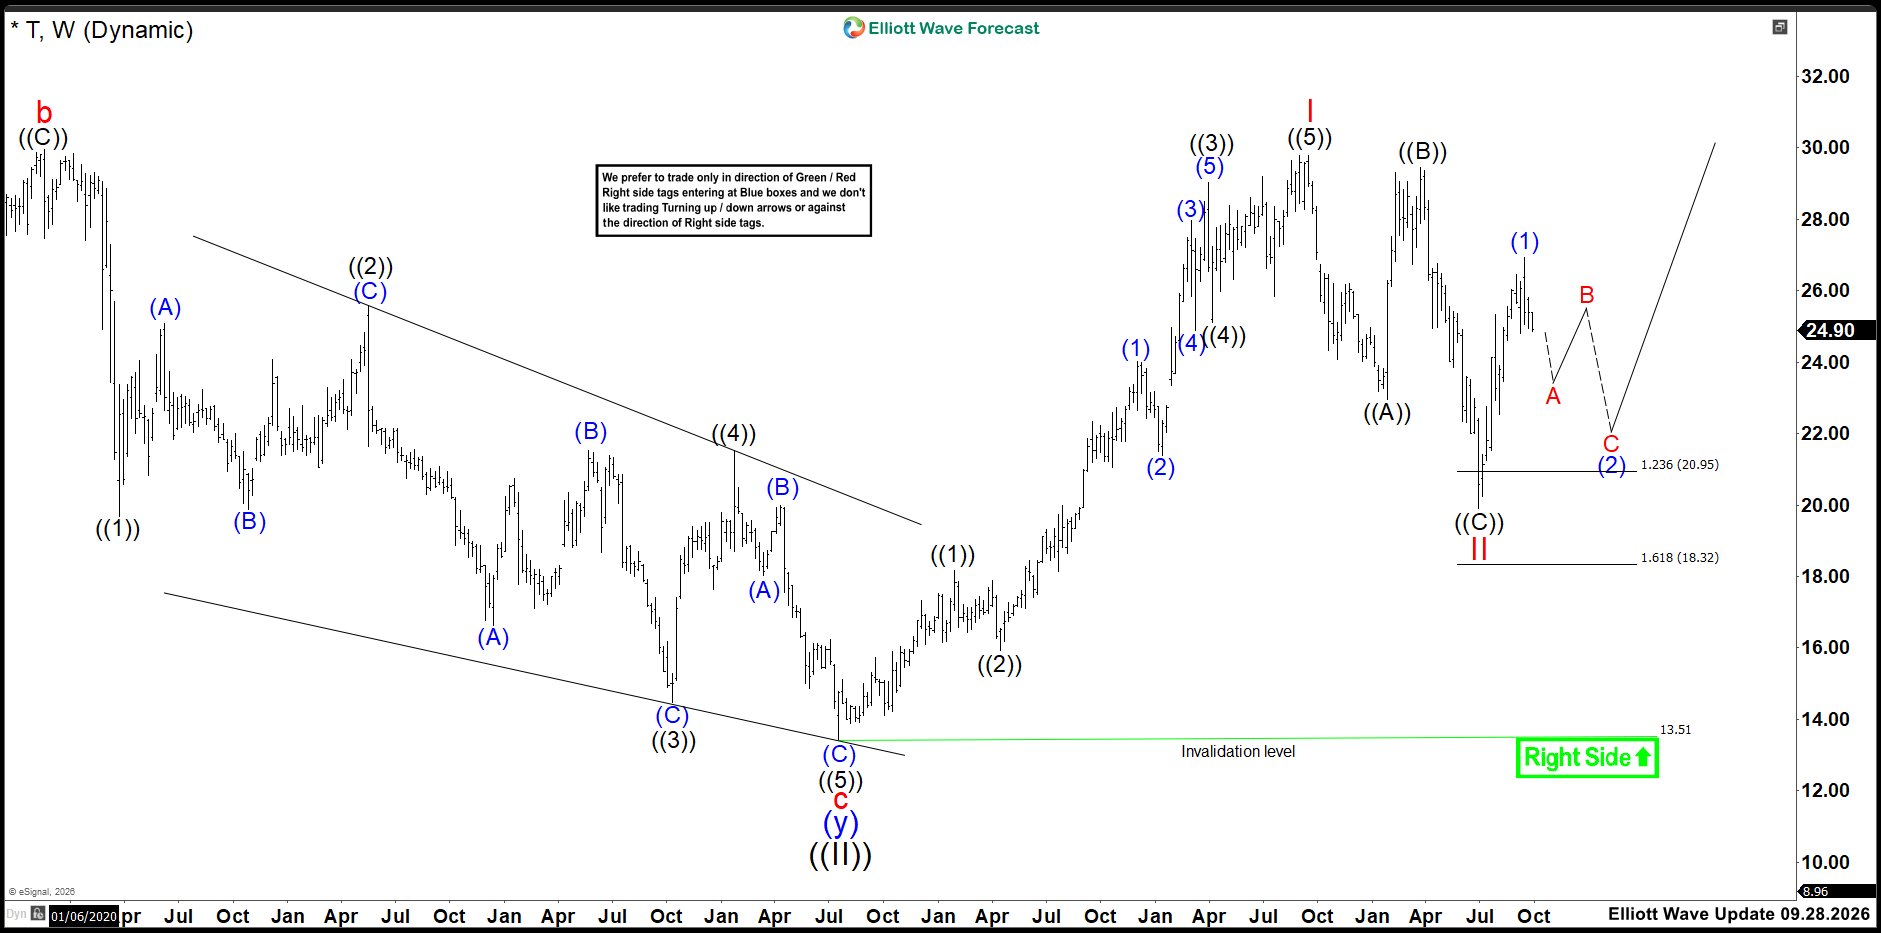
AT&T (T) reacted higher from the expected support area projected. The rally completed wave (1) near the 26.00 area. Since then, the stock has started a corrective wave (2). The chart favors an ABC structure for this pullback. Wave A can decline toward the 23.00 area before wave B produces a corrective bounce. Then, wave C can resume lower and complete wave (2) near the 20.95 area.
As long as price stays above the wave II low, we expect the bullish sequence to continue. AT&T should eventually break above the wave I high near 30.00. However, a break below the wave II low would open the door to a larger double correction. That correction could extend toward 18.32 or lower. Still, the long-term structure remains bullish while price stays above 13.51.



Comments
Log in or sign up to join the conversation.